Rethabile F. Masenyetse, Sephooko I. Motelle
Research Department, Central Bank of Lesotho, Lesotho
Correspondence to: Sephooko I. Motelle, Research Department, Central Bank of Lesotho, Lesotho.
| Email: |  |
Copyright © 2012 Scientific & Academic Publishing. All Rights Reserved.
Abstract
The paper analyses the relationship between government revenue and expenditure in Lesotho using quarterly data for the period 1991 to 2009. We employ granger causality test, Johansen procedure and error correction model based granger causality test to ascertain whether there is unidirectional causality from taxation to revenue, unidirectional causality from spending to taxation, bidirectional causality or no causality between the two variables. The results indicate that there is unidirectional causality from revenue to expenditure which calls for urgent policy reforms given the eminent decline in Southern African Customs Union (SACU) revenue which accounts for 55 per cent of the total government revenue in Lesotho. In addition, the study finds that causality runs from revenue to recurrent expenditure while there is no causality between revenue and capital expenditure which suggests that more emphasis should be put on capital expenditure.
Keywords:
GovernmentRevenue, Government Expenditure, Granger Causality Test
Cite this paper: Rethabile F. Masenyetse, Sephooko I. Motelle, Government Revenue - Expenditure Nexus in Lesotho: the Decline in SACU Revenue, American Journal of Economics, Vol. 2 No. 1, 2012, pp. 8-14. doi: 10.5923/j.economics.20120201.02.
1. Introduction
The Southern African Customs Union (SACU) has its origins from 1910. Following the independence of the three states, , and Swaziland (BLS) in 1966, a new agreement was signed in 1969. This agreement was renegotiated and signed in 2004 thereby incorporating more democratic principles in the management of the union. The revenue from the SACU pool has been a historical fiscal bulwark for the economy of , supporting an enormous chunk of government expenditure. SACU has, recently been confronted by a number of challenges which have implications on the economy of . First, the advent of global trade liberalization meant that SACU countries had to begin to reduce tariffs in line with their commitments at the World Trade Organisation (WTO). Second, in an effort to enhance benefits arising from free trade, SACU member states engaged on a program to negotiate various trade agreements with other regional bodies. These efforts over the medium term would reduce the size of SACU revenue pool which relies on tariffs. Finally, the financial crisis and the subsequent global recession worsened the already vulnerable situation. It dampened demand for capital and consumer imports in the SACU region.Eita and Mbazima (2008) pointed out the importance of understanding the relationship between government revenue and expenditure for prudent and credible fiscal policy which can prevent continuous government deficits. For example,they argue that if a unidirectional causality from government revenue to expenditure exists, then “unsustainable fiscal imbalances (deficit) can be mitigated by policies that stimulate government revenue.” Against this background, this paper attempts to test the causality between government revenue and expenditure in Lesotho using quarterly data from 1991 to 2009. We contribute to the empirical literature of the relationship between government spending and revenue by including an analysis which decomposes government expenditure into its categories. The study is undertaken at the opportune time for Lesotho when the SACU revenue which has been the mainstay of government revenue and accounts for 55 per cent of total government revenue is declining due to the financial crisis and continued liberalisation of trade in the region. Following this introduction, the rest of the paper is organised as follows, section 2 presents an overview of government expenditures and revenues in Lesotho, and section 3 provides an overview of the literature on the government revenue-expenditure nexus. Section 4 presents the empirical methodology and section 5 covers the data analysis and empirical results. Section 5 concludes the paper.
2. Overview of Government Expenditure and Revenue in Lesotho
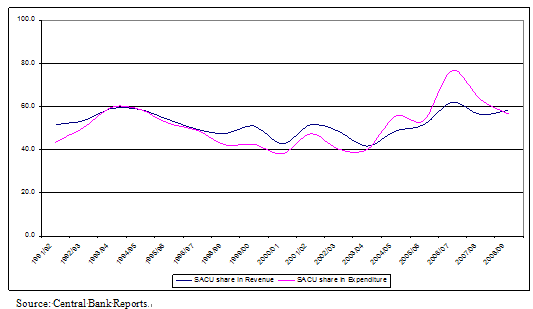
During the period 1991 to 2009, fiscal policy in Lesotho has generally been balanced. Government revenue averaged M890.58 million during the period. It reached a maximum of M2302.6 million and a minimum of M179.9 million. As relates to Government expenditure, it averaged M839.2 million during the period reaching a maximum of M3008.1 million and a minimum of M188.5 million. While the general position is largely balanced, the period post 2006 can be characterised as a period of strong growth in both expenditure and revenue coupled with large surpluses and higher volatility.The large share of Lesotho revenue is from SACU revenue pool.2 SACU accounts for an average of 52.2 per cent of total revenue and 51.2 per cent of total expenditure.As shown in Figure 2 below, following some continued decline in the late 1990s, SACU rose significantly in 2004 after the introduction of the 2002 SACU agreement. The agreement introduced a revised revenue sharing formula which had some volatility.| Table 1. Descriptive Statistics |
| | | Expenditure | Revenue | | Mean | 839.2240 | 890.5813 | | Median | 737.0000 | 722.0000 | | Maximum | 3008.100 | 2302.600 | | Minimum | 188.5000 | 179.9000 | | Std. Dev. | 536.9550 | 595.5681 | | Skewness | 1.452059 | 1.112416 | | Kurtosis | 5.576610 | 3.137845 | | Jarque-Bera | 47.10256 | 15.52774 | | Probability | 0.000000 | 0.000425 | | Sum | 62941.80 | 66793.60 | | Sum Sq. Dev. | 21335730 | 26247902 | | Observations | 75 | 75 |
|
|
3. Literature Survey
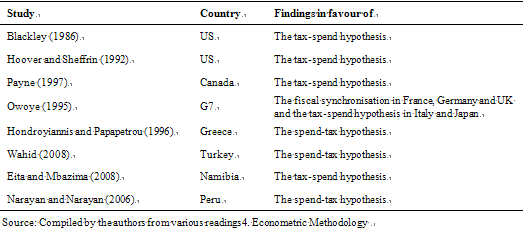
Theory postulates four relationships between government revenue and spending. First, the revenue-spend hypothesis posits that spending adjusts to the level of revenue (Friedman, 1978)1. Thus, there is a unidirectional causality running from revenue to spending. Second, the spend- revenue hypothesis argues that changes in spending result in changes in revenue hence a unidirectional causality running from revenue to spending (Peacock and Wiseman, 1979). Third, fiscal synchronisation hypothesis posits a bidirectional causality between government revenue and spending. According to this hypothesis, the revenue and spending decisions inform each other (Meltzer and Richard, 1981). Last, the institutional separation hypothesis which argues that government spending and revenue decisions are made independent of each other hence there is no causality between the two (Baghestain and McNown, 1994).The empirical literature on the relationship between government revenue and expenditure in developed countries is quite voluminous. However, the evidence is still scarce in developing African countries. The case is the same for Southern African Customs Union (SACU) countries. The studies on the revenue expenditure nexus have mainly used the granger causality test. Generally, there has been consensus on this methodology as used in recent studies on the revenue-expenditure nexus. Beginning with the studies that looked at the group of countries, Fasano and Wang (2002) investigated the relationship in the Gulf Cooperation Countries (GCC) which includes Bahrain, Kuwait, Oman, Qatar, Saudi Arabia and United Arab Emirates (UAE). These countries’ government revenue depends on oil revenue. It is estimated that oil receipts account for 75 per cent of the total revenue, hence the fluctuations in oil prices lead to volatility in government revenue and spending. The results indicate that for all GCC countries the revenue spend hypothesis holds. Owoye (1994) investigated the causal relationship for the G7 countries using annual data for the period 1961-1990. The study also applied the cointegration and error correction models. The results showed that in all G7 countries except and the bidirectional causality holds. In Japan and Italy there is unidirectional causality running from revenue to expenditures. Among SACU members, a number of studies have been undertaken in the case of South Africa. Nyamongo et al (2007) using monthly data for the period October 1994 to June 2004 found evidence for bidirectional causality in . They tested for seasonal unit roots and employed Vector Error Correction methodology. Lusinyan and Thornton (2007) investigate the relationship in South Africa using the annual data for the period 1895 to 2006. They found that for the full sample there is fiscal synchronisation. However, there has been shift in causality over time. Ndahiriwe (2007) also looked at the case of but used both annual and quarterly data for the period 1960 to 2005. The study found that the results are sensitive to the frequency of data. The annual data pointed to bidirectional causality while quarterly showed evidence of no causality.Moalusi (2004) looked at causality between government revenue and expenditure in Botswana using annual data for the period 1976 to 2000. The results indicate unidirectional causality running from revenue to spending. Eita and Mbazima (2008) using annual data covering the period 1977 to 2007 for found that there is a unidirectional causality running from revenue to spending. The case for Namibia and Botswana are important for this study since like Lesotho, a sizable part of the revenue of their governments is from SACU. The fact that the empirical results on the government revenue-expenditure nexus are mixed indicate the sensitivity of these results to peculiarities associated with the circumstances and the environment within which fiscal policy is undertaken in different countries (see Table 2). Narayan and Narayan (2006) indicated that there are different implications for the conduct of fiscal policy following from the hypothesis that holds. For example, if the revenue-spend hypothesis holds, the budget deficits can be avoided through revenue stimulating policies, and if the fiscal synchronisation hypothesis holds then government expenditure could rise faster than revenue. If the spend-revenue hypothesis holds then this suggests that government spends first and then raises taxes later to finance the spending.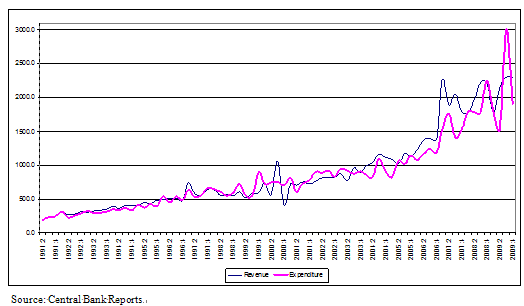 | Figure 1. Government Expenditure and Revenue in Lesotho (1991:2-2009:4)(Million Maloti) |
 | Figure 2. SACU as a Share of Expenditure and Revenue in Lesotho (1991/92-2008/09) (Per Cent) |
Table 2. Empirical evidence on the government revenue-expenditure nexus is mixed
 |
| |
|
4. Econometric Methodology
The empirical methodology in the study begins with the investigation of univariate characteristics of the data to be used. It is important that the presence of unit root in the variables is determined because using such data in a regression model violates one of the assumptions of the classical regression model and may lead to spurious results (Enders: 2004). The Augmented Dickey Fuller (ADF) test is used for this purpose. Second, we investigate the existence of the long run relationship using the Johansen co-integration procedure. The procedure addresses the problems posed by Engle and Granger two-step procedure (Hall, 1989). It uses the maximum likelihood estimation. The methodology considers the following unrestricted vector auto-regression model: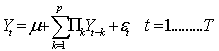 | (1) |
Since  is non-stationary and has to be differenced to be stationary, the equation can be written in error correction form as follows:
 | (2) |
Where and
and  . The lag length is chosen to ensure that the errors are identically and independently distributed (IID) with mean zero and variance
 . The rank of the matrix
  tells us about the number of cointegrating vectors. The cointegrating rank can be tested by two likelihood ratio tests; Trace statistic and Maximum eigen value. The statistics are defined by the following equations respectively:
 | (3) |
Where is the ratio of restricted maximised likelihood to the unrestricted maximised likelihood. | (4) |
Enders (2004) points out the difference between the two. Trace statistic tests the null hypothesis that the number of cointegrating vectors is less than or equal to  while maximum eigen value tests the null that the number of cointegrating vectors is
 against the alternative of
  cointegrating vectors. The cointegrating vectors are then explicitly included in the estimation of the short-run VAR in error-correction form. The error-correction term is then entered lagged once. The error-correction term is expected to bear a negative sign for convergence.Third, we investigate causality within the VECM framework. The concept of causality can be traced back to the work of Granger (1969). Hence it is often referred to as Granger causality tests. Geweke (1984) and Charemzaet. al. (1997) argue that the definition of causality is more philosophical than empirical. This is because in most cases ‘cause’ is similar to ‘force’ or ‘produce’ but in econometrics causality is used along the lines of ‘predict’. Charemza et. al. (1997) provides the following formal definition of causality: ‘
 is a granger cause of
 , if the present value of
  can be predicted with better accuracy by using past values of rather than by not doing so, other information being identical’. The test is performed by estimating the autoregressive processes for and as define by:
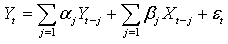 | (5) |
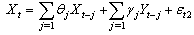 | (6) |
The following results are possible; First there is unidirectional causality from  to
to  if the coefficients on the lagged
  in equation 5 are statistically different from zero and the estimated coefficients on the lagged
  in equation 6 are not statistically different from zero. Second, there is unidirectional causality from
  to
to  if the coefficients on the lagged
  in equation 5 are not statistically different from zero and the estimated coefficients on the lagged
  in equation 6 are statistically different from zero. Third, there is bi-directional causality when the estimated coefficients on lagged
  in equation 5 and the estimated coefficients on lagged
  in equation 6 are both statistically different from zero. Last, there could be no causality between
  and
and  . (Enders: 2004)
5. Data and Estimation Results
5.1. The Data
The paper uses quarterly data for the period 1991:2 to 2009:4. The data was sourced from various Central Bank of Lesotho Annual Reports and Quarterly Reviews. All variables are in constant 2000 prices and expressed in logarithmic form.
5.2. Test Results for Unit Roots
Table 3 below presents the Augmented Dickey Fuller (ADF) tests for LREV LEXPEND, LRC and LCE. The results indicate that the variables are integrated of order one or I (1).Where: LREV denotes the log of revenue; LEXPEND denotes the log of expenditure; LRC denotes the log of recurrent expenditure; LCE denotes the log of capital expenditure.| Table 3. ADF tests for unit roots |
| | | t-statistic | 95% critical value | | | Levels | 1st differences | Levels | 1st differences | | LREV | -3.1127 | -9.6851 | -3.473 | -3.473 | | LEXPEND | -2.3120 | -11.2977 | -3.473 | -3.473 | | LRC | -2.0613 | -10.1989 | -3.473 | -3.473 | | LCE | -1.8205 | -9.6043 | -3.473 | -3.473 |
|
|
5.3. Pair wise Granger Causality
Table 4 presents the pairwise granger causality. This provides us with the preliminary results before we undertake the vector analysis. The null hypothesis that revenue does not granger cause expenditure is not rejected while the null hypothesis that expenditure does not granger cause revenue is rejected at 10 per cent level.Using the disaggregated expenditure, the null hypothesis that revenue does not granger cause recurrent expenditure is accepted and the null hypothesis that recurrent expenditure does not granger cause revenue is rejected at 10 per cent level. The null hypothesis that revenue does not granger cause capital expenditure is accepted so is the null hypothesis that capital expenditure does not granger cause revenue. | Table 4. Pairwise Granger Causality Results |
| | Null Hypothesis | Lags | F-statistics | Probability | | DLREV does not granger cause DLEXPEND | 3 | 1.10551 | 0.35347 | | DLEXPEND does not granger cause DLREV | 3 | 2.24093 | 0.09198 | | DLREV does not granger cause DLRC | 3 | 1.84224 | 0.1484 | | DLRC does not granger cause DLREV | 3 | 2.46217 | 0.0705 | | DLREV does not granger cause DLCE | 3 | 1.26423 | 0.2942 | | DLCE does not granger cause DLREV | 3 | 1.31063 | 0.2787 |
|
|
5.4. Test Results for Cointegration
Tables 5 below reports the results from the Johansen procedure. The table shows the null hypothesis, alternative hypothesis, critical values at 95 per cent significance level and probabilities for both maximum eigen value and trace statistic.The resulting long-run equations are also presented below. Both maximum eigen value and the trace test confirm that the existence of one cointegrating vector between government revenue and spending, and government revenue and recurrent expenditure hence there is a stable relationship. However, both tests fail to identify a cointegrating vector between revenue and capital expenditure. Thus there is no long-run relationship between revenue and capital expenditure.In the long-run, there is a positive relationship between government expenditure and revenue. The government expenditure model indicates that a one per cent increase in revenue leads to 0.775 per cent change in government expenditure. The government revenue model shows that a one per cent increase in expenditure leads to 1.289 per cent change in revenue.
5.5. Error-Correction Models
Following the identification of one cointegrating relation, then the variables in the models are potentially endogenous. The VECM is constructed for the three models with the lag length set at 3. The error-correction term derived from the cointegrating relations is included lagged once. Table 6 presents the error correction model results.The error correction terms bear the negative sign and are significant except for the capital expenditure which is not significant. The adjustment is 43 per cent and 24 per cent for expenditure and revenue models, respectively.| Table 5. Cointegration test results |
| | Null Hypothesis | Alternative hypothesis | Test statistic | 5% critical value | p-value | | Government revenue and expenditureTrace Statistics | | r = 0 | r = 1 | 20.2815 | 15.4947 | 0.0088 | | r = 0 | r = 1 | 3.5233 | 3.8415 | 0.0605 | | Maximum Eigen value statistic | | r = 0 | r>1 | 16.7582 | 14.2646 | 0.0198 | | r = 0 | r>1 | 3.5233 | 3.8415 | 0.0605 | | Government revenue and recurrent expenditureTrace statistic | | r = 0 | r = 1 | 17.0514 | 15.4947 | 0.0289 | | r = 0 | r = 1 | 3.8412 | 3.8415 | 0.1144 | | Maximum Eigen value statistic | | r = 0 | r>1 | 14.5588 | 14.2640 | 0.0449 | | r = 0 | r>1 | 3.8412 | 3.8415 | 0.1144 | | Government revenue and capital expenditureTrace statistic | | r = 0 | r = 1 | 11.3136 | 15.4947 | 0.1929 | | r = 0 | r = 1 | 3.0181 | 3.8415 | 0.0823 | | Maximum Eigen value statistic | | r = 0 | r>1 | 8.2955 | 14.2646 | 0.3494 | | r = 0 | r>1 | 3.0181 | 3.8415 | 0.0823 |
|
|
5.6. Granger Causality Tests
Table 7 below shows the granger causality results from the multivariate analysis. The null hypothesis that revenue does not granger cause expenditure is not rejected. While the null hypothesis that expenditure does not granger cause revenue is rejected at 5 per cent level. The null hypothesis that revenue does not granger cause recurrent expenditure is not rejected at 5 per cent while the null hypothesis that recurrent expenditure does not granger cause revenue is rejected. The null hypothesis that revenue does not granger cause capital expenditure is accepted so is the null hypothesis that capital expenditure does not granger cause revenue. This indicates that in Lesotho fiscal policy follows tax-spend hypothesis. Thus an increase in revenue leads to more spending. The results indicate that the country has to implement structural adjustment reforms to ensure fiscal sustainability in the face of declining SACU revenue. In addition, revenue seems to be driving recurrent expenditure while capital tends to be unresponsive. | Table 6. Error Correction Models |
| | D(LEXPEND) | D(LRC) | D(LCE) | D(LREV) | D(LREV) | D(LREV) | | ECM(-1) | -0.437(-4.00) | -0.210(-3.366) | -0.036(-0.545) | -0.249(-2.17) | -0.073(-2.79) | -0.136(-2.28) | | D(LREV(-1)) | -0.1819(-1.19) | 0.048( 0.341) | -0.151( -0.489) | -1.147(-7.14) | -0.845(-6.93) | -1.00(-7.49) | | D(LREV(-2)) | -0.1268(-0.69) | 0.014( 0.079) | 0.021(0.056) | -0.605(-3.16) | -0.41(-2.72) | -0.503(-2.93) | | D(LREV(-3)) | -0.1751(-1.36) | -0.150(-1.147) | 0.424(1.37) | -0.287(-2.11) | -0.13(-1.069) | -0.217(-1.74) | | D(LEXP(-1)) | -0.6076(-4.45) | | | 0.404(2.81) | | | D(LEXP(-2)) | -0.5468(-3.61) | | | 0.255(1.59) | | | | D(LEXP(-3)) | -0.1644(-1.25) | | | 0.306(2.22) | | | | D(LRC(-1)) | | -0.656(-5.42) | | | | 0.249 ( 2.16) | | D(LRC(-2)) | | -0.486( -0.34) | | | | 0.079 ( 0.574) | | D(LRC(-3)) | | -0.165( -.358) | | | | 0.185 ( 1.59) | | D(LCE(-1)) | | | -0.780( -5.82) | | -0.030 (-0.58) | | | D(LCE(-2)) | | | -0.513( -3.81) | | 0.066( 1.258) | | | D(LCE(-3)) | | | -0.556(-4.00) | | -0.001(-0.001) | | | C | 0.08364.45 | 0.077( 3.68) | 0.056( 1.185) | 0.062(3.15) | 0.072(3.824) | 0.066(3.328) | | R2 | 0.5692 | 0.4741 | 0.4483 | 0.5881 | 0.5899 | 0.5950 | | Adj R2 | 0.5214 | 0.4157 | 0.3870 | 0.5424 | 0.5444 | 0.5501 | | S.E Equation | 0.1262 | 0.1387 | 0.3369 | 0.1332 | 0.1329 | 0.1320 |
|
|
| Table 7. Granger Causality Tests |
| | Null Hypothesis | Lags | Wald | Probability | | DLREV does not granger cause DLEXPEND | 3 | 4.6084 | 0.2028 | | DLEXPEND does not granger cause DLREV | 3 | 10.461 | 0.0150 | | DLREV does not granger cause DLRC | 3 | 3.0676 | 0.3873 | | DLRC does not granger cause DLREV | 3 | 9.0497 | 0.0286 | | DLREV does not granger cause DLCE | 3 | 2.8876 | 0.4093 | | DLCE does not granger cause DLREV | 3 | 3.2072 | 0.3608 |
|
|
6. Conclusions
This paper has provided empirical evidence on the relationship between government revenue and expenditure in Lesotho during the period 1991 to 2009.The results based on error-correction model indicate that revenue-expenditure hypothesis holds for Lesotho. Thus causality runs from revenue to spending. This is similar to the results by Moalusi (2004) and Eita and Mbazima (2008) for and respectively. Fiscal policy in these countries depends on funds from the SACU pool. The paper recommends that Lesotho should implement a number of recurrent expenditure adjustment reforms in the light of the declining SACU revenue. This will ensure fiscal sustainability in the medium term. Moreover, it is critical that an increase in revenue should be accompanied by raising capital expenditure to provide the necessary infrastructure in the country.
Notes
1. SACU members are South Africa, Lesotho, Botswana, Namibia and Swaziland 2. Buchan and Wagner (1978) concur with this hypothesis and highlight a different channel through which taxes affect spending.
References
| [1] | Baghestani, H and McNown, R. (1994). Do revenues or expenditures respond to budgetary disequllibria?’ Southern Economic Journal, October: 311-322 |
| [2] | Blackley, P.R. (1986). Causality between revenues and expenditures and the size of the Federal Budget, Public Finance Quarterly, 14(2): 139-156 |
| [3] | Buchanan, J and Wagner, R. (1977). Democracy in deficit, New York: Academic Press |
| [4] | Charemza W,W, Deadman D, F. (1997). New directions in economic practice. General to specific modelling, cointegration and vector autoregression. 2nd edition. Edward Edgar. UK. |
| [5] | Eita J, Mbazima D. (2008). The causal relationship between Government revenue and expenditure in Namibia. MPRAPaper |
| [6] | Enders W (2004) Applied Econometric Time Series. 2nd Edition. John Wiley and Sons |
| [7] | Fasano U, Wang Q (2002). Testing the relationship between government spending and revenue: Evidence from GCC countries. IMF working paper 02/201 |
| [8] | Friedman, M. (1978). The limitations of tax limitation, Policy Review, Summer: 7-14 |
| [9] | Geweke J. (1984) Inference and causality in economic time series models. In Handbook of econometrics Vol.2. Edited by ZviGriliches and Michael Intriligator. Elsevier Science Publishers. New York |
| [10] | Granger C. W. J. (1969). Investigating causal relations by econometric models and cross-spectral methods. Econometrica. Vol.37. No.3. pp 424-438 |
| [11] | Hall, S.G. (1989). Maximum Likelihood Estimation of cointegration vectors: An example of the Johansen Procedure. Oxford Bulletin of Economics and Statistics, 51, 2 |
| [12] | Hondroyiannis, G and Papapetrou, E (1996). An examination of the causal relationshipbetweengovernmentspending and revenue: A CointegrationAnalysis, Public Choice, 89 : 363-374 |
| [13] | Hoover, K.D and Sheffrin, M (1992). Causation, spending and taxes : Sand in the sandboxor the taxcollector for the welfare state ?’ American EconomicReveiw, 82(1): 225-248 |
| [14] | Lusinyan L, Thornton J (2007). The revenue-expenditure nexus: Historical evidence for South Africa. South African Journal of EconomicsVol 75 (3) |
| [15] | Meltzer, A. and Richard, S (1981). A rational theory of the size of government, Journal of Political Economy, 89: 914-927 |
| [16] | Moalusi D (2004). Causal link between Government spending and revenue: A case study of Botswana. Fordharm University Department of Economics. |
| [17] | Narayan, P.K and Narayan, S. (2006). Governemtn revenue and geovenrment expenditure nexus: Evidence from developing countries, Applied Economic Letters, 38: 285-291 |
| [18] | Ndahiriwe K (2007) Temporal causality between taxes and public expenditures: The case of South Africa. University of Pretoria Department of Economic Working Paper Series 2007-09. |
| [19] | Nyamongo M, Sichei M, Schoeman N (2007). Government revenue and expenditure nexus in South Africa. SAJEMS (10) 2 |
| [20] | Owole O (1995). The causal relationship between taxes and expenditures in the G7 countries: cointegration and error correction models. Applied Economics Letters, 1995. (2) pp 19-22 |
| [21] | Peacock, A and Wiseman, J. (1979). Approaches to the analysis of government expenditures growth. Public Finance Quarterly, January: 3-23 |
| [22] | Payne, J. E (1997). The tax-spend debate: the case of Canada. Applied Economic Letters, 4(6) June: 381-386 |
| [23] | Wahid, M. N (2008). An empirical investigation on the nexus between tax revenue and government spending: The case of Turkey, International Research Journal of finance and Economics, 16(2008): 46-51 |
 Abstract
 Reference
 Full-Text PDF
 Full-text HTML