-
Paper Information
- Next Paper
- Previous Paper
- Paper Submission
-
Journal Information
- About This Journal
- Editorial Board
- Current Issue
- Archive
- Author Guidelines
- Contact Us
American Journal of Economics
p-ISSN: 2166-4951 e-ISSN: 2166-496X
July, 2012;
doi: 10.5923/j.economics.20120001.29
Framework for Coordination of Monetary and Financial Policy in the EU and Conditions in the ASEAN+3 Thereto
 Abstract
 Reference
 Full-Text PDF
 Full-Text HTML
Anna Kiseleva
The centre for Problems of Globalization of Russian Economy, Institute of Economics of the RAS, Moscow, 117218, Russia
Correspondence to: Anna Kiseleva , The centre for Problems of Globalization of Russian Economy, Institute of Economics of the RAS, Moscow, 117218, Russia.
| Email: |  |
Copyright © 2012 Scientific & Academic Publishing. All Rights Reserved.
The legal implementation of cooperation and integration processes in the EU and the ACEAN+3 primarily had some fundamental differences. Consequently, integration processes in the two regions had been different ab initio. Foreign trade preconditions for monetary and financial cooperation between countries are considered in this paper. The ASEAN+3 countries left behind the EU under the bilateral trade intensity ratio. The low CITR can be consider as an alarm for the enlargement of the eurozone, as the important prerequisites for the OCA look questionable. The main factors which affect increment of considered export variables for the ASEAN+3 are merchandise exports and food industry of new core countries.
Keywords: ASEAN+3, EU, Monetary And Financial Policy, Cooperation, Bilateral Trade Intensity, Export Structure, Optimum Currency Area (OCA)
Article Outline
1. Introduction
- The European Economic Community was established under the predominance of the fixed exchange rate system and relatively low cross-border capital movement. However it is impossible to support free capital movement, the autonomy of monetary policy simultaneously with fixed exchange rates, bearing in mind the growing openness of the world economy and huge amount of hot money crossing the boundaries. The cost of errors for countries to be integrated is too high as the EU rescue programmes are demonstrating now. So it’s crucially important to scrutinize the prerequisites for mutually coordinated monetary and financial policy.
2. Theoretical Framework
- The pioneer research in the field of the relationship between the openness of countries’ economy and their perspective as the optimum currency area was provided by R. McKinnon in 1963. The degree of the openness according to R. McKinnon can be measured as “the ratio of tradable to non-tradable goods”[1, p. 717]. There have been taken a lot of disputes concerning the cost-benefit analysis of monetary and financial integration for particular countries.To elucidate the applicability of the OCA theories to ASEAN-5 (Malaysia, Indonesia, Singapore, the Philippines and Thailand) T. Falianty produced a solid research covering period from 1971 to 2003[2]. The OCA index was calculated in that paper from 1983 up to 1992. T. Falianty used the pairwise method, cluster analysis and dynamic analysis (Structural Vector Auto Regression (SVAR), Nodrick-Prescott Filter). SVAR is a good tool to avoid endogenity problem which appeared in J. Frankel and A. Rose’s paper in 1998. These researchers stressed that international intensity of the country’s relations is affected by national business cycles[3, p. 1010]. Coordinated monetary policy between members of the currency union results in tighter liaisons in international trade. Inversely the wider the mutual trade, the closer coordinated their business cycles will be (multicollinearity problem). SVAR analysis avoids endogenity problem with variables. Openness of the economy is defined according to T. Falianty as the average ratio of sum of mutual export flows between both countries (in current prices), to GDP measured in current prices[2, p.7]. Furthermore this researcher offered to evaluate the “absolute differences per share from agricultural sector, mineral sector and manufacturing sector”[2, p. 9] as a measure of the disparateness in the export structure. The variable reflects the difference in export structure between each pair of countries[3, p. 9]. What emerges from T. Falianty’s paper is that Singapore, Malaysia and Thailand could be treated as OCA. Indonesia and the Philippines would be outside this union.Costs and benefits from integration related to openness of the economy were previously discussed in the papers of the following authors: D. Rodric[4], T. Iverson and T. Cusack[5]. As well as the latter two researchers, So Young Kim postulates[6, p.210, 199] that economic openness in any country results in lowing volatility in its economy (trade volatility, foreign exchange rate volatility etc.) only if the international market integration diversifies the economic risks. Otherwise if concentration of risks takes place (after unifying national economies) then volatility of the economy increases.So Young Kim[6] has analysed 175 countries from 1950 up to 2002 using the ordinary least squares regression (OLS), and the robustness checking was held. So Young Kim has developed and verified assumptions about the influence of economic openness on benefits from monetary cooperation and integration process bearing in mind external risks. The degree of openness is measured by So Young Kim as the normalized trade and gross private capital flows (i.e. compared to GDP). Additional variables concerning openness are net trade balance and export/ import as percentage of GDP. So Young Kim’s conclusion[6, p.199] is about the insignificance of openness variables and the importance of the external risk variables. There is an inverse relationship between the aggregate investments volatility and trade openness variable (for more open countries the volatility of the investment is less).The main conclusion obtained by So Young Kim[6, p. 210] is that more open economy may not be more volatile one (externally or/ internally). The domestic volatility is defined by the amount of external risks.So Young Kim supposes that there is a transition mechanism, which connects the openness of the economy and volatility of spending; or there is spurious correlation between them due to the existence of the third variable influencing both the openness and spending volatility[6, pp. 211-212].U.Volz in his book regressed the bilateral trade intensity ratio against the bilateral FDI intensity ratio, similarity of currency regimes and the vector with the gravity model’s variables[7, p. 110-113]. He concluded that similar currency regimes in the countries have significant trade-creating effect. M. Hinojales and Cyn-Young Park proved their supposition about the strong positive relationship between increase in bilateral trade and expansion and increase in equity portfolio investments[8, p.102-105]. Debtor countries often promote regulation that is based on the idea that permanent trade surplus “is unfair and the result of having an undervalued currency”[11, p.174]. I am prone to support R. McKinnon‘s assertion[12, p.37-40] about negative consequences for investments and net export in the case of sufficient currency appreciation for the saving-surplus countries (e.g. the USA insist on appreciation of renminbi). So all my calculations were made under stable exchange rate preconditions for regional currencies.
3. Initial Framework for Mutually Coordinated Policy
- The legal implementation of cooperation and integration processes in the EU and the ACEAN+3 primarily had the following fundamental difference. Starting with the European Payments Union (1950) and European Coal and Steel Community (1951), practically all steps of the member countries were directed to the economic integration bearing in mind precise aims and tasks. Contrary to the EU, fundamental aims in the ASEAN were put forward when the regional block was established. The aims were set forth in the ASEAN Declaration (Bangkok Declaration, August 8, 1967). Among these aims there were: preserving peace, stability and speeding up economic development. The common goals with the watered down criterion orientation were put forward and quite a different situation was emerging in the ASEAN. The base for pooling of interests and further integration was the foreign trade cooperation which started from establishment of free trade areas (FTAs). Asia-Pacific Trade Agreement (1976) became the first treaty between the Republic of Korea, China, Lao People's Democratic Republic, Bangladesh, India and Sri Lanka. During the following twenty years the progress in negotiations concerning FTAs was modest. Two new agreements were signed during those years: one bilateral agreement (between Lao PDR and Thailand) in 1991 and one multilateral agreement in 1993[13]. But only after Asian crises in 1997-1998 a sharp increase of signed agreements took place, essentially bilateral ones. Now it’s possible to fixate that for all the countries (except Singapore) intra-regional trade agreements prevail over the external ones[14, p. 61]. Consequently, integration processes in the two regions were different[15]. Since 1950s persistent actions were taken for removing frictional barriers which impeded free flows of raw material, goods and investments. But the ASEAN countries have not reached the common market stage yet as trading barriers in the ASEAN have not been abolished in full.
4. Research Methods
- J. Frankel, A. Rose[3, p.1016] suggested to measure bilateral trade intensity between two countries (1)
 | (1) |
 is the total exports value is from country i to country j during the t;
  – total import to country I from country j;
  – total export and
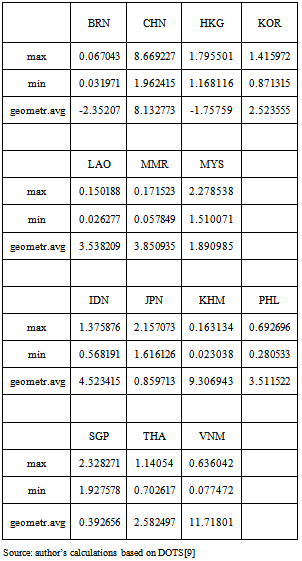
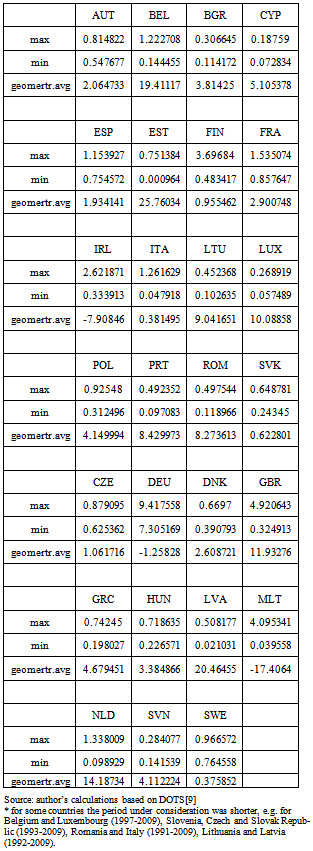
  ─ import to countries i and j respectively. All data are measured in nominal value. Bilateral trade intensity ratios (CITR) for the ASEAN+3 countries were calculated in my research between 1990 and 2009. These ratios were averaged for each country and each year (2)
 | (2) |
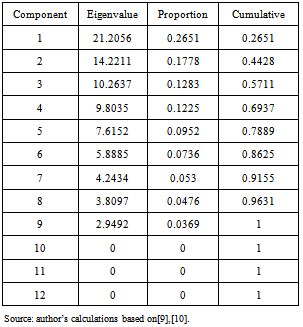
 (CITR) is a bilateral trade intensity ratio between country i and country j in a year t. The purpose is to bring to light how the main factors affected the changes in relative export structure of different sectors for the ASEAN+3 countries. I applied Principal components analysis in GRETL to the logarithms of the first differences of the ASEAN+3 export shares for particular sectors and to the logarithms of the first differences of CITR in order to determine the key factors influencing the dynamics of trade relationships among these countries. Then under the Kaiser criterion I grouped factors which eigenvalues were more than one.
5. Data Presentation and Analysis
- I’ve calculated the bilateral trade intensity ratios for every country (Hong Kong and China Mainland were treated separately) both in the ASEAN+3 and the EU since 1990 up to 2009 (with some exclusions due to the available data) and then averaged the ratio for both groups (the EU and the ASEAN+3) for each year. The general upward trend in arithmetic average CITR for the ASEAN+3 countries (see Figure 1) proves the growing intensity of the trade relationships between the Asian countries. Contrary to them, in the EU in early 1990s the intra-regional trade concentration plunged significantly. Since 1993 up to 2009 the CITR ratio of ASEAN+3 left behind the CITR for the EU, which swang in the band between 0.9% and 1.1%.
 | Figure 1. Bilateral Trade Intensity Ratio (comparison between the EU and the ASEAN+3), 1990-2009 |
|
|
6. Discussions and Results
- The further investigation of the intra-regional foreign trade relations in the ASEAN+3 was to extract significant indicators to mark variations in relative data in the ASEAN+3 foreign trade. I have put together the CITR variable with the other ones from Table 3. As I have mentioned above I used first logged differences for all data (CITR data were calculated by me; other variables were listed in Table 3) from 1990 up to 2009.
|

|
7. Conclusions
- I consider the bilateral trade intensity ratio as one of the ratios indicating the openness of an economy. Arithmetic average CITR for the ASEAN+3 has experienced steady growth since 1990. Contrary to it, the same ratio for the EU after a significant meltdown in early 1990s, waved to and fro around 1%. It can be considered as high degree of readiness on such criterion for ASEAN+3 to make steps towards monetary and financial integration in the region. The results obtained in this paper confirm that the EU countries following their choice of open regionalism expand their trade relationships, particularly by increase in trade turnover with countries outside the EU. Such expansion results in plummet of maximum bilateral trade turnover ratio. At the same time the ASEAN+3 countries move in the opposite direction, towards the greater concentration of foreign trade inside the East and South-East Asia and strengthening the regional cooperation. However the low CITR can be considered as an alarm signal for the enlargement of the eurozone, as the important prerequisites for the optimal currency area looks questionable. For further intra-regional trade promoting measures it is worth underlying that the authorities are to stimulate manufactures export from Korea, Indonesia, Thailand; high-technology exports from Japan, Hong Kong and food exports from China and Japan. These measures will strengthen the foreign trade preconditions for closer monetary and financial cooperation in the ASEAN+3.