-
Paper Information
- Next Paper
- Previous Paper
- Paper Submission
-
Journal Information
- About This Journal
- Editorial Board
- Current Issue
- Archive
- Author Guidelines
- Contact Us
American Journal of Economics
p-ISSN: 2166-4951 e-ISSN: 2166-496X
July, 2012;
doi: 10.5923/j.economics.20120001.25
The Effects of Waiting Time, Passive and Active Impatience on Anger and Waiting Acceptability
 Abstract
 Reference
 Full-Text PDF
 Full-Text HTML
Syahrial Yuzan , Nik Kamariah Nik Mat , Sri Mulyani , Sambas Ade Kesuma, Risanty, Fadl
Othman Yeop Abdullah Graduate School of Business, Universiti Utara Malaysia, Sintok, 06010, Malaysia
Correspondence to: Nik Kamariah Nik Mat , Othman Yeop Abdullah Graduate School of Business, Universiti Utara Malaysia, Sintok, 06010, Malaysia.
| Email: |  |
Copyright © 2012 Scientific & Academic Publishing. All Rights Reserved.
The purpose of this study is to relate the students’ perceived waiting time to the way their experience of waiting for buses, particularly in terms of passive and active impatience. These three variables are observed in relation to waiting acceptability and anger experienced by the students. All variables were measured using 5 point Likert scale, Perceived waiting time (3 items), Passive impatience (3 items), Active impatience (3 items), Waiting acceptability (2 items), and Anger (4 items). The objects of this study are UUM Sintok students and the samples of this study are 250 students. Questionnaires were distributed based on convenience sampling method from various age, gender, nationality, Hostel route, Faculty, Seniority and Time of survey. The data was compiled into SPSS 19 and the data was analyzed using Structural Equation Model (SEM) through AMOS 18. The result shows that The Goodness of Fit indices of structural equation model are saturated at GFI = 0.926, P-Value = 0.000, RMSEA = 0.103 and Ratio (cmin/df) = 3.665. There is a significant and positive influence of active impatient toward anger (B = 0.342, CR = 2,567, p<0.010), and vice versa a significant and negative influence of active impatience on waiting acceptability (B = -0.417, CR = -2.183, p<0.005).
Keywords: Waiting Time, Passive Impatience and Active Impatience, Anger, and Waiting Acceptability
Article Outline
1. Introduction
- Most firms and organization must be able to design strategy to accommodate customer expectation in order to gain competitive advantage. One of the key competitive is the ability to deliver product or service faster than competitors. Consequently, time is one of the most important factors that should be managed by the company, especially service providers. From the point of service users, time is also one of the most valuable aspects. A consumer will be very easy to shift to another when he dissatisfied on the service delivered by specific service provider in the intense competitive. Therefore, time is considered as having a negative impact on consumer service perception. Smith Amy and Bolton Ruth[1] explored the effects of emotions on consumer evaluations of service recovery. The author state that stronger and more negative emotions may arise as respond of more dissatisfied consumers. One of negative emotion that may occur is anger. Nguyent, and Doan[2] stated that when service failure occurs, the customers often experience negative emotion such as anger, outrage, or sadness. Understanding consumers’ negative emotions facilitates service providers not only to enhance service quality especially in waiting time, but also to anticipate difficult situation when the problems take place. Several empirical studies devoted to the waiting time with an experimental setting, either natural or laboratory[3],[4],[5],[6]. This study deals with customers waiting in real life conditions to determine the relationship between personality traits related to time (the time style,[7]) and the way customers experience wait time. Some studies focus on the relationship between waiting time and satisfaction[5],[8]. Many other studies emphasize the relationship between satisfaction and loyalty of their customers[9],[10],[11],[12],[13]. The purpose of the study is to relate the student’s perceived waiting time as well as passive and active impatience with the anger and waiting acceptability. The population in this study is UUM students who use the bus transportation through five hostel route (route A, B, C, Bukit Kachi, and Maybank College). The structure of this paper include, first, the literature review related to anger and waiting acceptability (DV) and waiting time, passive and active impatience (IV), next we present the research framework, methods, measures and findings. Finally, the last section were discussed the managerial implications to enhance service quality of bus transportation, and limitation of this study while recommendations or future research.
2. Literature Review
- As outlined earlier, the negative emotion (anger in this study) have a negative impact on customer satisfaction. Today, customer satisfaction has always been a major focus in both profit and not-profit organization. Prolong of waiting time is one of the failures in the transportation services in managing transportation service. This matter may cause prevent customers from achieving their goals such as to be late enter the class, appointment with the supervisors or Professor, etc. Nguyent, and Doan[2] state that depending on the severeness of the service failure, and the resulting difficulty, customers will experience different levels of anger towards the service organization.Actually, time is very valuable both from the perspective of service users and service providers. On the one hand, service firms may lose the deal if it waits too long, and on the other hand, consumers consider the waiting time is sacrifice in using such services. This is one reason that more and more service provider puts the customer in a position that provides benefits to the customer. Lovelock & Gummesson[14] emphasized the central role should be addressed to the time service and recommends to pay more attention in improving the understanding of how customers view, budgets, consumption and value of time.
2.1. Waiting Acceptability
- As concerns the study of waiting times, a simple and operational definition is based on two aspects:1) The purpose of time (based on fact), as measured by clocks, watches, and chronometers-namely, the mathematics, the time can be calculated, compared, added, and multiplied. Specialists from queuing theory has made a decisive contribution in this area, not only on optimal waiting times for customers but also on the road waiting lines, waiting for the rules, and terms of service should be set to make the wait more acceptable[15] and reduce the psychological cost of waiting time objective[16].2) The subjective (perceived) that individuals who experience time with more or less intensity, as resources or constraints, individually or collectively, which is synchronized with the others to varying extents. Subjective time perception often described as a flexible, changing, and elastic, prone to extended or shortened according to the type of activities undertaken. The author in this field consider the subjective experience-that is, how people tend to exaggerate or less waiting time and waiting for information on how to influence their evaluation of waiting and their overall satisfaction with services[17],[5],[18],[19],[6],[20].
2.2. Anger
- Smith Amy and Bolton Ruth[1], explored the effects of emotions on consumer evaluation of service recovery. Using a scenario-based approach the authors determined that more and more consumers who are dissatisfied tend to respond with strong emotions and more negative. These emotions can have a significant impact on consumer evaluations[21],[22],[23]. Roger et.al[24] explored the role of anger in influencing the behavior of consumer dissatisfaction response. The authors examined the direct effect of service encounter dissatisfaction (valence) and anger (emotion-specific) on consumer behavioral responses to service failures in a field setting. Results Roger et.al[24] first study supported the notion that the experience of dissatisfaction is not enough to motivate consumers to engage in conduct complaints, switching, or third-party complaint. However, these findings suggest anger is a powerful predictor of consumer behavioral responses to failed service encounters over and above the effect of dissatisfaction. In addition, the authors found the inclusion of anger in the model provide increased explanatory power beyond the model of discontent.
2.3. Perceived Waiting Time
- The destruction caused many problems for service providers and the service is intensifying as demand fluctuates. To solve the main problem, the company adopted a strategy to suit the capacity and demand[25],[26],[27]. One strategy was first adopted was to flex capacity to meet demand. During periods of peak demand, the organization expanded its capacity by adding new resources such as people, facilities and equipment. Second, companies can try to smooth demand. Companies can motivate consumers to make their offer more attractive during periods of low demand. Companies can also choose to use the reservation request to spread evenly. However, even with reservations, service providers have difficulty in minimizing delays in the provision of services. When demand and capacity cannot be equated, waiting line strategies can still be found. Among the waiting line strategy, we find to make waiting more pleasant or tolerable, waiting for customers to distinguish and choose an appropriate configuration waiting line[27]. Although the implementation of all these strategies, when the time customers wait too long, the company was able to make the consumer is not satisfied. Service providers may even lose one or more sales opportunities, and even worse to lose a loyal customer, even though an effective service recovery strategy. But what characterizes a long waiting time? The waiting time has four aspects: objective, subjective, cognitive and affective:1) The purpose of the waiting time is time measured with a stopwatch before serving customers[27],[29],[6].2) The waiting time is a subjective estimate of the time customers wait. In previous studies, the subjective aspect is measured by the perceived waiting time[5],[8]. Not surprisingly, the estimated time depends on the elapsed time measured objectively[17],[8],[30].3) The cognitive aspect of consumer evaluation of the wait is waiting for (or not) are acceptable, reasonable, moderate[31] and are considered short-versus long[8].4) Wait affective aspect of emotional responses such as irritation to wait,, boredom frustration, stress, pleasure, happiness,[6],[5],[8]. According to Pruyn, Ad and Ale Smidts[8], affective and cognitive aspects of the assessment form to wait.
2.4. Passive Impatience
- While waiting, people tend to have a sense of empty time and stretch-out. Fraisse, Paul[32] explains that our consciousness is accompanied by a sense of resistance duration of time. It manifests itself in the affective state of the German language "used to express a sense of the word Langweile boredom resulting from a situation from which one cannot escape" (p. 215), "the feeling that time is long and stretches out" (p. 217 ). State of mind, that we call passive and impatience, also described James and William[33] as a state of mind where people have nothing, lost all their attention to the passage of time. Close your eyes for a minute and doing nothing may appear as an endless, because one is locked in a dull experience when empty, there fore, waiting for cause discomfort and even pain. Goldberg and Arnold[34] described the pain as unbearable to wait for some people: "they climb The Wall ... they crawl out of their skin ... to explode" (p. 417). Feeling helpless is all the more important when people feel under pressure of time: They have to wait and idle while they think about all they have to do.
2.5. Active Impatience
- Wessman[35], commenting on the subjective experience of time, proposed a construct called the immediate time pressure, which consists in "a rush of feeling sad, being overwhelmed, scattered, running out of time ... time of distress" (p. 105) . Construct has two opposing positions, in which people feel harassed and out of control, and the other in which the adaptive flexibility and relaxed mastery experience. This building, which we call then felt the pressure of time, have an influence on the nature of the patient. This tends to alter the uncomfortable feeling the emptiness of time, ie, passive impetuosity, to within one of wasting feelings, which leads people to try and control the situation can not wait for a while (so-called impatience later on). There are two problems in the process of active impatience: The first is the need to control the situation which resulted in people who are actively trying to check if the bus is coming or not, the second is the locus of causality and attribution of responsibility to wait when it is considered too long. Our assumption is that people actively impatient waiting will not find less acceptable than others will. The reason for this assumption is that people can judge that they are active impatience because of the style of their own time, namely, their own personalities, they show some awareness of their own attitudes and active impatience does not connect to the service providers.
3. Methodology
- This study investigates the antecedents of waiting acceptability. The research framework shows that passive impatience, active impatience, and anger directly predict waiting acceptability while passive impatience and active imp atience are the direct antecedents of anger. Perceived waiting time predicts active impatience. Perceived waiting time also becomes the antecedent of anger through passive and active impatience behavior.The hypothesized model is the manifestation of the research framework with additional error terms for each latent variables. The exogenous variable of perceived waiting time consists of two interpreting (observed) variables. Other exogenous variables, passive impatience and active impatience, contain two observed variables respectively. For structural the purpose of structural equation modeling, the error of each item is drawn as unobserved variables in r ounded circles and labeled exx. The endogenous variables of anger and waiting acceptability consist of two manifesting variables respectively. The error terms for these variables are also labeled with exx as shown in the diagram.
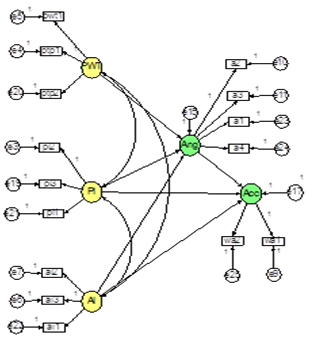 | Figure 1. Hypothesized Model |
3.1. Sampling and Instrument
- A total number of 280 university students who patronizing various various ages, nationalities, years of study, faculties, survey time, and hostel route routes were asked to complete a questionnaire that contained measures of the relevant constructs. The questionnaires were distributed to the respondents when they waiting for a bus using convenience sampling method. A response rate of about 89% was collected back which is equal to 250 responses. The measurement over variables utilize the available developed instruments as the following: perceived waiting time was adopted from[31]. There are also six demographic questions included in the instrument which use ordinal and nominal scale such as gender, age, nationality, faculty, years of study, and hostel route.
3.2. Data Screening and Analysis
- The 250 dataset were coded and saved into SPSS version 19 and analyzed using AMOS version 18. During the process of data screening for outliers, none data was deleted which leaves all dataset can be proceed to the analysis stage. We also conducted univariate normality computations using z-scores of skewness statistics and standard error of skewness as well as kurtosis statistics. Z-score of skewness of more than 2 needs to be transformed since it is considered as non-normal dataset[36]. The transformed variables were then used in subsequent CFA and structural equation modeling saved into SPSS version 19 and analyzed using AMOS version 18.
4. Results
4.1. Demographic Profile of the Respondents
- The respondents’ ages ranged from eightteen to twenty-six years old divided into three groups of ages. There are more female (58%) than male respondents (42%). The respondents are mostly Malaysian-nationality students (81.6%) compared to non-Malaysian students (18.4%). Their seniority varies from 1st year (35.2%), 2nd year (32.8%), 3th year (22.8%) and 4th year (9.2%). About 35.6% of the respondents take the hostel route of Bukit Kachi and 32.0% take the route of Maybank Hostel while others take Route A, B or C.
4.2. Descriptive Analysis of Variables
- The research framework consists of three exogenous and two endogenous variables. Each observed construct shows normality based on the value of z-scores of skewness, which give values: 0.5, -0.34, 0.42, -0.08, -0.48, 0.26, -0.98, 0.04, -1.85, 0.17, and 0.12 for a1, ptp2, pi3, wa1, a3, a2, ai2, ai3, pwt1, ptp1, and pi2 respectively. Thus, all of these observed variables can be proceed to the subsequent analysis. However, spurious items will be self-deleted during confirmatory factor analysis (CFA) process.
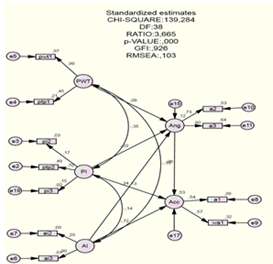 | Figure 2. Revised Model |
4.3. Convergent Validity (Confirmatory Factor Analysis -CFA)
- From the confirmatory factor analysis (CFA) results, we observed that the regression estimates or factor loadings of all manifesting observed variables or items are adequate ranging from 0.538 to 0.986, except for some items which are below 0.5. The factor loadings of latent to observed variable should be above 0.50[36].This indicates that all the constructs conform to the construct convergent validity test. After deletions were made using modification indices suggestions, the remaining numbers of items for each construct are as follows: perceived waiting time (2 items-no deletion), passive impatience (3 items-no deletion), active impatience (from 3 items to 2 items), anger (4 items to 2), and waiting acceptability (2 items-no deletion).
4.4. Composite Reliability
- The calculations of composite reliability based on the standardized factor loadings obtained from the final revised structural model. The equation for composite reliability is as follows:
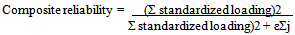 The readings of composite reliability of all exogenous latent constructs are well above 0.60 except for passive impatience and waiting acceptability (below 0.60) – (Nunnally, 1970).
4.5. Discriminant Validity
- To substantiate discriminant validity, average variance extracted (AVE) is compared to correlation squared of the interrelated variables of concerned[11]. The AVE s derived from the calculation of variance extracted using the following equation:
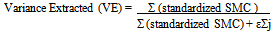 From the variance extracted, AVE is than calculated by averaging the two variances extracted of the variables. For discriminant validity to be upheld, the value of AVE must be more than correlation squared. Hence, AVE > correlation squared, discriminant validity is supported. All constructs used for this study support discriminant validity.
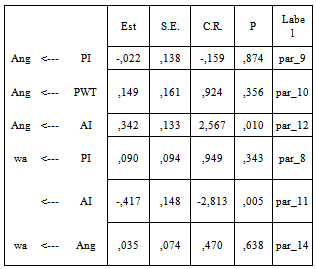
4.6. Nomological Validity
- Nomological validity examines whether the correlations between constructs in the measurement theory makes sense such that correlations must be positive or negative according to theory stipulated[36]. It is observed that all directions of correlations are in the hypothesized direction as stipulated in the hypotheses in accordance to theory. Thus, it can be deducted that nomological validity is substantiated for all measures used in this study.
4.7. Goodness of Fit of Structural Model
- To arrive to the structural model, confirmatory factor analysis (CFA) was conducted on every construct and measurement models. The goodness of fit is the decision to see the model fits into the variance-covariance matrix of the dataset. The CFA, measurement and structural model has a good fit with the data based on assessment criteria such as GFI, CFI, TLI, RMSEA[37]. Although not all assessment criteria of constructs produced a good fit as indicated by the goodness of fit indices such as CMIN/df ratio (<2); p-value (>0.05); Goodness of Fit Index (GFI) of >0.90, and root mean square error of approximation (RMSEA) of values less than 0.08 (<0.08)[36], it is argued that the model has achieved GFI value of > 0.90. The result shows that the goodness of fit of generated or revised model is better compared to the hypothesized model. This is expected as hypothesized model is usually strictly confirmatory[38]. GFI of revised model is 0.926 compared to GFI of hypothesized model of 0.857.
4.8. Hypotheses Results
- Since the results of hypothesized model did not achieve model fit (p<0.000), hence, the explanation of hypotheses result will be based on generated or revised model. The result demonstrates that there is a significant and positive influence of active impatient toward anger (B = 0.342, CR = 2,567, p<0.010), and vice versa a significant and negative influence of active impatience on waiting acceptability (B = -0.417, CR = -2.183, p<0.005).The analysis output indicates the amount of variance explained by the exogenous variables in the revised model. Firstly, perceived waiting time, passive impatience, and active impatience explains only about 12% variance in anger. Secondly, waiting time, passive impatience, active impatience and anger explains 54% variance in waiting acceptability.
4.9. Overall Comparison between Structural Models
- The comparison between hypothesized model and revised model shows that the first (hypothesized model) produces none significant direct impact while the second (revised model) produces two significant direct impact. Even though there are significant direct impacts in hypothesized model, the results could not be generalized due to non-achievement of p-value (p<0.05). Among the two structural models, revised model achieved the higher squared multiple correlation (SMC) or (R2), in which the revised model explains 54% variance in waiting acceptability while the hypothesized model only explains 30% variance in waiting acceptability
5. Discussion
- This study attempts to examine the causal relationships between four antecedents of waiting acceptability in the transportation sector. As expected, the hypothesized model do not achieve model fit (p value=0.000, p <0.001). This implies that hypothesized model could not be generalized to the population. This is expected because the sample was only concentrated in one region only.The revised model accomplished model fit and supports two direct effects. Firstly, active impatience is a significant positive antecedent of anger. This finding is supported previous studies by[31]. The students who are highly committed to active impatience are usually also experiencing high level of anger due to the delay on bus services. Secondly, active impatience is a significant negative antecedent of waiting acceptability. The students who are highly committed to active impatience may value their time higher; and, therefore, they tend to prefer shorter waiting time. This finding is similar to previous studies. It is therefore necessary for the bus provider to consider of shortening waiting time because it will more satisfaction to the users.
6. Suggestion for Future Research
- The findings could not be generalized for the whole of Malaysia because it was only conducted within the campus in Sintok, Malaysia. This model has shown some interesting findings which could be applied for utilization in research on a bigger scale to include the whole of Malaysia and Asian region
7. Conclusions
- This study has produced two direct causal effects regarding the study on the effects of waiting time, passive impatience and active impatience on anger and waiting acceptability among students. Firstly, it shows the positive impact of active impatience towards anger. Secondly, the research has shown that there is an impact of active impatience towards waiting acceptability.