-
Paper Information
- Paper Submission
-
Journal Information
- About This Journal
- Editorial Board
- Current Issue
- Archive
- Author Guidelines
- Contact Us
International Journal of Diabetes Research
p-ISSN: 2163-1638 e-ISSN: 2163-1646
2019; 8(3): 48-59
doi:10.5923/j.diabetes.20190803.02

The Influence of Dietary Patterns on Diabetes among Women in Owerri West Local Government Area of Imo State, Nigeria
 Abstract
 Reference
 Full-Text PDF
 Full-text HTML
Winnie U. Dozie1, Chrysogonus C. Nwaigwe2, Chisomuaga C. Okoro1, Ikechukwu N. S. Dozie1
1Department of Public Health, Federal University of Technology Owerri, Imo State, Nigeria
2Department of Statistics, Federal University of Technology Owerri, Imo State, Nigeria
Correspondence to: Chrysogonus C. Nwaigwe, Department of Statistics, Federal University of Technology Owerri, Imo State, Nigeria.
| Email: |  |
Copyright © 2019 The Author(s). Published by Scientific & Academic Publishing.
This work is licensed under the Creative Commons Attribution International License (CC BY).
http://creativecommons.org/licenses/by/4.0/

Many recent studies have established that dietary pattern of a group of persons can be studied in relation to some chronic diseases. Undoubtedly, many chronic diseases can be traced to the dietary pattern of their victims. The study of dietary pattern in relation to a specific disease emerged recently and has not been fully harnessed especially in Africa where variety of native foods are combined and consumed across cultural and ethnic groups. Research on dietary pattern in relation to a specific disease may be unique according to culture and region. Until recently, no research work on dietary pattern in relation to diabetes was seen to have been carried out in Owerri-West Area of Imo State, Nigeria. The present research is an attempt to initiate a study of dietary pattern in Owerri-West and in particular, examine its influence on diabetes among women. The objective of the present study is to examine the dietary patterns and factors that influence the dietary patterns of women resident in Owerri-West Area of Imo State, Nigeria. A cross-sectional design was employed in the study. The study population consisted of adult females in the communities in Owerri West L.G.A who are within the age range of 18-55 years. A sample size of 382 was taken for the study. A semi structured self-administered questionnaire with diabetic test and anthropometric measurements were used for the study. Descriptive and inferential statistical tools were used to analyse the data obtained. Results obtained show that age, education, occupation, marital status and religion had significant influence on the dietary patterns of the participants and the prevalence of diabetes. The results also show that carbohydrate, protein and lipid rich foods alongside soft drinks and beer were in high consumption among the participants with carbohydrate as the highest.
Keywords: Dietary pattern overweight, Obesity, Diabetes, Women
Cite this paper: Winnie U. Dozie, Chrysogonus C. Nwaigwe, Chisomuaga C. Okoro, Ikechukwu N. S. Dozie, The Influence of Dietary Patterns on Diabetes among Women in Owerri West Local Government Area of Imo State, Nigeria, International Journal of Diabetes Research, Vol. 8 No. 3, 2019, pp. 48-59. doi: 10.5923/j.diabetes.20190803.02.
Article Outline
1. Introduction
- It has been observed that the emergence of dietary patterns is the result of an alternative method for the study of the relationship between diet and chronic diseases. Originally, nutritional epidemiology studies were focused on some diseases and their relation to specific nutrients or foods (Hu, 2009). It has also been observed that people consume food that contain a mixture of nutrients. According to Hu (2002), dietary pattern gives a broader picture of food and consumption of nutrients and may be more predictive of risk of diseases than individual food or nutrient. Dietary patterns vary according to culture, region, country and social economic characteristics. The study of dietary patterns affords us the opportunity to study a combination of various diets alongside their health implications. An obvious health abnormality associated with dietary patterns is overweight and obesity.Overweight and obesity are defined by the world health organization (WHO, 2008) as abnormal or excessive fat accumulation that presents a risk to health. Obesity is a medical condition in which excess body fat has accumulated to the extent that it may have an adverse effect on health, leading to reduced life expectancy and or increased health problems. It can increase the risk in maternal and infant outcomes. In Nigeria, obesity does not pose a cultural trait but may be observed with a little psychological and social stigma in extreme cases. Obesity is defined as an excess of adipose tissue resulting in body mass index (BMI) ≥30 kg/m (Calle & Kaaks, 2014). In this study, body mass index was obtained as weight (kg) divided by the square of the height (m2) and used as a criterion for classification of body weight. Underweight was defined as BMI less than 18.5 kg/m2, normal weight was defined as BMI of 18.5 to 24.9 kg/m2, overweight was defined as BMI of 25.0 to 29.9 kg/m2, while obesity was defined as BMI of 30.0 kg/m2 and above.Obesity is a product of a chronic imbalance between energy intake and energy expended (Baron, 2015). Previous studies considered obesity as the direct result of two weight-linked behaviors of physical inactivity and chronic ingestion of excess calories. Although these factors are undoubtedly the principal cause in some cases, there is now strong evidence of a genetic influence (Baron, 2015). Most human obesity generally develops from the interactions of multiple genes with environmental and behavioral factors. It has been observed that consumption of diets high in vegetables and fibre but low in meat and fat was associated with a lower risk of obesity and related cardiovascular diseases (Shang (2012). Therefore, consumption of a carefully selected diet combination serves as a health measure to prevent obesity and cardiovascular diseases.Overweight is having more body fat than is optimally healthy. Being overweight is common especially where food supplies are plentiful and lifestyles are sedentary. Excess weight has reached epidemic proportions globally, with more than 1 billion adults being either overweight or obese in 2003 (WHO, 2010). From the foregoing, it may be undoubtedly argued that overweight and obesity are associated with the risk of diabetes. Diabetes mellitus is a chronic metabolic disease characterized by elevated blood glucose levels resulting from the body’s inability to produce enough insulin or depleted insulin action, or both. The chronic hyperglycaemia in diabetes is associated with long-term damage, dysfunction, and failure of various organs, especially the eyes, kidneys, nerves, heart, and blood vessels (Alberti & Zimmet, 2011).The sign of diabetes is increased blood sugar concentration. The symptoms are, increased thirst, frequent urination, insatiable appetite, weight loss, fatigue, visual disturbances and wounds that heal slowly (Nwaigwe 2017).Shang et al. (2012) investigated the dietary pattern and its association with the prevalence of obesity and related cardio metabolic risk factors among Chinese Children. They identified three mutually exclusive dietary patterns, namely, the healthy, transitive and western dietary patterns. They observed that the western dietary pattern was associated with significantly higher concentration of low-density lipoprotein cholesterol, triglycerides, systolic blood pressure and fasting glucose and lower concentration of high-density lipoprotein cholesterol as compared with the healthy dietary pattern. Wrottesley et al. (2017) examined the influence of maternal dietary patterns on body mass index and gestational weight gain in urban black South African Women. They identified three dietary patterns, namely, western, traditional and mixed dietary patterns. They observed that the median body index was lowest in women who gained adequate weight during pregnancy, with the prevalence of excessive weight gain being significantly higher in overweight and obese women than in their normal weight counterpart who were more likely to gain either inadequate or adequate weight.The study of dietary pattern in relation to a specific disease emerged recently and has not been fully harnessed especially in Africa where variety of native foods are combined and consumed across cultural and ethnic groups. Therefore, research on dietary pattern in relation to a specific disease is also culture and region specific. Until recently, no research work on dietary pattern in relation to diabetes was seen to have been carried out in Owerri-West Area of Imo State, Nigeria. The present research is an attempt to initiate a study of dietary pattern in Owerri-West and in particular, examine its influence on overweight and obesity among women. The study will also examine the factors that influence the dietary patterns in Owerri West Local Government Area. The women were chosen for the study because, their hormones seem to be more prone to overweight and obesity especially when they begin to get pregnant and give birth to children.The findings of this work will be most beneficial to the Ministry of Health, it will help them plan and implement proper campaigns and interventions for improving the level of awareness of a healthy dietary pattern among women of Owerri West L.G.A. The findings will also be beneficial to the women in the sense that it will help them adopt a netter and healthier dietary pattern.
2. Materials and Methods
- In this section, the materials and methods employed in this study are described.
2.1. Study Design
- A cross-sectional design was employed in the study. This design was chosen because it is used in studying a variety of body weight related problems.
2.2. Area of the Study
- The study area is Owerri West L.G.A of Imo state, which is made up of fifteen (15) communities: Amakohia, Avu, Emeabiam, Eziobodo, Ihiagwa, Irete, Ndegwu, Nekede, Obinze, Oforola, Ohii, Okolochi, Okuku, Orogwe and Umuguma which also happens to be the headquaters. It is boardered to the east with Ohaji/Egbema L.G.A, South, Owerri Municipal to the North and to the West is Ngor-Okpala L.G.A.The adult population is mostly literate and are made up of mostly civil servants. Owerri West L.G.A covers an approximately 295km2 with the population figure of one hundred and one thousand, seven hundred and fifty-four (101,754) as at the 2006 census figures (National Population Commission of Nigeria, 2012). The area is an admixture of rural and urban settlements and is densely populated by the Igbo speaking tribe. There is also an interaction of other cultures due to the presence of the military barracks at Obinze and some higher institutions of learning.The area of study is rich in cultural activities like the Iriji (New Yam festival). In this area, there is a predominant belief that a woman who is fat is properly fed in her husband’s house.
2.3. Study Population
- The study population consisted of adult females in the communities in Owerri West L.G.A who are within the age range of 18-55 years.
2.4. Sample and Sampling Technique
- A sample size of 382 was taken for the study. The sample size was determined by using the Yamane's formula,
 Where N is the study population (8700), n is the sample size and e is the acceptable sample error (Yamane, 1967). In this study, e was taken as 0.05. Hence,
 Systematic sampling technique was employed to select participants from each of the communities for the study with a sampling interval of 23. Participants were drawn from each of the five communities Eziobodo, Emeabiam, Okolochi, Ihiagwa and Obinze. These communities were chosen from the study population because the participants were more accessible to the researcher. Participants from the communities were numbered according to the houses in which they live. After each interval of 23 houses in each of the communities, a participant is randomly chosen from the 23rd house until the desired sample size was achieved.
2.5. Instrument for Data Collection
- The researcher used a semi structured self-administered questionnaire which had three sections, A, B and C. Section A contained the socio-demographic variables such as age, educational background, occupation, marital status, average monthly income and religion, in which the participants carefully selected from the options that were provided, the Section B contained the diabetic status and anthropometric measurements, while the Section C contained the food frequency of the respondents using 35 different foods . The other instruments used were Standard weight scale (kg) which was used to measure the weight and meter rule (centimeters) which was used for height measurement. A Gluco meter which was used to check the blood-sugar level of respondents in order to confirm their diabetic status. The questionnaire was validated (Face validity) by two professionals, one from the Department of Public Health and the other from the Department of Statistics.
2.6. Methods of Data Collection
- Respondents were given the questionnaire after their consent was sought. Their heights and weights were measured with the appropriate instruments and the measurements were recorded.
2.7. Statistical Analysis
- Data were analysed with the aid of SPSS Version 21. Statistical tools such frequencies, percentage, pie chart, bar chart and chi-square were used to analyse the data.
2.8. Ethical Consideration
- A letter of introduction was obtained from the Department of Public Health. Federal University of Technology Owerri, and was given to the medical director in the hospitals. A verbal informed consent was given to both the literate and non-literate respondents in their local languages. All participants were assured anonymity and the information collected was kept confidential.
3. Results and Discussion
- In this section, the results of the data obtained are stated and discussed in sub-sections.
3.1. Socio-Demographic Characteristics of Respondents
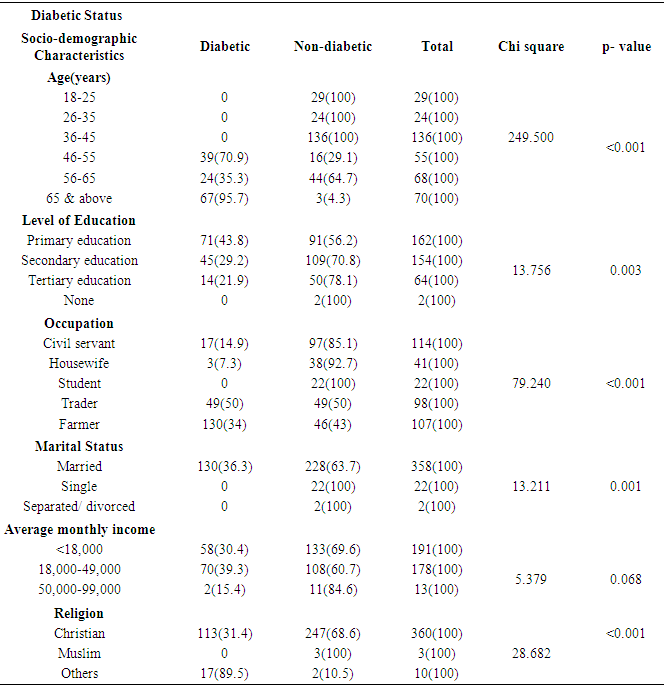
- Table 1 shows none of the participants under 45 years of age was diabetic. The table also shows that 70.9% of the participants between the ages of 46 and 55 were diabetic while 29.1% of them were non-diabetic; 35.3% of participants between the ages 56-65 were diabetic while 64.7% were non-diabetic and 95.7% of participants above years of age were diabetic while only 4.3% were non-diabetic. These findings are related to the report of the study conducted in China by Fung et al. (2001) which also reported a high number of age group 40 to 75 years 250(53.6%) as respondents in their study.
|
 This corresponds with the findings of Shu et al. (2015). In terms of the occupation of the participants, traders had the greatest number of participants with diabetes (50%) followed by farmers (34%) while women whose average income is under ₦49,000.00 were observed to be more diabetic. Majority of the women used for the study were Christians.Figure 1 shows the diabetic status among women in Owerri West L.G.A. One hundred and thirty (34%) were diabetic while 252 (66%) were non- diabetic.
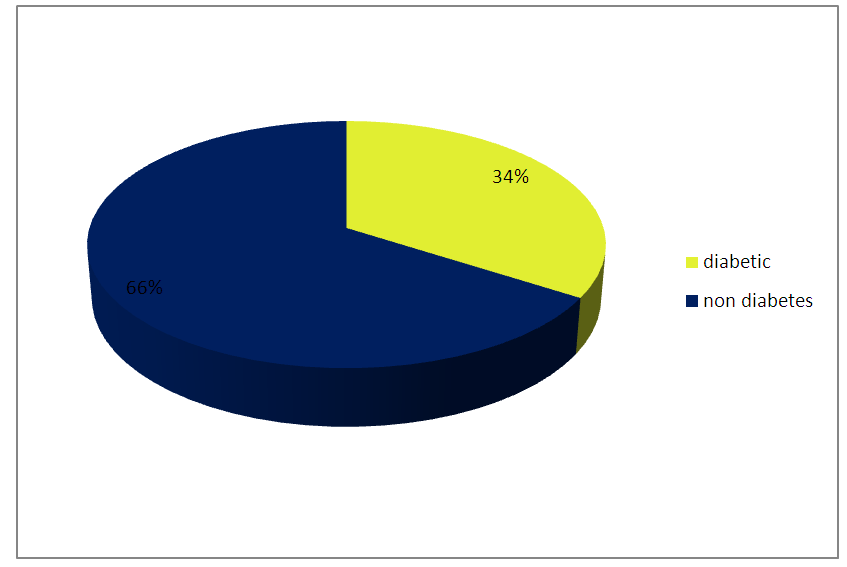 | Figure 1. Diabetic Status of Women in Owerri West L.G.A |
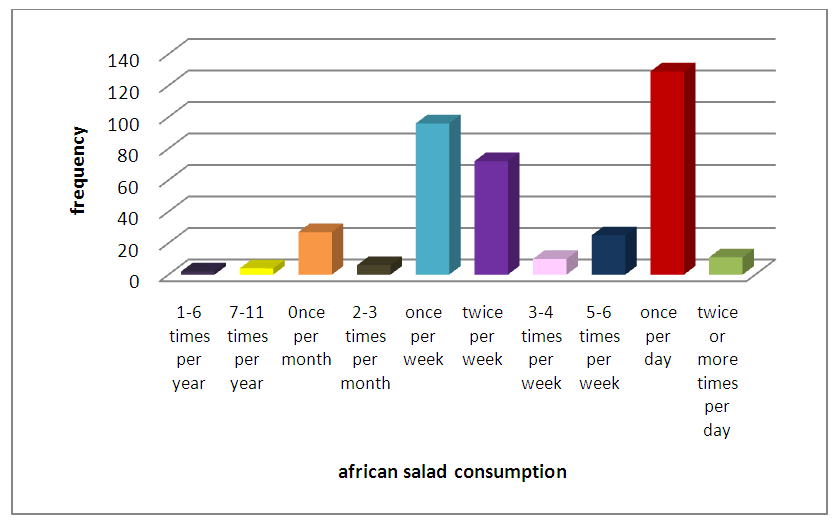 | Figure 2. African salad consumption by the respondents |
3.2. Carbohydrate Dietary Pattern of Women in Owerri West L.G.A
- Table 2 shows the distribution of carbohydrate-rich foods consumed by the respondents. The consumption of Potato by the respondents were as follows: Once per month 2(0.5%), 2-3 times per month 10(2.6%), once per week 141(36.9%), twice per week 112(29.3%), 3-4 times per week 8(2.1%), 5-6 times per week 8(2.1%), once per day 86(22.5%), and twice or more times per day 15(3.9%).Rice consumption by respondents were as follows: 1-6 times per year 3(0.8%), once per week 3(0.8%), twice per week 141(36.9%), 3-4 times per week 127(33.2%), 5-6 times per week 15(3.9%), once per day 89(23.3%), and twice or more times per day 4(1%).Yam consumption by respondents were as follows: Once per month 9(2.4%), 2-3 times per month 13(3.4%), once per week 101(26.4%), twice per week 176(46.1%), 3-4 times per week 61(16%), 5-6 times per week 11(2.9%), once per day 3(0.8%), and twice or more times per day 8(2.1%).Cassava (Akpu) consumption by respondents were as follows: Twice per week 10(2.6%), 3-4 times per week 98(25.7%), 5-6 times per week 204(53.4%), once per day 68(17.6%), and twice or more times per day 2(0.5%). African Salad (Abacha) consumption by respondents were as follows: 1-6 times per year 2(0.5%), 7-11 times per year 4(1%), Once per month 27(7.1%), 2-3 times per month 6(1.6%), once per week 96(25.1%), twice per week 72(18.8%), 3-4 times per week 10(2.6%), 5-6 times per week 25(6.5%), once per day 129(33.8%), and twice or more times per day 11(2.9%).Bread consumption by respondents were as follows: never 9(2.4), 7-11 times per year 3(0.8%), 2-3 times per month 9(2.4%), once per week 103(27.0%), twice per week 175(45.8%), 3-4 times per week 50(13.1%), 5-6 times per week 18(4.7%), once per day 9(2.4%), and twice or more times per day 6(1.6%). Cake/ Biscuit consumption by respondents were as follows: never 118(30.9%), 1-6 times per year 2(0.5%), 7-11 times per year 2(0.5%), Once per month 60(15.7%), 2-3 times per month 59(15.4%), once per week 54(14.1%), twice per week 24(6.3%), 3-4 times per week 27(7.1%), 5-6 times per week 6(1.6%), once per day 26(6.8%), and twice or more times per day 4(1%). Sugar/ Honey in Tea consumption by respondents were as follows: never 195(51%), 1-2 times per week 35(9.2%), 3-4 times per week 9(2.4%), once per day 141(36.9) and 2-3 times per day 2(0.5%).Sugar/ Honey in Food consumption by respondents were as follows: never 377(98.7%), 1-6 times per week 2(0.5%), and once per day 3(0.8%).Therefore, Carbohydrate- rich foods such as: Potato, Yam, Cassava (Akpu), African salad (Abacha), Bread, etc., had a very high consumption by respondents. So also, foods rich in sugar were shown to be greatly consumed by the respondents which greatly affect their diabetic status by increasing the prevalence. This is very much in line in previous study of (Santos et al., 2014) which reported that roots and tubers (yam, cassava, potato), sugars and Cereals (rice, cassava flour, and pasta) had high rates of consumption by their respondents. With Carbohydrate having an obesogenic value of 0.459 and a prudent value of 0.219.
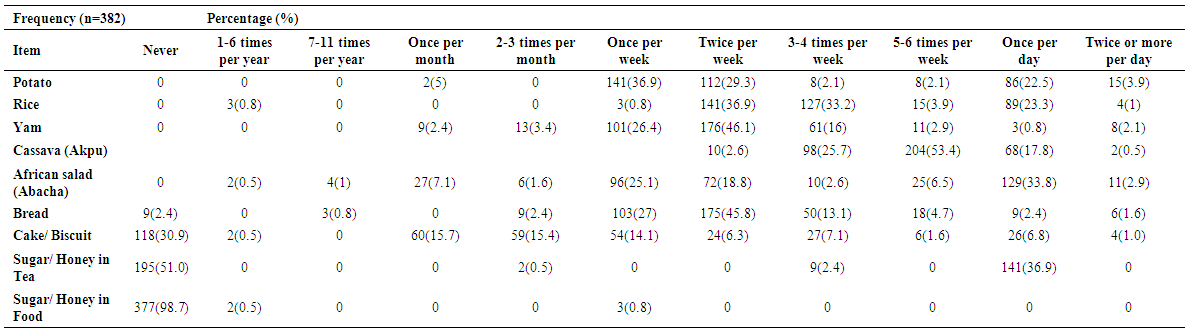 | Table 2. Carbohydrate Dietary Pattern of Women in Owerri West L.G.A |
3.3. Protein Dietary Pattern of Women in Owerri West L.G.A
- Table 3 shows the distribution of protein-rich foods consumed by the respondents. The consumption of Beans by the respondents were stated thus: 2-3 times per month 5(1.3%), once per week 164(42.9%), twice per week 148(38.7%), 3-4 times per week 21(5.5%), 5-6 times per week 24(6.3%), once per day 18(4.7%), and twice or more times per day 2(0.5%).
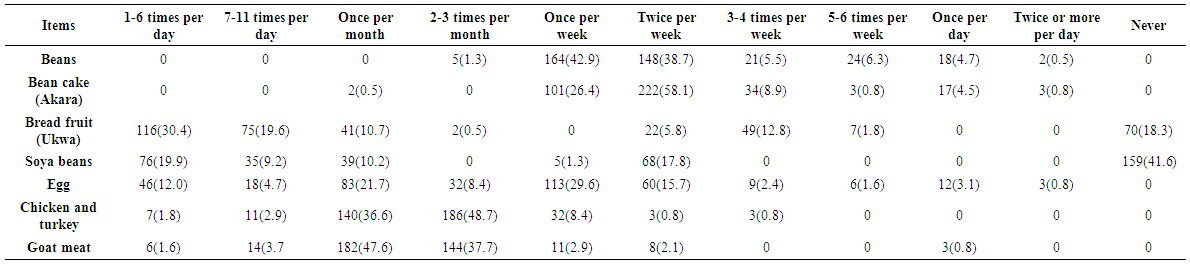 | Table 3. Protein Dietary Pattern of Women in Owerri West L.G.A |
3.4. Lipid Dietary Pattern of Women in Owerri West L.G.A
- Table 4 shows the distribution of lipid-rich foods consumed by the respondents. The consumption of Butter by the respondents were stated thus: never 217(56.8%), 1-6 times per year 16(4.2%), 7-11 times per year 31(8.1%), 2-3 times per month 26(6.8%), once per week 44(11.5%), twice per week 44(11.5%), 3-4 times per week 2(0.5%), and once per day 2(0.5%).
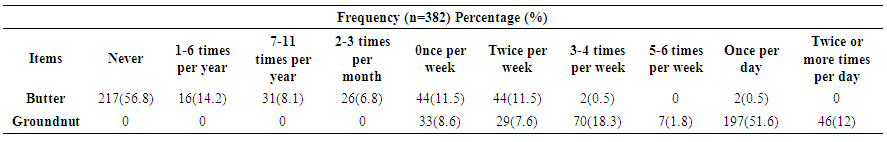 | Table 4. Lipid Dietary Pattern of Women in Owerri West L.G.A |
3.5. Vitamins and Minerals Dietary Pattern of Women in Owerri West L.G.A
- Table 5 below shows the distribution of Vitamin and Mineral-rich foods consumed by the respondents. The consumption of Fruits by the respondents were stated thus: never 3(0.8%), 1-6 times per year 3(4.2%), once per week 5(1.3%), twice per week 53(13.9%), 3-4 times per week 181(47.4%), once per day 55(14.4%), and twice or more times per day 3(0.8%).
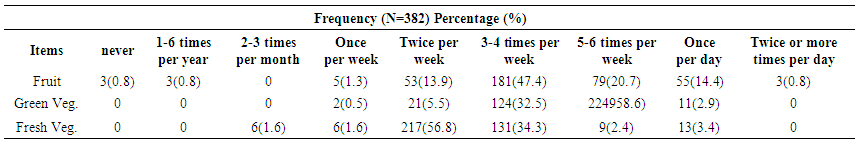 | Table 5. Vitamin/ Mineral Dietary Pattern of Women in Owerri West L.G.A |
3.6. Liquid/ Fluid Dietary Pattern of Women in Owerri West L.G.A
- Table 6 shows the distribution of liquid/ fluid- rich foods consumed by the respondents. The consumption of Water by the respondents were stated thus: once per day 2(5%), 2-3 times per day 13(3.4%), 4-5 times per day 103(27%), and six or more times per day 264(69.1%).
 | Table 6. Liquid/ Fluid Dietary Pattern of Women in Owerri West L.G.A |
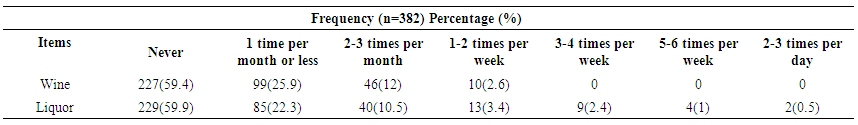
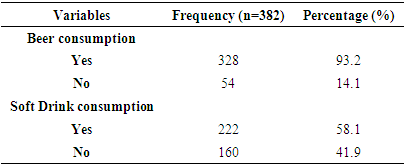
3.7. Beer and Soft Consumption by Women in Owerri West L.G.A
- Table 7 shows the rate of Beer and Soft drinks consumed by the respondents. For Beer consumption, 328(85.9%) indicated that they drink beer while 54(14.1%) indicated that they don’t drink beer.
|
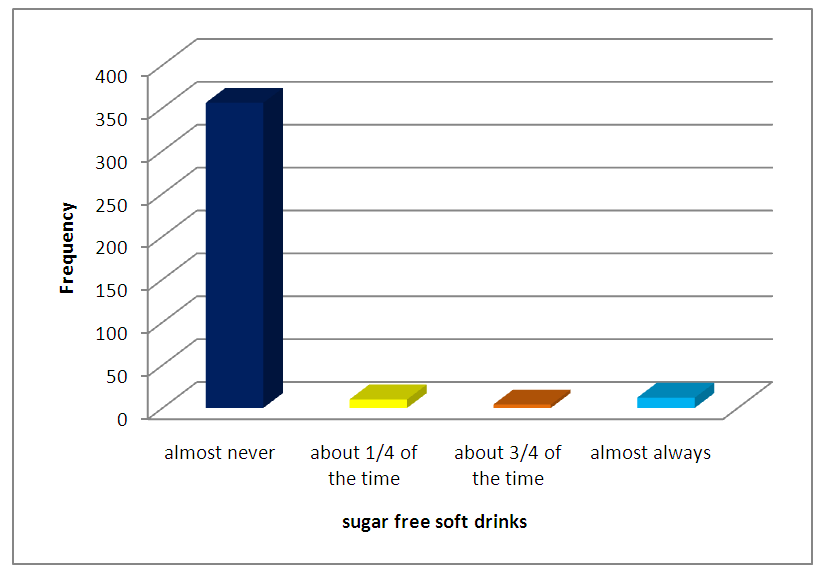 | Figure 3. Intake of diet or sugar- free soft-drink |
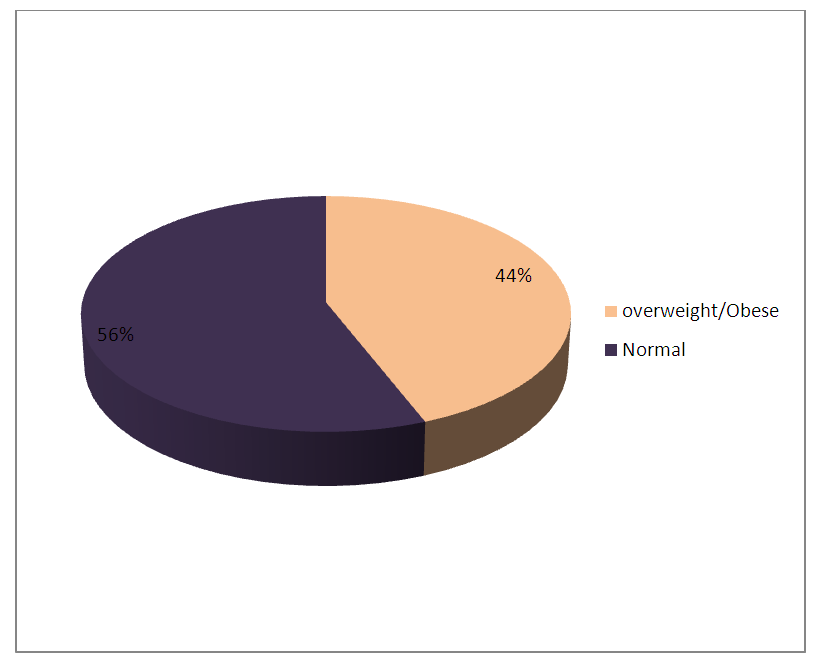 | Figure 4. Body Mass Index Status of Women in Owerri West L.G.A |
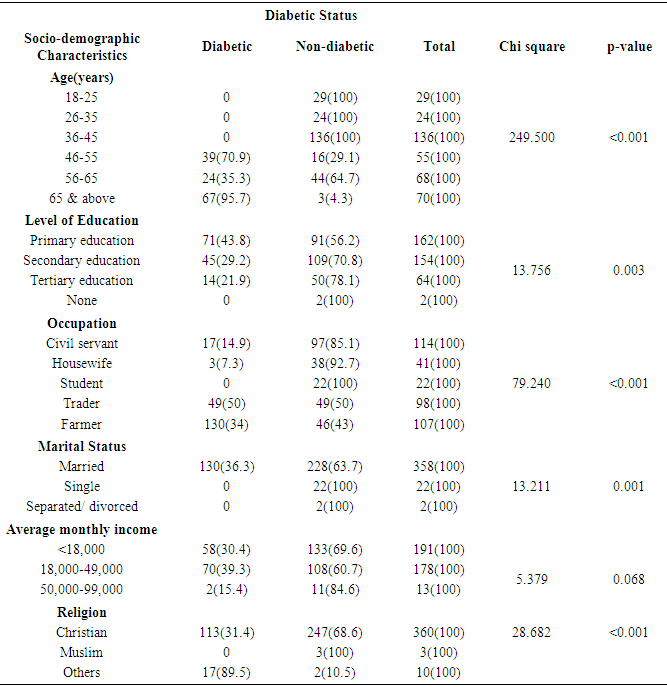
3.8. Socio demographic Factors Influencing the Prevalence of Diabetes Among Women in Owerri West L.G.A
- The result of Table 8 below shows the influence of socio demographic factors on the prevalence of diabetes among women in Owerri West L.G.A. the results shows a higher proportion of women aged 65 and above to be diabetic 67(95.7%) while 3(4.3%) were non- diabetic. Women aged 56 to 65 years, 24(35.3%) were diabetic while 44(64.7%) were non-diabetic. Women aged 46-55 years, 39(70.9%) were diabetic while 16(29.1%) were non-diabetic. For women aged 36-45 years, none were diabetic while 136(100%) were non-diabetic. For women aged 26-35 years, none were diabetic while 24(100%) were non- diabetic. Also, for women aged 18-25 years, none were diabetic while 29(100%) were non-diabetic. The result in Table 8 shows a significant statistical association between age and the prevalence of diabetes among women in Owerri West L.G.A. (
 = 249.500.,
  ). The result also shows that majority of women with primary education, 71(43.8%) were diabetic while 91(56.2%). Women with secondary education, 45(29.2%) were diabetic while 109(70.8%) were non- diabetic. Women with tertiary education, 14(21.9%) were diabetic while 50(78.1%) were non- diabetic. Also, all women with no formal education, 2(100%) were non-diabetic. The result as presented shows that there is a significant statistical association between level of education and the prevalence of diabetes among women in Owerri West L.G.A. (
 = 13.756,
  ).Greater proportions of the women who were farmers, 61(57%) were diabetic while 46(43%) were non-diabetic. Women who were traders, 49(50%), were diabetic while 49(50%) were non-diabetic. Women who were civil servants, 17(14.9%) were diabetic while 97(85.1%) were non-diabetic. Women who were housewives, 3(7.3%) were diabetic while 38(92.7%) were non-diabetic. Also, all women who were students, 22(100%) were non-diabetic. In addition, the result presented also shows that there is a significant statistical association between occupation and the prevalence of diabetes among women in Owerri West L.G.A. (
 = 79.240,
  ).The result also shows that majority of married women, 130(36.3%) were diabetic while 228(63.7%) were non-diabetic. All single women, 22(100%) were non-diabetic. Also all separated/ divorced women, 2(100%) were non-diabetic. In addition, the result presented also shows that there is a significant statistical association between marital status and the prevalence of diabetes among women in Owerri West L.G.A. (
 ).Majority of women who earn an average monthly income of ₦18,000- ₦49,000, 70(39.3%) were diabetic while 108(60.7%), were non-diabetic. Women who earn an average monthly income of less than ₦18,000, 58(30.4%) were diabetic while 133(69.6%), were non-diabetic. Also, women who earn an average monthly income of ₦50,000- ₦99,000, 2(15.4%) were diabetic while 11(84.6%), were non-diabetic. However, the result shows no significant statistical association between average monthly income and the prevalence of diabetes among women in Owerri West L.G.A.
  Also, the result shows that larger number of women who were Christians, 113(31.4%), were diabetic while 247(68.6%) were non-diabetic. All women who were Muslims, 3(100%) were non-diabetic. Women who practice other religion, 17(89.5%) were diabetic while 2(10.5%) were non-diabetic. Therefore, the result shows a significant statistical association between religion and the prevalence of diabetes among women in Owerri West L.G.A.
 Therefore, except from the average monthly income; age, level of education, occupation, marital status and religion have influence on the prevalence of diabetes among women in Owerri West L.G.A. as is presented in Table 8 below. It was observed that there is a significant statistical association between marital status and the prevalence of diabetes among women in Owerri West L.G.A; this is similar to the finding of (Ke et al., 2018).
|
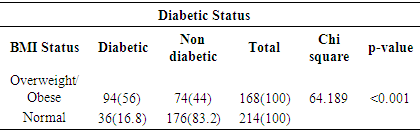
3.9. Body Mass Index Status Influencing the Prevalence of Diabetes among Women in Owerri West L.G.A
- Table 9 demonstrates the influence of BMI status on the prevalence of diabetes among women in Owerri West L.G.A. Majority of women who were overweight/ obese, 94(56%) were diabetic while 74(44%) were non-diabetic. Women who had normal BMI, 36(16.8%) were diabetic while 178(83.2%) were non-diabetic. Therefore, the result shows a significant statistical association between BMI status and the prevalence of diabetes among women in Owerri West L.G.A.
 Therefore, this shows that there is a significant statistical association between BMI status and the prevalence of diabetes among women in Owerri West L.G.A. This finding corresponds with the previous finding of (Ke et al., 2018) in their work on the Association between dietary protein intake and type 2 diabetes varies by dietary Pattern in China which stated that the BMI status of their respondents had an influence on the prevalence of diabetes.
|
4. Conclusions
- This study examined the dietary patterns and the influence of dietary patterns among women in Owerri-West Area of Imo State, Nigeria in relation to overweight/obesity and diabetes. The results obtained show that age, education, occupation, marital status and religion had significant influences on the dietary patterns of the participants and the prevalence of diabetes. The results also show that carbohydrate, protein and lipid rich foods alongside soft drinks and beer were in high consumption among the participants with carbohydrate as the highest. It was also observed that about 34% of the women included in the study were diabetic and it was deemed to be high.