-
Paper Information
- Paper Submission
-
Journal Information
- About This Journal
- Editorial Board
- Current Issue
- Archive
- Author Guidelines
- Contact Us
International Journal of Diabetes Research
p-ISSN: 2163-1638 e-ISSN: 2163-1646
2019; 8(2): 30-40
doi:10.5923/j.diabetes.20190802.03

Factors Influencing the Adoption of Health Information Technology for Optimal Chronic Disease Management: Diabetes Management in Southwestern Nigeria as a Case Study
 Abstract
 Reference
 Full-Text PDF
 Full-text HTML
Ayanlade O. S.1, Oyebisi T. O.1, Kolawole B. A.2
1African Institute for Science Policy and Innovation (AISPI), Obafemi Awolowo University, Ile-Ife, Nigeria
2Department of Medicine, Faculty of Clinical Sciences, College of Health Sciences, Obafemi Awolowo University, Ile-Ife, Nigeria
Correspondence to: Ayanlade O. S., African Institute for Science Policy and Innovation (AISPI), Obafemi Awolowo University, Ile-Ife, Nigeria.
| Email: |  |
Copyright © 2019 The Author(s). Published by Scientific & Academic Publishing.
This work is licensed under the Creative Commons Attribution International License (CC BY).
http://creativecommons.org/licenses/by/4.0/

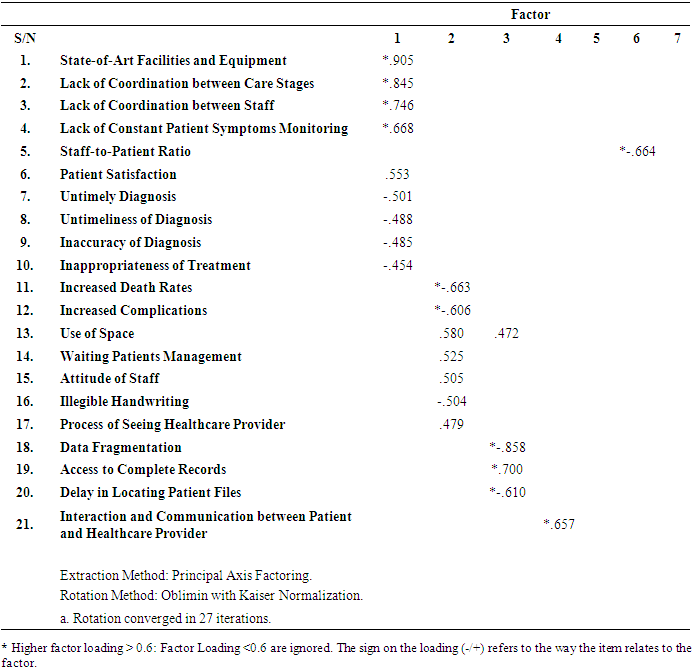
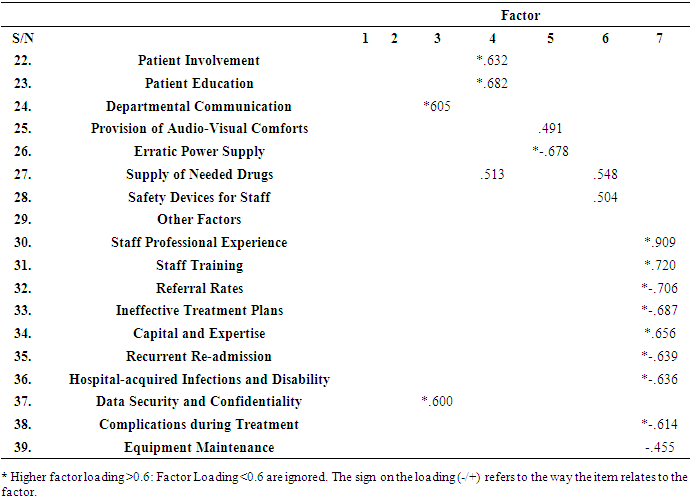
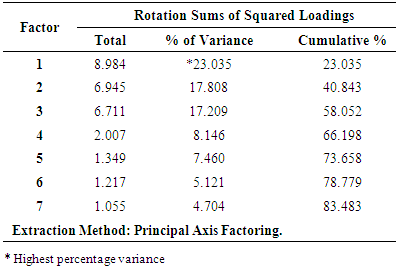
Despite diabetes management techniques already in use in Nigeria, desired care outcomes are not acceptable and due to this, patient satisfaction is not optimal. On this note, and having known the prevalence and the nature of diabetes as a chronic disease that needs optimal management, this study therefore investigates the factors influencing optimal management of diabetes in Nigeria using Health Information Technology. However for this study, the model of Donabedian that proposed a healthcare quality systems-based framework of structure, process and outcome, to measure quality of health care, so as to give an idea of where problems are stirring, and how they could be addressed was used. Both qualitative and quantitative data collection methods were used. The quantitative data were collected through questionnaire, while the qualitative data were collected through key informant interviews. Thirty nine (39) factors were presented, and after using factor analysis and some other statistical tools, the seven most important factors that emerged were inadequate monitoring of patient risky indicators; increased unplanned evil occurrences; unavailability of needed/complete confidential patient data; lack of patient involvement and education; erratic power supply; not reasonable staff to patient ratio; and inadequate staff skills and expertise. The first factor accounted for most variance of 23.03, while the rest of the six factors accounted for 17.81, 17.21, 8.15, 7.46, 5.12 and 4.70, respectively. Thus, all the factors accounted for a cumulative of 83.5%. It was then concluded that the use of Health Information Technology could alleviate some of these factors if used meaningfully.
Keywords: Chronic diseases, Health Information Technology, Diabetes, ICT
Cite this paper: Ayanlade O. S., Oyebisi T. O., Kolawole B. A., Factors Influencing the Adoption of Health Information Technology for Optimal Chronic Disease Management: Diabetes Management in Southwestern Nigeria as a Case Study, International Journal of Diabetes Research, Vol. 8 No. 2, 2019, pp. 30-40. doi: 10.5923/j.diabetes.20190802.03.
Article Outline
1. Introduction
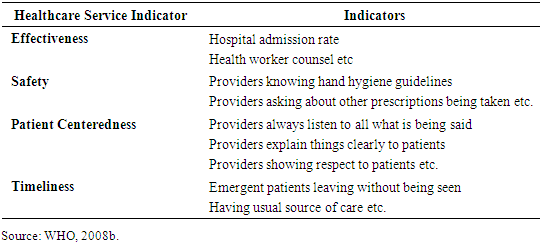
- In many countries, especially developing countries, the rate of complications and death rates of chronic diseases, especially diabetes, have increased rapidly over the last two decades, due to changing behavioural patterns, for example in diets and exercise (Ifijeh, 2016). Among the chronic diseases, the prevalence of diabetes mellitus (simply called diabetes) particularly is on the rise in Nigeria, as it is fast becoming the most recurrent disease, associated with premature death of thousands of Nigerians, robbing the country of notable leaders and scholars. According to Obinna (2018) and Duru (2012), Nigeria has the highest number of people living with diabetes in Africa, with not less than 3.9M estimated to be with diabetes, while close to 846,000 are yet to be aware they have the disease. Furthermore, WHO (2011) still alerted globally that diabetes will remain to be a major threat to public health beyond the year 2030. This is because in the year 1985, just thirty (30) million people had diabetes and presently, more than three hundred and sixty six (366) million have diabetes, and by 2030, five hundred and twenty two (522) million people will be living with diabetes if the pandemic is not contained.Diabetes is a chronic disease that ensues when the pancreas is not able to make insulin, or when the body cannot utilize the insulin it produces, which leads to raised glucose levels in the blood, known as hyperglycaemia. It results in many complications and permanent disabilities like blindness, amputation of limbs, impotence, kidney failures, still births, pregnancy wastages, among others, which could be the reason of its high rate of death (Chinenye and Ogbera, 2013). Therefore, WHO (2008a) noted that diabetes has a profound impact on longevity of life of its patients, because for instance, a person diagnosed to have Type 2 diabetes during his middle age (40-60 years), stands to lose as much as ten years of life expectancy. Health systems are thus only as effective as the services they provide, and strengthening service delivery quality is a key strategy to achieve the Millennium Development Goals (WHO, 2008b). Thus, optimal healthcare delivery can be related to the quality of healthcare services being provided. Several researchers have proposed many models of measuring quality indicators, for optimal disease management in the health sector. For example, WHO (2008b) explained that a high healthcare quality is a timely care that is effective, safe and centered on the patient as shown in Table 1, listing some of the possible parameters.
|
|
2. Materials and Methods
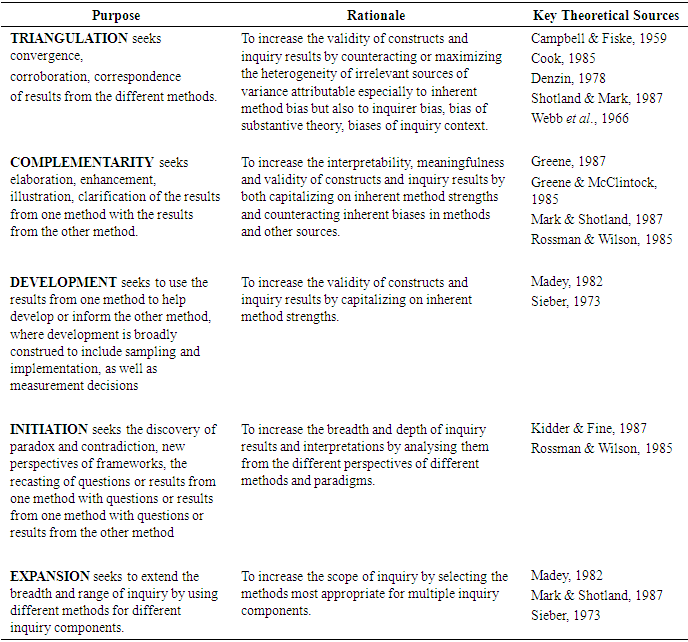
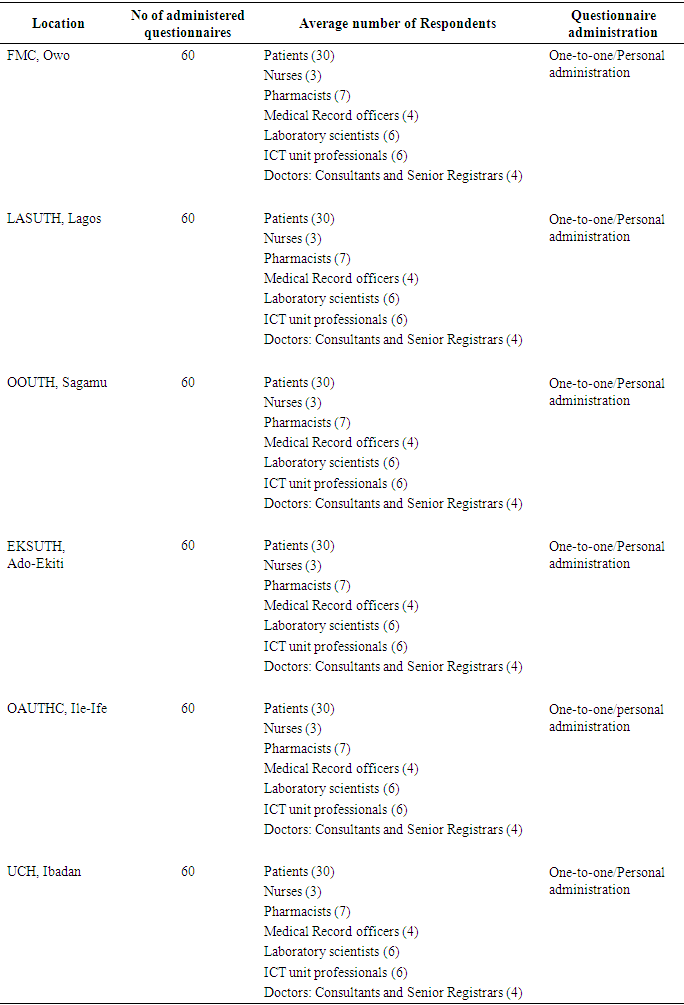
- The study location is the Southwestern part of Nigeria. Though, Nigeria has six geopolitical zones, out of which one (Southwestern) zone was taken because of security issues in the country among other reasons. This zone has six states and to avoid bias about any state, one tertiary hospital was selected from each state, so that all the states would have equal representation in the study. Therefore, purposive sampling was used so that both State and Federal tertiary hospitals were included across the states, thus making a total of six tertiary hospitals (three Federal and three State hospitals). After obtaining ethics clearances from these selected hospitals, and to obtain data for this study, a mixed method of quantitative and qualitative data collection was used. The quantitative data were collected through questionnaire, while qualitative data were collected through key informant (semi-structured) interviews. Some of the purposes why mixed method was used for this study is shown in Table 3. For questionnaire administration, the study population was adult type-2 diabetic out-patients attending the hospitals under study; the Doctors (both senior registrars and the consultants) and Nurses attending to them. Also, the Pharmacists; Laboratory scientists (e.g. for blood test, x-ray, urine test etc); Medical record officers; and ICT unit professionals of the hospitals were included in the study. Furthermore, two of the top management board members making decisions for the hospitals, randomly selected based on their availability, were interviewed, so also to explore their views about the factors influencing optimal management of chronic diseases in Nigerian hospitals.
|
|
3. Results and Discussions
3.1. Factors Influencing Optimal Diabetes Management Using the HIT Options in the Study Area
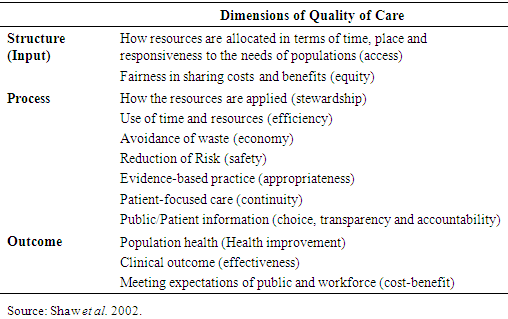
- Out of the three hundred (360) copies of questionnaire that were administered, only three hundred (300) copies were able to be retrieved, thus making the response rate to be 83.33%. In the questionnaire, thirty-nine (39) factors altogether identified in the literature were investigated to know the ones influencing optimal diabetes management in the study area. The model after Donabedian (1980) earlier discussed was followed, which categorised the factors under Structure, Process and Outcome. Statistical Package for Social Sciences (SPSS) version 20.0 was used to do the analysis for the study.
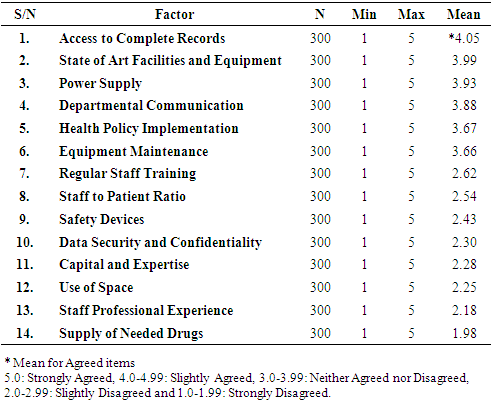
3.1.1. Structure-Based Factors Influencing Optimal Diabetes Management
- Fourteen (14) factors were examined under the Structure parameter. The mean ranking, in descending order of the variables are presented in Table 5. There were 300 respondents (N) examined (both Staff and Patients) on a 5-point Likert rating scale of measurement, ranging from 1 (Strongly Disagree) to 5 (Strongly Agree). From the table, it is obvious that’ Access to Complete Records’ has the highest mean ranking of 4.05, which is in line with what Herrin et al. (2012) discussed that having a complete record is a vital factor for diabetes management, in that it allows the physicians to make an excellent decision, having all the information needed at his fingertips.
|
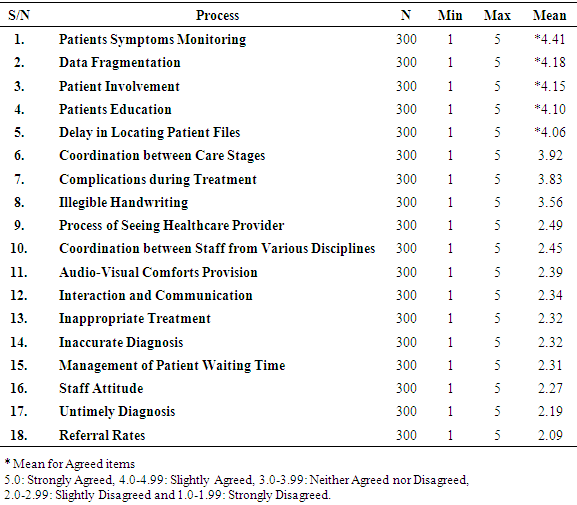
3.1.2. Process-Based Factors Influencing Optimal Diabetes Management
- Eighteen (18) factors were examined under the Process parameter. The mean ranking, in descending order of the factor variables are presented in Table 6. There were also 300 respondents (N) examined (both Staff and Patients) on a 5-point Likert rating scale of measurement ranging from 1 (Strongly Disagree) to 5 (Strongly Agree). From the table, it is evident that ‘Patients Symptoms Monitoring’, has the highest mean of 4.41. This agrees with what Andry et al. (2009) suggested that optimal diabetes management depends on how well health practitioners could monitor patient symptoms indicators like blood glucose, blood pressure, BMI etc so as to avoid complications.
|
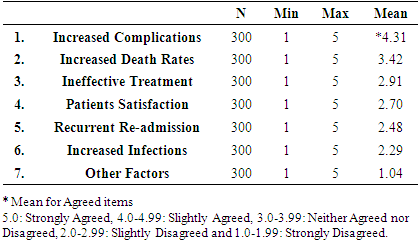
3.1.3. Outcome-Based Factors Influencing Optimal Diabetes Management
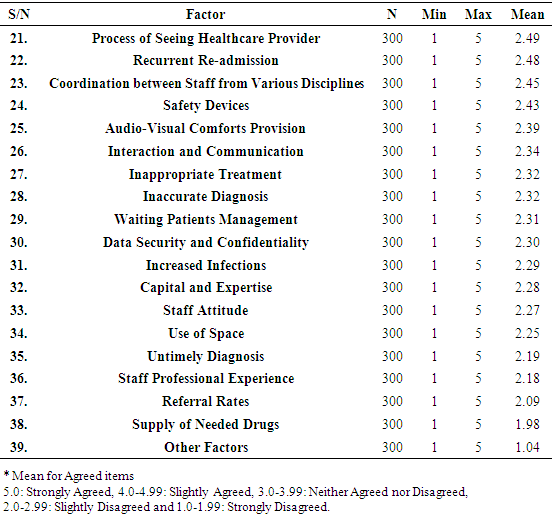
- Six (6) factors were examined under the Outcome parameter. The mean ranking, in descending order of the factors are presented in Table 7. There were also 300 respondents (N) examined (both Staff and Patients) on a 5-point Likert rating scale of measurement ranging from 1 (Strongly Disagree) to 5 (Strongly Agree). From the table, it is apparent that ‘Increased Complications’ is the most-influencing factor (Mean 4.31) in the outcome range. This might be because of what Connor (2010) and Free et al. (2013) noted that when there is no/minimal diabetes complication, then diabetes is being managed optimally.
|
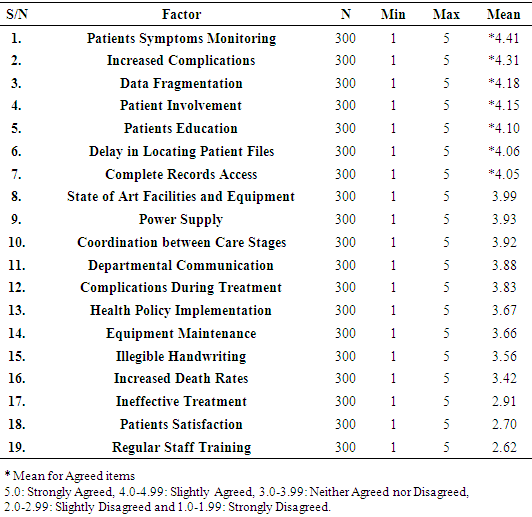
3.1.4. General Factors Influencing Optimal Diabetes Management in the Study Area
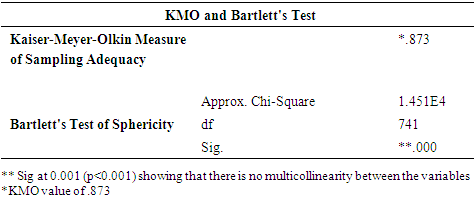
- Taking all the factors together (Structure, Process and Outcome Parameters), a total of thirty nine (39) factors, mean ranking and factor analysis were used to examine the paramount factors influencing diabetes management in the study area.For the mean ranking, Tables 8a and 8b present the summary of all the factors influencing optimal diabetes management in the study area. Thus the factors, in descending order of mean, include Patient Symptoms Monitoring (being the highest because it will determine the disease complication); Increased complications; Data fragmentation; Patient Involvement; Patients education; Delay in locating patient files; and access to complete records. In addition, the total number of factors was also reduced using factor analysis. However before using factor analysis, some tests were carried out on the data to be sure the statistical tool would be appropriate. Some of the tests are Kaiser-Meyer-Olkin (KMO) Measure of Sampling Adequacy; and Bartlett's Test of Sphericity as shown in Table 9.
|
|
|
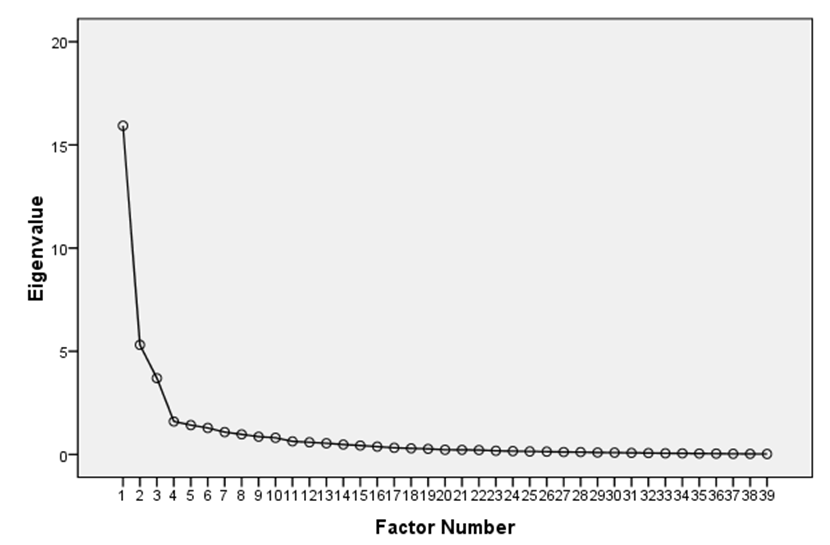 | Figure 1. Scree Plot Diagram Showing the Number of Factors Extracted Using the Factor Analysis: 7 Factors |
|
|
|
4. Conclusions
- This study investigated the factors influencing optimal management of chronic diseases in Southwestern Nigeria, taking diabetes as a case study. The factors were grouped according to Donabedian (1980) under the structure; process; and outcome-based with fourteen, eighteen and six variables respectively under each of them. These variables were analysed under each group, and also altogether. It was therefore found out that adequate patients monitoring, reducing complications, avoiding data fragmentation, involving patient in his treatment, encouraging patients’ education, avoiding delay in locating patients’ files and access to complete records among others, are very critical in the management of chronic diseases such as diabetes. It is therefore recommended that the use of health information technology should be encouraged more in the management of chronic diseases so as to alleviate all these factors, and to enhance optimal management of chronic diseases in Nigeria.