-
Paper Information
- Paper Submission
-
Journal Information
- About This Journal
- Editorial Board
- Current Issue
- Archive
- Author Guidelines
- Contact Us
International Journal of Diabetes Research
p-ISSN: 2163-1638 e-ISSN: 2163-1646
2018; 7(3): 50-56
doi:10.5923/j.diabetes.20180703.02

Glycated Albumin as a Predictor of Glycemic State in Type 2 Diabetes Mellitus with Chronic Kidney Disease
 Abstract
 Reference
 Full-Text PDF
 Full-text HTML
Zeinab H. El Sayed1, Sahar Mohamed Ismail1, Hanan A. EL-Hagrasy2
1Department of Internal Medicine, Al-Azhar University Girls, Cairo, Egypt (MD)
2Department of Clinical Pathology Al-Azhar University for Girls, Cairo, Egypt (MD)
Correspondence to: Zeinab H. El Sayed, Department of Internal Medicine, Al-Azhar University Girls, Cairo, Egypt (MD).
| Email: |  |
Copyright © 2018 The Author(s). Published by Scientific & Academic Publishing.
This work is licensed under the Creative Commons Attribution International License (CC BY).
http://creativecommons.org/licenses/by/4.0/

Glycated hemoglobin (HbA1c) has a limited value in diabetic hemodialysis (HD) patients. Glycated albumin (GA) is a promising marker for hyperglycemia but the data about this marker has been insufficient in diabetic kidney disease. We aimed to evaluate GA% and GA to HbA1c % as an alternative marker to detecting glycemic level among macroalbuminuric HD type 2 diabetes mellitus (T2DM) treated by erythropoietin and to predict the development of microalbuminuria. Patients and Methods: This study enrolled fifteen newly diagnosed T2DM patients with normoalbuminuria as a group I (GI), fifteen T2DM had microalbuminuria as GII, and GIII consists of another fifteen T2DM on HD with macroalbuminuria received erythropoietin. We measured fasting blood glucose (FBS), serum albumin, albumin excretion rate in urine, HbA1c, and GA then calculates the GA/HbA1c ratio. Results: We found a significant increase of GA% in GII and GIII than in GI, but there was a non-significant increase in GIII when compared to GII. There was a significant increase of GA/HbA1c ratio in GIII than in GII or in GI in spite of FBS level, but non- significant difference between GI and GII in spite of a significant increase in FBS and HbA1c in GII than a GI. Conclusion: GA% can use as a marker of glycemia in normo and microalbuminuria, and can predict the development of microalbuminuria. But GA/HbA1c ratio can be considered as a marker of development of macroalbuminuria in T2DM, but not reflects the glucose level in diabetic HD.
Keywords: Chronic Kidney Disease, Glycated Albumin, Glycated Albumin to Glycated Hemoglobin ratio, Glycated Hemoglobin, Type 2 Diabetes mellitus
Cite this paper: Zeinab H. El Sayed, Sahar Mohamed Ismail, Hanan A. EL-Hagrasy, Glycated Albumin as a Predictor of Glycemic State in Type 2 Diabetes Mellitus with Chronic Kidney Disease, International Journal of Diabetes Research, Vol. 7 No. 3, 2018, pp. 50-56. doi: 10.5923/j.diabetes.20180703.02.
Article Outline
1. Introduction
- In patients with diabetes mellitus (DM), the glucose monitoring is essential for glycemic control [1]. Good glycemic control can decrease the incidence of development of microalbuminuria and macroalbuminuria [2]. Moreover, it can decrease the cardiovascular morbidity and mortality among DM patients on hemodialysis (HD) [3-5]. Glycated hemoglobin (Hba1c) is considered the reference test for the assessment of glycemic control [6]. Unfortunately, Hba1c does not accurately reflect the blood glucose concentration in diabetic DM patients [7, 8]. Hence, choosing a reliable clinical biomarker rather than Hba1c to monitor glycemic control is critical and mandatory in DM diabetic patients. Albumin is one of the most abundant plasma proteins [9]. The glycation of albumin to form glycated albumin (GA) is ten times more than the glycation of hemoglobin in type 2 (t2) DM [10]. GA is a marker reflects a short-term glycemic control [1]. But, there is a limited data concerning the GA as a glucose monitoring tool in t2dm on HD or t2dm who had microalbuminuria. Therefore, we designed this study to evaluate GA% and GA to the Hba1c ratio as an alternative marker to Hba1c in detecting glycemic level in macroalbuminuric t2dm on hemodialysis treated by erythropoietin and to predict the development of microalbuminuria among t2dm patients to improve the quality of their life.
2. Patients and Methods
2.1. Patients
- The current study was enrolled 45 Egyptian patients had T2DM (17 men, 28 women), on oral hypoglycemic agents and/ or injectable insulin, their age ranged between 40 to 60 years. It was carried out of the department of internal medicine, AL-Zahraa University hospital and the data were collected between April 2017 and January 2018. The diagnosis of diabetes was based on the criteria in the American Diabetes Association (fasting blood glues ≥ 120 mg/dl or HbA1c ≥ 6.5%) [11]. This study was carried out in accordance with the guidelines of the declaration of Helsinki and its subsequent amendments written consent was obtained from all patients prior to enrollment in the study and was approved by the Ethics Committee of Al-Azhar University.The patients classified into three groups according to the urinary albumin excretion level and HD: • Group 1: include 15 patients were newly diagnosed T2DM with estimated glomerular filtration rate (eGFR) ≥90 mL/min/1.73 m2 and urinary albumin excretion level <30 mg/l (normoalbuminuria).• Group II: 15 patients had GFR between 60 – 89 mL/min/1.73m2, urinary albumin excretion between ≤ 30 to > 300 mg/l (microalbuminuria). • Group III: 15 patients had GFR < 15 mL/min/1.73m2, urinary albumin excretion level ≤ 300 mg/l, (macroalbuminuria) treated by regular HD and reeved erythropoietin. Excluded criteria: We excluded any cause that altered the level of total serum protein, serum albumin (chronic liver cell failure), or HbA1c (normocytic and macrocytic anemia) except proteinuria and HD. • Patients who had chronic liver diseases. • Patients with hematological malignancies. • Pregnancy.• Systemic steroid treatment. • Blood transfusion during the past 3 months.• Thyroidal disease.Comprehensive adult health history was taken and comprehensive physical examination was done for all studied groups. All studied participants were subjected to:• Complete blood picture.• Fasting blood glucose level.• Total cholesterol, serum low-density lipoprotein, and serum triglycerides.• Serum electrolytes. • Total serum protein & serum albumin • Aspartate Aminotransferase (AST (U/l) • Hepatitis B surface antigen. Hepatitis C antibody (by ELISA). • Serum creatinine (mg/dl)• eGFR (mL/min/1.73m2) • Albumin excretion rate in urine by using early morning urine sample (mg /l) (spot urine albumin sample). • HbA1c (%) • Serum glycated albumin (GA) (%)• Calculate the GA / HbA1c ratio
2.2. Methods
- Sampling collection:We obtained the clinical and demographic data for all T2DM patients from them at the time of admission. Venous blood samples (five ml) were taken from diabetic patients after overnight fasting. Each sample was divided into two parts: - Two ml were added to sterile EDTA vacutainer and centrifuged for 20 minutes at speed of 2000 – 3000 rmp. Then plasma was separated, aliquot and stored at -80°C for 7 days for the analysis of glycated albumin (GA). The plasma GA measurement will be described later.- Three ml were used for measured complete blood picture, serum albumin, total protein, serum creatinine, and other serum parameters. The urine sample was collected from early morning midstream urine, and then the albuminuria concentration measured in spot urine sample (mg/l). Determination of human glycated albumin:Human glycated albumin was detected by using Glory Science Co., Ltd ELISA KIT (for quantitative determination of human glycated albumin concentration). The reagent should be warmed at 37c for 30 minutes prior to using. Stander dilution was done by pipetting 50uL of standard diluent in each tube, then 100 ul (900umol/L) was pipetted in the first tube and 100 uL was taken out from the first tube into the second one. 50 ul from the second tube to the third one & serial dilution was done until the fifth tube & last 50 ul was discarded. Each concentration was repeated to give a mean value for each well.The concentration of tubes from the first to the last one as follow 900umol/L - 600 umol/L -400 umol/L -200 umol/L -100 umol/L -50 umol/L.Sample preparation: The blank well was separately seated without adding sample or conjugate, sample dilution was done by pipetting 40ul of sample diluent to the testing well, then adding 10 ul of the test sample in the well (five folds dilution). The well was incubated for 30 minutes after covering by an adhesive strip. Washing solution was prepared 30 fold with distilled water, after that the adhesive strip was removed and liquid was discarded, then washing buffer was pipetted to every well, and drain after 30 seconds, after five times of washing, 50 ul of conjugate reagent (HRP) added to each well, except blank well and incubated for 30 minutes after covering by adhesive strip, followed by another washing step, 50 ul of chromogen A & chromogen B was dispensed to each well & incubated for 15 minutes at 37°C, then stopped reaction was done by adding 50 ul of stop solution to each well, finally the absorbance was read on ELISA reader at wavelength 450 nm after 15 minutes from adding the stop solution. The absorbance was read against the blank. The standard curve was conducted using all the standard points.The detection range of the kit is 30umol/L -700umol/L.
2.2.1. The Calculation of GA% in the Plasma Sample
- GA value was calculated as a ratio (%) of GA in g/l to total albumin g/l (GA/albumin ratio) and corrected with inter-method arithmetic expression high- performance liquid chromatographic (HPLC method) [12]. GA% = [(GA / Albumin) x 100/ 1.14] + 2.9Statistical analysis:The data were collected, revised, coded and entered to the statistical package for social science (SPSS) version 17 using Chi-square test and or Fisher, independent t-test, Mann-Whitney test Pearson and Spearman correlation coefficient.
3. Results
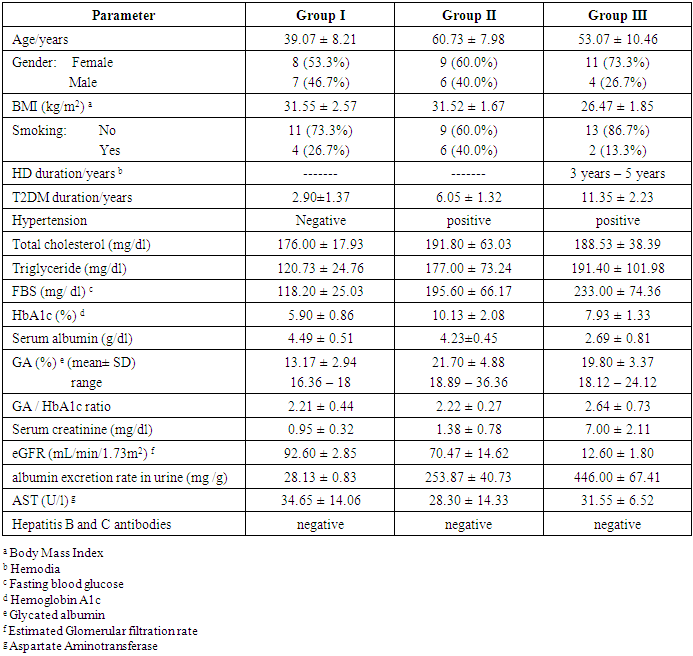
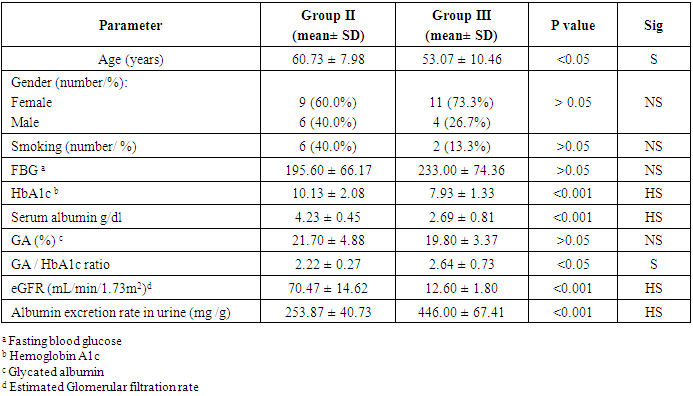
- Table (1) provides the baseline characteristics of the overall (45) study subjects, fifteen of them were early diagnosed as T2DM with normoalbuminuria (GI), they had the lowest levels of total cholesterol, triglyceride, FBS, HbA1c%, GA%, GA/ HbA1c ratio, serum creatinine, and albumin excretion rate in urine. The diagnosis of T2DM with microalbuminuria was made in another fifteen patients of them (GII), they had the highest levels of total cholesterol, HbA1c%, and GA%. The rest of patients were diagnosed as T2DM on regular HD with macroalbuminuria (GIII), they had the highest levels of triglyceride, FBS, GA/ HbA1c ratio, serum creatinine, and albumin excretion rate in urine, but had the lowest levels of serum albumin and eGFR.
|
|
|
|
4. Discussion
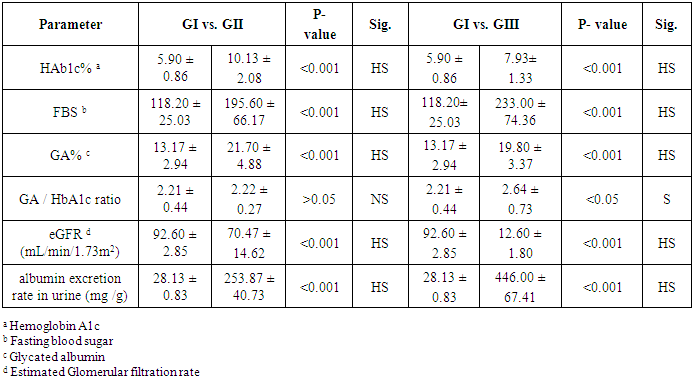
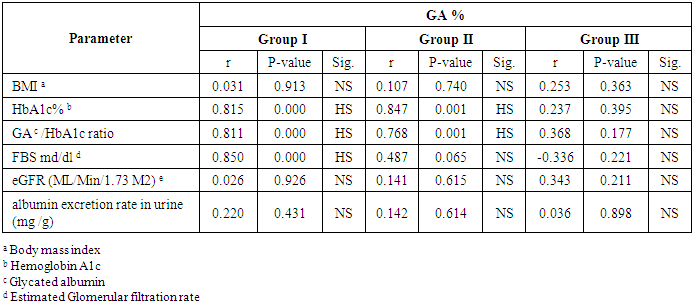
- Many authors demonstrated previously that the HbA1c does not reflect the actual glycemic state in diabetic patients on HD [7]. GA is a promising marker reflecting short-term glycemic control [1] but there is a limited data concerning it as a glycemic marker in T2DM patients with macroalbuminuria on HD or microalbuminuria. So there is a need to find a marker can reflect the glycemic control among them and predict the development of microalbuminuria. The result of the current study reported that there was a significantly lower value of HbA1c in macroalbuminuric T2DM on HD who treated by erythropoietin in comparison to patients with T2DM and microalbuminuria regardless fasting blood glucose level which was a significantly elevated in macroalbuminuric T2DM on HD than in T2DM who had microalbuminuria. This result is consistent with the finding of Gan et al 2018 [3], who founded the HbAlc levels appear to be lower and inaccurately reflect the glycemic conditions in advance CKD on diabetics, leading to underestimation of hyperglycemia. Also, Inaba et al. 2007 [13], reported that HbA1c readings can be falsely low among Japanese patients with T2DM in HD who treated with erythropoietin. Furthermore, we reported a significant elevation of HbA1c% on microalbuminuric diabetics in comparison to normoalbuminuric diabetics. This result was similar to the finding of Kundu and co-workers [14], who showed a significant increase in HbA1c levels in the diabetics patients with microalbuminuria group when compared to diabetes without any complication. Additionally, among T2DM patients, the risk of microalbuminuria was closely related to HbA1c [15].According to the explanation provided by several studies [8], the decrease of HbA1c level in patients with CKD on HD has been mainly attributed to, the RBC lifespan is significantly reduced with 20-50% even when erythropoietin administered [16], increased rate of hemoglobin turnover leads to decreased exposure time to ambient glucose [17] and glycation rate of Hb also influenced by metabolic acidosis [18]. Thus, the HbA1c level was lower in HD diabetics than would be expected from measured glucose. This result suggested that the HbA1c formation was reduced in diabetic HD despite elevating blood glucose level.In our study, we found the GA% lowest level among T2DM patients (all studied group) was 16.36% which exceed the normal maximum reference level (the reference range of GA%: 11.9–15.80%) [19], so the GA% was elevated above the normal range in all T2DM patients in our study. This result in accordance with several studies who found GA accurately reflects changes in plasma glucose in diabetics [20, 21]. Moreover, the GA is more suitable marker to monitor the beginning of drug therapy in DM [22], and also to control the dose and change of diabetic medication [23], Peroni et al. [24], evidenced that GA was a better marker to evaluate the response to treatment with insulin in T2DM patients with inadequate glycemic control. Also, Wu et al study [25], revealed that GA can be measured accurately in plasma or serum samples and in samples from non-fasting subjects so that we can use of GA alone to screen for diabetes inconvenient for diabetic patients. Additionally, our study noticed that there was a significant elevation of GA% and fasting blood glucose level in T2DM who had microalbuminuria in comparison to patients with T2DM and normoalbuminuria. This result is in agreement with many studies who showed that there is a significant increase in GA% of the diabetic patients with microalbuminuria compared to diabetic patients with normal albuminuria [26] [27]. We also reported a non-significantly decrease of GA% in T2DM who had macroalbuminuria in comparison to T2DM who had microalbuminuria, and there was no correlation between the GA% and the level of urinary albumin excretion or eGFR in our study but there was a positive correlation between GA% and fasting blood sugar according to normoalbuminuria and microalbuminuria, but no correlation according to macroalbuminuria, it means the GA% was accurately index for hyperglycemia in the early T2DM and in early diabetic nephropathy (microalbuminuria) but slightly less accurate (no statistically difference) in advance stage of diabetic nephropathy (macroalbuminuria). This can be explained by, in the patients with massive proteinuria, GA levels are lower in relation to glucose levels probably because of increased catabolism of serum albumin [20].On the other hand, some studies found a statistically significant relationship between the degree of albuminuria and altered GA levels so they reported that the GA acts as a marker for glycation and complications of diabetes [27]. Furthermore, GA is predictive for microvascular complications in type 1 and type 2 DM. However, as regarding macrovascular outcome, GA seems to be a good marker only in type 2 DM [28]. This is because the glycation of albumin induced several conformational changes in its structure that can also change its antioxidant property and increase oxidative state in diabetic patients. Because of this deformity, the oxidative state may have increased in diabetic patients, especially with CKD, and GA could not provide its specific duty towards the biological system and may be involved in the pathogenesis of diabetes and its chronic complications [29].In regard to GA and HbA1c ratio, we found a significant increase of ratio in T2DM patients on HD than in a normoalbuminuric T2DM group and also in the microalbuminuric T2DM group but no significant difference in ratio when compared between normoalbuminuric T2DM and microalbuminuric T2DM group. Based on this result the GA to HbA1c ratio may be a predictor of macroalbuminuria in advanced stage diabetic nephropathy. Another study found that the GA/HbA1c ratio was associated with diabetic retinopathy, but not with diabetic nephropathy in patients with T 2 DM and these results suggest that the development and progression of diabetic retinopathy are associated with plasma glucose fluctuations [30]. But the diabetic nephropathy group showed significantly higher GA: HbA1c values compared with the non – diabetic nephropathy group and it may be superior to HbA1c associated with the presence of diabetic nephropathy [31]. On the other hand, a study by Hirata et al reported that GA to HbA1c ratios can be a good predictor of glycemic control in the presence of diabetic nephropathy due to its close relationship between glucose levels after meals and pancreatic beta cell secretory function [32].
5. Conclusions
- In this study, we examined the role of GA% and GA/HbA1c ratio in the evaluation of glycemic state in T2DM patients on regular HD and treated by erythropoietin, and to predict the development of microalbuminuria among T2DM patients to improve the quality of their life. As the mentioned above, calculation of GA% can use as a marker to assess the glycemic state in type 2 diabetes mellitus with normal albumin excretion in urine or in the cases with microalbuminuria. Also, GA% can predict the development of microalbuminuria in type 2 diabetes mellitus, but the calculation of GA% in diabetic HD patients with macroalbuminuria is less accurate. GA/HbA1c ratio can be considered as a marker of development of macroalbuminuria in T2DM, but not reflects the glucose level in diabetic HD.
6. Recommendations
- FBS is the more accurate test for assessment the glycaemic state in diabetic HD patients. But the GA% can used in the diagnosis, in the follow up of the treatment, and can indicate the early renal affection in T2DM.