-
Paper Information
- Paper Submission
-
Journal Information
- About This Journal
- Editorial Board
- Current Issue
- Archive
- Author Guidelines
- Contact Us
International Journal of Diabetes Research
p-ISSN: 2163-1638 e-ISSN: 2163-1646
2018; 7(1): 18-22
doi:10.5923/j.diabetes.20180701.03

Additional Water Intake after Meal Reduced 2-h Postprandial Blood Glucose Level in Healthy Subjects
 Abstract
 Reference
 Full-Text PDF
 Full-text HTML
Vanessa Yolanda, Lina Antono, Astri Kurniati
Nutrifood Research Center, PT. Nutrifood Indonesia, Jakarta, Indonesia
Correspondence to: Lina Antono, Nutrifood Research Center, PT. Nutrifood Indonesia, Jakarta, Indonesia.
| Email: |  |
Copyright © 2018 Scientific & Academic Publishing. All Rights Reserved.
This work is licensed under the Creative Commons Attribution International License (CC BY).
http://creativecommons.org/licenses/by/4.0/

Plain water intake was found to be inversely related to the risk of hyperglycemia and diabetes in observational studies. However, controlled studies on the short term effect of additional water intake after a meal on post-prandial glycemic response were still limited with conflicting results due to high variability of the treatments. Therefore, this study aims to verify the effect of plain water consumed within 2 hours after a liquid or solid meal in 2-h postprandial blood sugar levels of healthy subjects. Twenty non-diabetic subjects participated in this randomized crossover study. Two types of meals were tested, liquid meals (dextrose monohydrate diluted in water) and solid meals (white bread). In both sample types, 250 ml of water was given to the control group while 250 ml plus 450 ml additional water (divided in 3 time points) was given to the experimental group. All samples provided 50 grams of available carbohydrate and were tested in 4 different test days. Blood glucose levels were measured every 15 minutes for the first hour and every 30 minutes for the second hour. Incremental area under the blood glucose response curves (IAUC) were then calculated geometrically using the trapezoid rule. It was observed that additional 450 ml plain water consumed within 2 hours after a meal was related with a significantly lower blood glucose level at 120 minutes (p<0.05) in both liquid and solid samples. However, no other significant differences were observed in other time points. In addition, consuming more water after a meal resulted in lower incremental changes in blood glucose concentrations (IAUC) but the differences were not statistically significant (p>0.05). This study suggested that additional water intake consumed gradually after a meal could influence 2-h postprandial blood glucose level in healthy subjects. The result indicated how increasing water intake could be a simple dietary modification to slightly improve glycemic response, combined with healthy diet and exercise. Further studies measuring insulin response and vasopressin level would be able to explain the mechanism better.
Keywords: Water intake, Glycemic response, Blood glucose, Healthy subjects
Cite this paper: Vanessa Yolanda, Lina Antono, Astri Kurniati, Additional Water Intake after Meal Reduced 2-h Postprandial Blood Glucose Level in Healthy Subjects, International Journal of Diabetes Research, Vol. 7 No. 1, 2018, pp. 18-22. doi: 10.5923/j.diabetes.20180701.03.
Article Outline
1. Introduction
- The importance of water intake in maintaining general metabolic function is already well known, one of which appears to be related to glycemic response. Several researchers found that plain water intake might play a role in preventing diabetes. Plain water intake was found to be inversely related in diabetes risk score [1] and hyperglycemia risk [2]. Another study also observed how higher plain water intake was related to a lower risk to develop high HbA1c level in men [3].However, all of these studies which indicated that plain water intake might be beneficial in maintaining glycemic response are observational studies with longer study period. Some studies did learn the short term effect of additional water after a meal to post-prandial glycemic response. However, existing studies produced inconsistent results due to differences in subject characteristics and protocols. Two studies showed that additional water after a meal increased blood sugar response [3, 4]. Another study by Young et al. (1998) observed the effect of additional water intake resembled to the shape of the inverted U-curve. Increasing water intake after a meal until 750 ml was observed to increase post-prandial blood sugar response but higher volume resulted in opposite effect. It was observed that consumption of 1000 ml of water lowered the blood sugar response [5] However, another study by Gregersen et al. showed that consumption of 90 ml and 600 ml water post-meal did not cause any differences in glycemic response [6]. Maintaining glycemic response after a meal is important to prevent sudden increase in blood sugar level, especially for diabetic patients. If water intake did influence post prandial blood glucose level, modifying water intake after a meal would be a simple yet effective suggestion to maintain glycemic response after a meal. Therefore, this study aimed to study the influence of water intake after meal consumption, both solid and liquid form, on the 2-h postprandial blood sugar level. Water consumption in this study could better represent regular habit as water was consumed at several time points after the meal and the amount of water given was predetermined according to the average amount of water which was normally consumed within 2 hours after a meal.
2. Methodology
2.1. Subjects
- Twenty subjects participated in this randomized cross-over study occurring from October-December 2015. Subjects were recruited with the following criteria: 20-40 years of age with normal fasting blood sugar levels (70-99 mg/dL). Subjects who were pregnant or breastfeeding, intolerant or allergic to the samples, or had any medical condition were excluded from the study [7, 8]. Each subject received a complete explanation of the study and gave informed written consent before the study started. This study has been approved by Institute of Research Ethics Committee Atma Jaya Catholic University of Indonesia (No 1051/III/LPPM-PM. 10.05/09/2015).
2.2. Samples
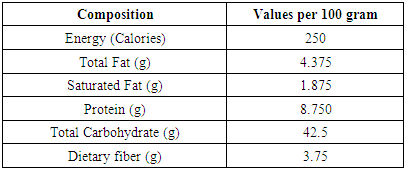
- In this study, 2 types of meals, liquid and solid meals, were tested. Each type of meals contained 2 groups of samples (control and treatment) and all were tested in 4 different testing days. Control in the liquid meal (LM1) was sugar solution prepared by diluting 50 grams of dextrose monohydrate (Cargill, USA) into 250 ml water while control for solid meal (SM1) was 129 grams of white breads (Sari Roti, Indonesia) and 250 ml water. For the treatment groups, 450 ml additional water was provided for the subjects following consumption of the meals. All samples provided 50 grams of available carbohydrate and were served at room temperature. Table 1 showed nutrition information of the white bread.
|
2.3. Study Design
- All subjects finished all 4 test sessions within a month period. During the test period, subjects were instructed to maintain the same diet and exercise pattern. Each testing days was separated for a minimum of 3 days and all tests were performed in a randomized order as determined using Microsoft Excel 2016 (Microsoft Corporation, USA).For each testing days, subjects were instructed to arrive at the test area at 08:00-09:00 a.m. after an overnight fast. Subjects were also instructed not to consume alcohol nor to smoke on the previous day of each test. To ensure that these instructions were followed, participants were routinely reminded via electronic mail and text message before each session [7, 8].In this study, finger prick blood glucose level was measured using AccuChek Performa instrument (Roche Diagnostics, Mannheim, Germany). Approximately 0.6 microliter of blood is required to run the blood glucose test. After fasting blood glucose measurement, one of the 4 samples was given in random order to the subjects with the instruction to finish it within 5-10 minutes for liquid meals (LM1 and LM2) or 10-15 minutes for solid meals (SM1 and SM2). The first bite or sip was set as the starting time point (0 min) and the next blood samples were taken at 15, 30, 45, 60, 90 and 120 minutes afterwards. Subjects were prohibited to consume any additional foods or drinks during the 2-hour test period, except plain water which was provided according to each treatment groups. Additional 150 ml plain water was given at 40, 75, and 105 minutes, resulting in a total of 450 ml water. Subjects also remained in the testing area during the test period and physical activity was minimal. Figure 1 described a more detailed protocol of the study.
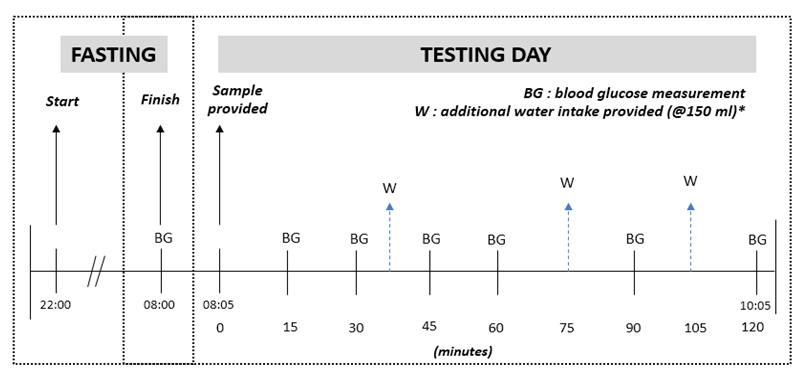 | Figure 1. A detailed protocol performed on each testing day (*additional water was only given to the treatment groups) |
2.4. Statisical Power and Statistical Analysis
- Another study on glycemic response indicated that a minimum of 10 subjects were needed to achieve 80% power to detect differences in glycemic response of about 20% in the incremental areas under the glucose response curves (IAUCs) above the fasting level between the foods. This calculation assumed a variation of 22% within subjects [9]. Blood glucose concentration at each time point were plotted in a graph and the incremental area under the blood glucose response curves (IAUC) were calculated geometrically using the trapezoid rule. Results were expressed as means ± SD. Statistical analyses were performed using SPSS 16.0 (SPSS, Chicago, IL, USA). The effect of treatment and time in each sample type (control versus experimental group) on incremental changes in blood glucose concentrations (IAUC) were analysed using the repeated measures 2-way analysis of variance (ANOVA). This same analysis was performed to analyse the effect of sample type (solid versus liquid samples) and time on the same parameter. Within the solid samples group and liquid samples group, differences of IAUC and blood glucose concentrations at each measurement points were assessed using Student's t-test. In all cases, a p-value <0.05 was considered as statistically significant.
3. Results
3.1. Subjects Characteristics
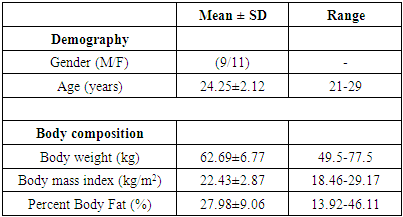
- In total, 20 non-diabetic subjects completed the study. All of the subjects finished the samples according to the given instructions and tolerated the study well. Baseline characteristics of the participants are presented in Table 2. Mean age of subjects was 24.25 ± 2.12 years old and the mean BMI was 22.43 ± 2.87 kg/m2.
|
3.2. Changes in Blood Glucose Level
- Table 3 showed fasting blood glucose concentrations and blood glucose level changes that occurred during the 120-min period after consuming the samples. There were no significant differences in fasting blood glucose concentration between subjects before consuming all samples in both liquid and solid groups.
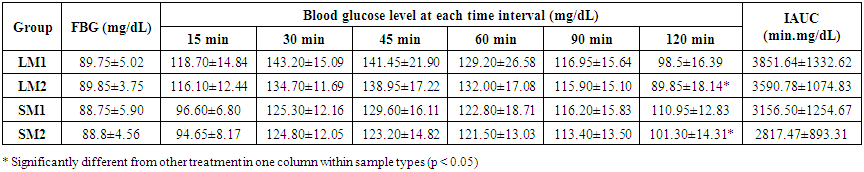 | Table 3. Blood Glucose Level at Each Time Interval and IAUC in Each Treatments  |
4. Discussions
- Even though drinking enough water is a simple and inexpensive dietary recommendation, not many people concern about it. This is concerning as the function of water in normal metabolic function has been well known. In addition, result of this study implied how enough hydration after meal consumption might give a slight beneficial effect in maintaining glycemic response. In both solid and liquid samples, additional 450 ml plain water consumed within 2 hours after a meal was related with significantly lower blood glucose level at 120 minutes. Glycemic response as measured by IAUC was also slightly lower in groups given additional 450 ml plain water after consuming the samples, although no statistically significant difference was observed.The mechanism by which water reduces postprandial glycemic response may be explained as following explanation. First, the presence of water might increase the cellular metabolism and thus blood sugar level could decrease faster, along with its roles in nutrient transportation and hydrolysis. Second, additional water intake is proposed to increase blood volume which give a dilution effect on the concentration of glucose (mg/dl) [2]. In addition, several studies showed how hydration was associated with the risk of type 2 diabetes by affecting the secretion of arginine vasopressin, the anti-diuretic hormone [2, 10]. The association between arginine vasopressin, hydration status and glucose intolerance has been demonstrated in animal studies. When rats were not well hydrated, arginine vasopressin level will elevate and thus leading to higher fasting glycemic response in lean rats and hyperinsulinemia and glucose intolerance in obese rats. Moreover, several observational studies in human showed how the risk for hyperglycemia was negatively and independently related with self-reported water intake in non-diabetic middle-aged individuals [2, 3, 10, 11].However, our findings are in contrast with several previous studies which studied the short term effect of additional water after meal intake. These studies showed that water may amplify postprandial glycemic response. However, subjects involved in previous studies were diabetic patients while our subjects were healthy with normal fasting blood glucose level. This different subject characteristic could partly explain differences in the results obtained. Moreover, additional water in other studies was given at onetime point [4, 6] while additional water in this study was given gradually at several time points after subjects finished the meals. This condition was chosen as it could better represent the actual behavior after finishing meals. This current study does have several limitations. Only healthy subjects were involved in this study. In addition, only blood glucose levels were measured while insulin response and vasopressin level, which has been proposed to be related to glycemic response, were not measured. Further study with more subjects, involving healthy and diabetic subjects, with insulin response and vasopressin measurements could better explained the mechanism on how water intake could influence post-prandial glycemic response in both healthy and diabetic subjects. Nevertheless, this study makes an important contribution to the limited literature on effect of addition water intake to post-prandial glycemic response. These findings are valuable because increasing water intake after a meal could be a simple and inexpensive dietary modification to maintain post-prandial glycemic response, of course without neglecting the importance of healthy diet and physical activity. Moreover, it also emphasized how drinking water might have an effect on the result of blood glucose measurement.
5. Conclusions
- From this experimental study, it is evident that additional 450 ml water consumed gradually within 2 hours after a meal was related to a decrease in postprandial blood glucose level at 120 minutes. This phenomenon was observed after consuming both liquid and solid meal. A decrease in glycemic response as measured by IAUC was also observed, but this difference was not statistically significant. Further investigations on insulin response and vasopressin level are required to understand further mechanism.
ACKNOWLEDGEMENTS
- The study was funded by PT. Nutrifood Indonesia.