-
Paper Information
- Paper Submission
-
Journal Information
- About This Journal
- Editorial Board
- Current Issue
- Archive
- Author Guidelines
- Contact Us
International Journal of Diabetes Research
p-ISSN: 2163-1638 e-ISSN: 2163-1646
2017; 6(4): 83-90
doi:10.5923/j.diabetes.20170604.02

Insufficient Sleep is a Contributor to Overweight and Type 2 Diabetes in Adults: Any Contribution from Caffeine?
 Abstract
 Reference
 Full-Text PDF
 Full-text HTML
Douaa Khawla1, Houda Rima1, Fatina Sleiman2, Mohamad Al-Iskandarani3, Mohamad Koubar3, Maha Hoteit1
1Department of Nutrition and Dietetics, Faculty of Public Health-I, Lebanese University, Beirut, Lebanon
2Department of Nursing, Faculty of Public Health-I, Lebanese University, Beirut, Lebanon
3Department of Laboratory Science, Faculty of Public Health-I, Lebanese University, Beirut, Lebanon
Correspondence to: Maha Hoteit, Department of Nutrition and Dietetics, Faculty of Public Health-I, Lebanese University, Beirut, Lebanon.
| Email: |  |
Copyright © 2017 Scientific & Academic Publishing. All Rights Reserved.
This work is licensed under the Creative Commons Attribution International License (CC BY).
http://creativecommons.org/licenses/by/4.0/

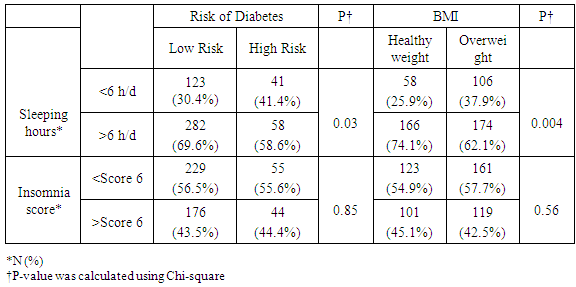
Objective: To test if sleep insufficiency has a direct impact on being overweight and the 10 years-risk of developing type 2 diabetes in non-diabetic adults. Also to test if there is any possible impact of caffeine consumption on the occurrence of type 2 diabetes in the same population. Research Design and Method: We conducted a cross-sectional study on 504 non-diabetic participants, aged between 18 and 64 years. This study took place in North Lebanon between December 2016 and June 2017. Study subjects completed a self-administered questionnaire concerning sleep duration and sleep quality using the Athens Insomnia Scale (AIS) and the 10 years risk of developing type 2 diabetes using the American Diabetes Association Questionnaire. In addition, the participants underwent later on a full analysis of their body fatness, body muscles percentages and their resting energy expenditure (REE). Results: Sleep duration of more than 6 hours per day is associated with the lowest risk of developing diabetes and overweight (p=0.03 and p=0.004) respectively. This was observed in women (p<0.001 and p=0.003 respectively) but not in men. When stratifying our data by gender and according to the Body Mass Index (BMI) cutoff classification, we observed that women with healthy body weight (BMI<25 Kg/m2) and those having a slight obesity, and who both sleep more than 6 hours per day, do not present a risk of developing type 2 diabetes (p=0.03 and p=0.089 respectively). However, as measured by the Athens Insomnia Scale, Insomnia was not associated with nor diabetes type 2 neither obesity (p=0.859 and p=0.871 respectively). No association was found when splitting this data by gender. Using binary logistic regression, the subjects who sleep more than 6 hours per day have 0.61 times less risk of developing diabetes compared to those who sleep less than 6 hours per day (0.61 and 95% CI [0.39-0.97]). However, when testing the association between Insomnia and the risk of developing type 2 diabetes in 10 years, no association was found (1 and 95% CI [0.66-1.62]). Despite being a stimulator factor, caffeine, in our study, shows that subjects who drink caffeine had 3.6 times lower risk of developing type 2 diabetes compared to non-drinkers (3.6 and 95% CI [1.5-3.6]). This association was so strong in women (0.3 and 95% CI [0.24-0.63]) compared to men. Conclusion: Based on our study results, we conclude that sleeping duration of 6 hours per day or more could be a protective factor against developing diabetes and overweight mainly in women. Also, caffeine consumption is a must to prevent the high risk of developing type 2 diabetes in women, but in the right time to avoid sleep insufficiency.
Keywords: Insomnia, Sleeping hours, Obesity, Diabetes, Adults, Caffeine
Cite this paper: Douaa Khawla, Houda Rima, Fatina Sleiman, Mohamad Al-Iskandarani, Mohamad Koubar, Maha Hoteit, Insufficient Sleep is a Contributor to Overweight and Type 2 Diabetes in Adults: Any Contribution from Caffeine?, International Journal of Diabetes Research, Vol. 6 No. 4, 2017, pp. 83-90. doi: 10.5923/j.diabetes.20170604.02.
Article Outline
1. Introduction
- According to the International Diabetes Federation, 415 million adults have type 2 diabetes in the world and the estimated number of diabetic patients worldwide will rise to 642 million by 2040 [1].Diabetes was responsible for 342,000 deaths in 2015 in the Middle Eastern Region [2]. Over half (51.3%) of all deaths from diabetes in the region occurred in people under 60. These early deaths may be the result of a combination of factors: the rapidly changing environments and lifestyles in the region, late diagnoses and health systems that are not equipped to provide optimal management to the increasing numbers of people with diabetes [2]. Countries with high type 2 diabetes prevalence include Saudi Arabia (raw diabetes prevalence of 17.6%) and Kuwait (14.3%). Due to their different population structures, these countries both have an age-adjusted comparative prevalence of 20%. The countries with the largest number of adults with diabetes are Egypt (7.8 [3.8-9.0] million), Pakistan (7.0 [5.1-10.0 million) and Iran (4.6 [3.6-6.3] million) [2]. In Lebanon, till today, 464,200 adults is the number of diabetic where 41.2% were undiagnosed. Overall estimation of the prevalence in Lebanon shows that 1 in 8 Lebanese adults have diabetes [3]. Sleeping is essential in many physical, cognitive, and psychological processes and an optimal sleeping condition appears to be a health imperative [4].A recent meta-analysis of prospective studies have provided facts of U-shaped relationship between sleep duration and a higher incidence of type 2 diabetes, the most frequent consequence of obesity, with both short and long sleep duration associated with greater risk [5-7]. The mechanisms underlying the sleep-diabetes relationship remain unsettled. Prior studies have shown that short sleep is related to the mechanism of glucose intolerance, insulin resistance, and reduced acute insulin response to glucose [8].Because of the lack of clinical trials and surveys in this field, the objective of this study was to assess, retrospectively, the temporal relationship between sleep adequacy and type 2 diabetes and overweight.
2. Research Design and Methodology
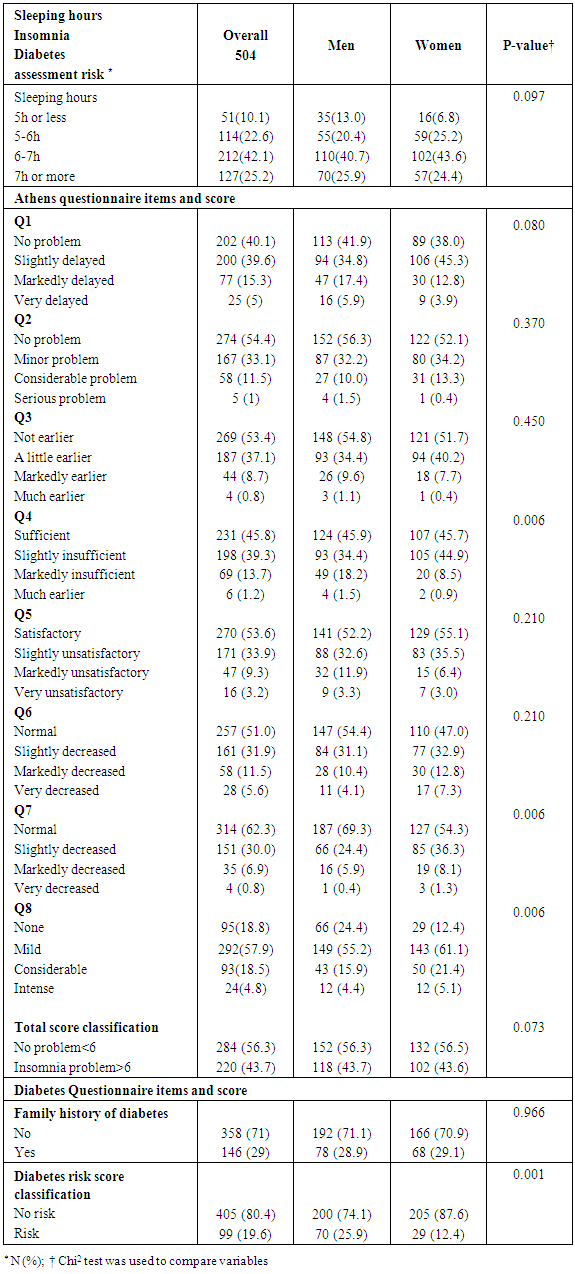
- This is a cross-sectional study that took place in Lebanon, mainly in North Lebanon between December 2016 and June 2017. We contacted a total of 504 non-diabetic participants (234 women and 270 men), aged between 18-64 years who filled a self-administered questionnaires that included information on socio-demographic status, education, sleep duration/quality, medical history, family history, lifestyle, risk factors and working conditions. In order to investigate the sleep adequacy and insomnia in these participants, the Athens Insomnia Scale (AIS) was used (see Appendix 1). As well as, in order to investigate the 10 years-risk assessment of type 2 diabetes, the American Diabetes Association Questionnaire (see Appendix 2) was filled with these participants. All participants were not diabetic, nor having any other chronic diseases. Diabetes in this study was defined as taking medications for treating diabetes, or laboratory test values (fasting blood sugar and HbA1c) indicating the medical occurrence of type 2 diabetes after a final reporting from an endocrinologist. Information about sleep duration was assessed by the question: “How long on average, in hours and minutes, do you normally sleep?” It was categorized into ≤ 5, 5–6; 6–7, and >7h. The Athens Insomnia Scale (AIS) was used to assess sleep quality, the consistency, reliability, and validity of which has been ascertained as a screening or diagnosis tool for insomnia and it consists of eight items: the first five of which pertain to sleep induction, awakening during the night, final awakening earlier than desired, total sleep duration (not quantity but perceived sufficiency), and overall quality of sleep (sleep satisfaction); the subsequent three items refer to the sense of well-being, functioning, and sleeping during the day. Participants will be requested to score on a scale of 0–3, with a score of 0 signifying no problem at all, a score of 1 signifying a minor or slight problem, a score of 2 signifying marked or considerable problems, and a score of 3 signifying serious problems or being unable to sleep at all. Answers were based on any sleep difficulties participants may have experienced at least three times a week during the previous month. For the analyses, a higher score expressed a more aggravated sleep quality. The type 2 diabetes risk test was used to indicate whether the participant is at risk of developing type 2 diabetes in the coming 10 years or not and it consists of seven items: age, gender, gestational diabetes, family history of diabetes, blood pressure, physical activity and body mass index. Participants were requested to score on a scale from 0 to 3 points. For the analysis, if the score was 5 or higher, the participant is considered at increased risk for having type 2 diabetes. A full body analysis of fat and muscles was performed for participants using an impedance body composition analyzer machine that show numerical values of weight, body mass index, percentage of body fat, percentage of visceral fat, body water, muscle mass and resting energy expenditure (REE).
3. Statistical Analyses
- All statistical analyses were performed using the SPSS software (Version 22). For descriptive statistics, basic information was expressed as percentage, means, and standard deviation. The chi-square test was used to investigate the relationship between the dependent variable (Insomnia, sleep duration, Type II Diabetes risk) and each independent variable. Furthermore a binary logistic regression was used to calculate the odd ratio values of the dependent variable in the multivariate analysis after adjustment of confounders. A significance level of α=0.05 was used.
4. Results
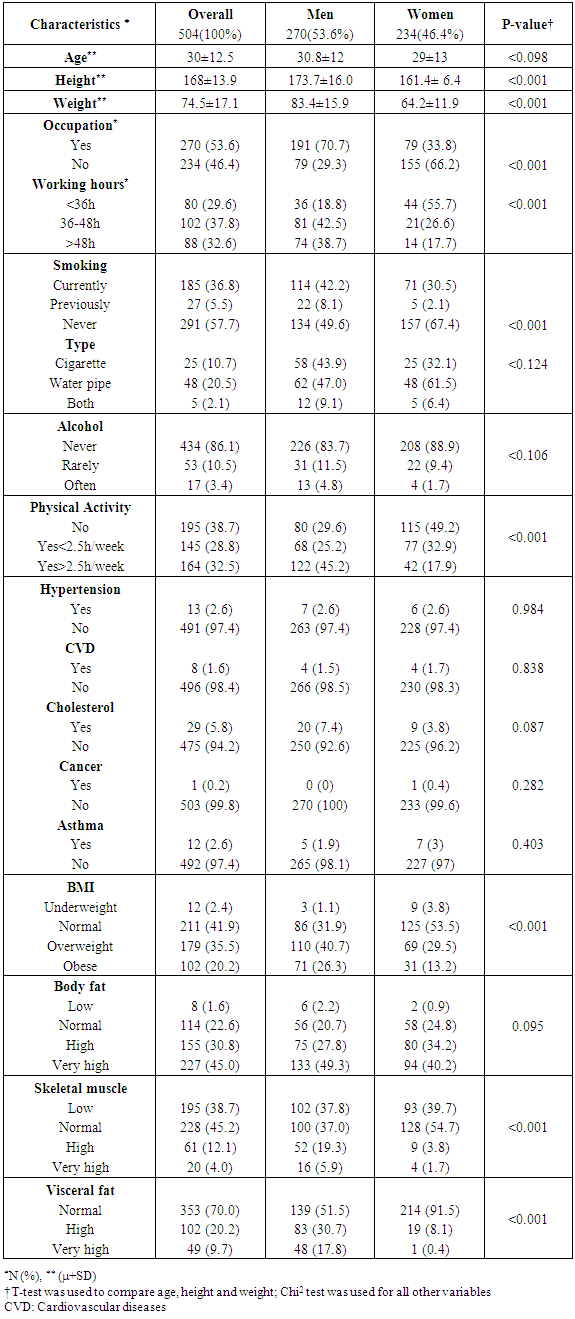
- The total number of participants is 504 adults where 54% were men. The mean age of our population was 30± 13 years old. 37% of our population was smoker and more than 50% smokes water pipe. All characteristics of the study participants are summarized in Table 1.
|
|
|
|
5. Discussion
- Insufficient sleep is considered a risk factor for weight gain and development of type 2 diabetes. We showed in this study that people who sleep more than 6 hours per day were more protected against weight gain and type 2 diabetes than people who sleep less than 6 hours per day. In addition a decrease in the REE was observed when there is a lack of sleep in participants. This decrease in REE develops overweight and type 2 diabetes consequently. Our results came hand in hand with many experimental studies as reported by a summary report of Chaput et al in 2012 [9]. These experimental studies summarized that two consecutive nights of sleep deprivation to 4 h instead of 10 h decreased by 18% the circulating concentrations of the anorexigenic hormone leptin and a 28% increase in the concentrations of the orexigenic hormone ghrelin in conjunction with increased sensations of hunger and appetite [10]. Other studies discussed the effect of sleep deprivation on energy intake summarizing the possible mechanism by the fact that inadequate sleep has been reported in some studies to decrease leptin levels, increase ghrelin level and cortisol levels, alter glucose homeostasis, and activate the orexin system [11].In addition, the temporal release of the counter-regulatory hormones growth hormone (GH) and cortisol as well as the release of hormones that play a major role in appetite regulation, such as leptin and ghrelin, is partly dependent on sleep timing, duration and quality. Glucose tolerance and insulin secretion are also markedly modulated by the sleep-wake cycle [12].However, our results are contradicted by the study published by Markwald et al, who showed that in 16 adults for a 14- to 15-d-long that insufficient sleep increased total daily energy expenditure by ∼5% and insufficient sleep led to a weight gain of 0.82 ±0.47 kg (±SD) weight gain despite changes in hunger and satiety hormones ghrelin and leptin, and peptide YY, which signaled excess energy stores [13]. Subsequent study examined appetite regulation after 2 nights of 4 h in bed and after 2 nights of 10 h in bed, in a randomized cross-over design. This study confirmed the decrease in leptin levels seen in the previous study, with a 18% decrease of leptin levels after the short nights relative to the long nights. Furthermore, ghrelin was assayed and showed a 28% increase after the 2 nights of 4 h in bed. Appetite for high carbohydrate nutrients was the most affected with a 32% increase [14]. Importantly, the subjective report of increased hunger was correlated with the increase in ghrelin to leptin ratio [15]. An important observation was reported by Spiegel et al [16] concerning the effect of sleep deprivation on metabolic and endocrine function that overall leptin levels, evening cortisol levels, and the HOMA response to breakfast varied in a dose-response relationship with sleep duration. Shorter sleep duration was associated with greater disturbances in these hormonal and metabolic variables. Leptin levels were lowest when the subjects were in a state of sleep debt, signaling the brain an unnecessary need for extra caloric intake. Evening cortisol levels were highest when the subjects were in a state of sleep debt. A state of sleep debt therefore appears to delay the normal return to low levels of corticotropic activity [15]. HOMA levels post-breakfast were the highest in a state of sleep debt indicating a decrease in glucose tolerance and/or a decrease in insulin sensitivity. The 24-hour Growth hormone (GH) profiles in the 8- and 12-hour bedtime conditions were qualitatively similar, with a trend for lower post-sleep peak values in the extended bedtime that is consistent with a reduced homeostatic drive for sleep with the decreased duration of the wake period [15]. In the state of sleep debt, a GH pulse prior to sleep onset was observed, in addition to the normal post-sleep onset GH pulse. The elevation of GH concentrations during waking could have an adverse impact on glucose metabolism [15]. Concerning Caffeine consumption, our study results show that subjects who drink caffeine had 3.6 times lower risk of developing diabetes compared to non-drinkers (3.6 and 95% CI [1.5-3.6]). This result is parallel to a meta-analysis of 28 prospective studies on 1,109,272 study participants and 45,335 cases of type 2 diabetes, published by Ding et al [17] who showed that Coffee consumption was inversely associated with the risk of type 2 diabetes in a dose-response manner. Both caffeinated and decaffeinated coffee was associated with reduced diabetes risk. Another meta-analysis of 42 studies on more than 1,091,000 persons with or without diabetes shows that the association of coffee, decaffeinated coffee and caffeine intake with type 2 diabetes incidence was stronger for women than that for men. Dose-response analysis suggested that incidence of type 2 diabetes decreased by 12% [0.88 (0.86-0.90)] for every 2 cups/day increment in coffee intake, 11% [0.89 (0.82-0.98)] for every 2 cups/day increment in decaffeinated coffee intake and 14% [0.86 (0.82-0.91)] for every 200 mg/day increment in caffeine intake [18]. First, coffee contains compounds that are antioxidants [19] which may be related to the risk of diabetes because the oxidative stress may be a pathogenic mechanism linking insulin resistance with dysfunction of both beta cells and endothelium [20]. Second, phenol chlorogenic acid and its degradation products (quinides) in coffee contribute to inhibition of glucose absorption in the intestine, reducing hepatic glucose output through inhibition of glucose-6-phosphatase [21]. Third, caffeine may also contribute to the inverse association between coffee and diabetes through increasing of basal energy expenditure stimulating fat oxidation and mobilization of glycogen in muscle, and weight loss [22]. Caffeine has also been related to acute decrease of insulin sensitivity, although prolonged use of caffeine may result in tolerance for such acute effect [23]. Finally, other components in coffee such as magnesium have been associated with a lower risk for type 2 diabetes [24]. Potential limitations of our study include the lack of data that could assist in managing this study prospectively. We considered a study design of cross sectional a non-conclusive study that cold only explain possible relation between both variables (sleep quality and type 2 diabetes or overweight) but it cannot confirm. Thus, further prospective studies are needed to confirm this relation.
6. Conclusions
- This study suggests that sleep disturbances, including insufficient sleep due to bedtime curtailment and poor sleep quality, may represent novel risk factors for obesity and type 2 diabetes. While laboratory studies have been conducted in adults only, a large number of epidemiologic studies in pediatric populations should be well elaborated to decrease the rate of obesity worldwide.
ACKNOWLEDGEMENTS
- The authors would like to acknowledge all study participants. Also, the authors would like to acknowledge the assistance of Mrs. Sarine El Daouk in the statistical management of this study.