-
Paper Information
- Previous Paper
- Paper Submission
-
Journal Information
- About This Journal
- Editorial Board
- Current Issue
- Archive
- Author Guidelines
- Contact Us
International Journal of Diabetes Research
p-ISSN: 2163-1638 e-ISSN: 2163-1646
2017; 6(3): 54-62
doi:10.5923/j.diabetes.20170603.02

Sensory Evaluation of Sweet Taste and Daily Sugar Intake in Normoglycemic Individuals with and without Family History of Type 2 Diabetes: A Comparative Cross-sectional Study
Vanessa Yolanda, Lina Antono, Astri Kurniati
Nutrition and Health Science Department, Nutrifood Research Center, Jakarta, Indonesia
Correspondence to: Lina Antono, Nutrition and Health Science Department, Nutrifood Research Center, Jakarta, Indonesia.
| Email: |  |
Copyright © 2017 Scientific & Academic Publishing. All Rights Reserved.
This work is licensed under the Creative Commons Attribution International License (CC BY).
http://creativecommons.org/licenses/by/4.0/

Previous studies found that diabetics patients were less sensitive towards sweet taste compared to healthy subjects. However, studies examining taste sensitivity in healthy relatives of diabetics were still limited. Taste threshold and preference were reported to play a role in determining food intake and thus might play a role in the development of diabetes. Therefore, this study aimed to assess the differences in sweet taste threshold and preference between healthy relatives of diabetics compared to individuals without any family history of diabetes. Total sugar and added sugar intake of the subjects were also examined. Forty-seven individuals with family history of type 2 diabetes (W-FHD) and 66 individuals without family history of type 2 diabetes (WO-FHD) underwent sucrose threshold test using 3-Alternative Forced Choice method and sweet taste hedonic test using sugar-sweetened tea samples. Three days twenty-four-hours (24hours) diet recall interviews were also performed in order to determine total sugar intake including added sugar intake (g/day). Result showed that although W-FHD has slightly lower sucrose threshold compared to WO-FHD, this difference was not significant. Both groups rated tea with 8% sucrose as the most pleasant, with W-FHD gave a slightly higher hedonic score. Investigation to their sugar consumption habit showed that both groups had a higher than recommended total sugar intake, and no statistical significant difference was observed between the two groups. Added sugar intake was significantly lowest in W-FHD1 (subjects with first degree family history of diabetes) compared to the other groups, suggesting that having family history of diabetes, especially close relatives (first degree), might increase awareness about the risk of diabetes and hence promote lifestyle changes. Based on this study, it could be concluded that family history of diabetes was not related with differences in sensitivity and preference towards sweet taste. Furthermore, daily sugar intake between groups with and without diabetes relatives were also not significantly different though less amount of daily added sugar intake was observed in subjects with first degree family history of diabetes.
Keywords: Sweet taste, Diabetes, Family history, Sugar intake
Cite this paper: Vanessa Yolanda, Lina Antono, Astri Kurniati, Sensory Evaluation of Sweet Taste and Daily Sugar Intake in Normoglycemic Individuals with and without Family History of Type 2 Diabetes: A Comparative Cross-sectional Study, International Journal of Diabetes Research, Vol. 6 No. 3, 2017, pp. 54-62. doi: 10.5923/j.diabetes.20170603.02.
Article Outline
1. Introduction
- Food taste has been known as a major determinant in human eating behavior and food choice [1]. The interaction between the chemical substances in foods and the taste buds will generate and transmit signals to the specific area of the brain to produce taste perception which defined as sweet, umami, salty, sour, or bitter. However, these perceptions can only be stimulated when the concentration of the chemicals reach the minimum level that is required by the taste buds to be detected and recognized, which is also known as recognition threshold level [2-4]. The specific taste threshold might be different in each individual since it is influenced by several factors such as genetics [5, 6], age [7], body weight [8, 9], gender [7, 10, 11] and smoking status [7, 12, 13]. Someone who has low threshold level of taste, for instance sweet taste, requires less stimuli to experience a sweet sensation; meanwhile individual with high threshold level of sweet taste is less sensitive and thus needs higher concentration of stimulus to percieve the same sweetness level [2, 3]. Consequently, the differences in taste sensitivity may influence dietary intake [3, 8, 14-17] by affecting the hedonic feature and preference between different concentrations of sweet substances in meals [2, 3, 15].The impairment of taste sensation, particularly sweet taste, is consistently observed in diabetic patients [18-22] as a result of nerve disruption, also known as diabetic neuropathy, the most common complication of diabetes mellitus (DM) [18, 20, 23]. This reduced sweet taste sensitivity may lead to higher sugar consumption which is further related to impaired glycemic control and increased calorie intake in diabetic patients [18, 20, 21]. Although the association between diabetes and sensory response on sweet taste has been well-studied [18-22, 24], evidence on sweet taste threshold and preference in healthy subjects with higher risk of type 2 diabetes (such as individuals with family history of diabetes) is far from being completely understood. Until now, even though the mode of inheritance is not well-known, previous studies have reported that healthy people with family history of diabetes were also tend to be less sensitive toward sweet taste [21, 25, 26]. The reduction of sweet sensitivity may contribute to such overconsumption of sugar and hence the development of diabetes [2]. Based on these data, it could be suggested that lower sweet taste sensitivity in healthy people with family history of diabetes might lead to higher sugar consumption and thus further increase their risk of diabetes. Nonetheless, due to limited number of study, further examination is necessary to quantify the extent of variance in sweet sensory response within these groups. Therefore, this study aimed to assess the differences in sweet taste threshold as well as hedonic preference of sweetened tea beverage with different sweetness levels between normoglycemic people and without family history of diabetes. In addition, total daily sugar intake was calculated in order to evaluate the dietary patterns between these two groups. The analysis were also extended to examine the differences in different degree of family history diabetes and gender.
2. Methodology
2.1. Subjects
- Subjects were recruited through a health program called “Nutrihealth Week” from six companies located in Jakarta, Indonesia. Eligibility requirements included Indonesian, office employees with 40 working hours per week, age 20-55 years, not participating in any weight loss programs or special diet interventions, in a healthy state with no serious medical conditions that might influence taste sensitivity, having a normal fasting blood glucose level (70-99 mg/dL), and willing to be interviewed in 3 non-consecutive days that had been assigned by the researchers. Subjects who were pregnant and/or breastfeeding were excluded from study. Initially, 131 subjects were eligible and participated in this study. However, at the end of the study, only 113 subjects (86.26%) completed the study and their results were included. All subjects provided a signed consent form at the first visit before participating in the study and agreed to adhere to the trial guidelines. This study was approved by Institute of Research Ethics Committee Atma Jaya Catholic University of Indonesia (1382/III/LPPM-PM.10.05/12/2015).
2.2. Study Design
- This cross-sectional survey was conducted between January to April 2016. Each participant attended three visit days that had been arranged by the researchers in each company in order to accomplish data collection: questionnaires, two sensory testing, and three days twenty-four-hour (24hours) diet recall interviews.At the first visit, all subjects were asked to complete questionnaires in order to obtain their personal information including age, marital status, participation in education session or seminars related to nutrition and healthy lifestyle, smoking status, and family history of type 2 diabetes. In addition, the International Physical Activity Questionnaire (IPAQ) [27] was used to assess subjects’ physical activity status. Furthermore, body compositions of the subjects, including body mass index (kg/m2) and percent body fat (%), were measured using InBody 230 (InBody Co Ltd, Korea).
2.2.1. Sensory Evaluation
- Each subject was assigned to complete two sensory testings: (1) sweet taste threshold test and (2) hedonic test for sweet tea with several sweet intensities. Each test was carried out on two different days. On each day of the tests, participants were asked to arrive between 9 AM and 10:30 AM (at least 2 hours after breakfast). Furthermore, subjects were instructed not to smoke or drink coffee 60 minutes before the test [28]. All of the sensory tests were performed in a closed meeting room and were completed before 11 AM.
2.2.2. Threshold Test (Sweet Taste Sensitivity)
- Sucrose solutions which were prepared by diluting sucrose (Gulaku Premium Gula Pasir, PT Sweet Indolampung, Indonesia) in distilled water (Amidis, PT. Trinikal Sinergy Utama, Indonesia) were used to estimate the subjects’ sweet taste recognition thresholds. The sucrose concentrations used in this study (0.1, 0.2, 0.3, 0.4, 0.5, 0.6, 1% weight/volume) were based on previous study [25] and had been confirmed by a pilot study using 15 subjects.Recognition threshold was determined using 3-Ascending Forced Choice (3-AFC) ASTM E-679 [25, 29, 30] with modification. In this method, subjects were given the sucrose solution and distilled water in 3 disposable cups in a randomized order – two cups containing 15 ml distilled water and one cup containing 15 ml sucrose solution starting from the lowest concentration. Subjects were instructed to taste and hold the samples in their mouth for 5-10 seconds before swallowing the samples. After that, subjects were asked to determine which of the cup had a different taste among the 3 cups and to identify the taste. In between tasting the solutions, subjects were instructed to rinse their mouth with distilled water to eliminate any remaining traces of previous samples. When subjects failed to differentiate the samples or to identify the taste, they were given another set of samples with higher sugar concentration. Samples were given continuously until the subjects were able to correctly identify the taste two times consecutively. The first (lowest) concentration of the solution at which the participant was able to detect and identify was considered as the recognition threshold.
2.2.3. Hedonic Test
- In this study, 9-point hedonic scale was used to evaluate the liking of sweet tea with various sweet taste intensity by the subjects. The sweet tea was prepared by brewing the teabag (SariWangi, Unilever Indonesia) in hot mineral water (70-72°C) for 1 minute (500 mL of water for 2 teabags). Afterwards, sucrose was added to the tea to reach the particular sweetness level intended. Five concentrations were used in this study: 5, 8, 10, 12, and 16% weight/volume. These range of concentrations were used to represent the commercial sweet tea beverages which are available in the market. Furthermore, these concentrations had been confirmed by our previous pilot study.Subjects were instructed to rinse their mouth before testing each sample which was given one by one in random order using plastic cup contained 20 ml of sample. At the end of sample testing, subjects were asked to give score to each sample based on their likeness toward the sweetness level of the sweet tea.
2.2.4. Dietary Sugar Intake
- Dietary pattern, including total sugar consumption, was evaluated by three days twenty-four-hour (24 hours) diet recall interviews. Subjects were interviewed in 3 non-consecutive days about their food and beverage intakes, with 2 days on weekdays and 1 day on weekend. Previous study showed that this method was sufficient to minimize the underreporting and objectively measured dietary intakes. Additional interviews did not improve energy estimation [31, 32].During the food recall interviews, the interviewer used food dummies and eating utensils to assist the participants in reporting portion sizes of food and beverage intake more accurately. The dietary intake data was then processed using The Food Processor SQL version 9.7.0. to determine the total sugar intake. Afterwards, the source of sugar intake was classified into several groups: (1) Main dish; (2) Side dish; (3) Raw fruit and vegetables (salad); (4) Snacks; (5) Bakery and cakery; (6) Dairy products; (7) Desserts; (8) Sugar sweetened beverages; (9) Condiments; (10) Others natural sugar sources (lactose in fresh milk; total sugar in flavoured milk is considered as added sugar). Added sugar intake was calculated by excluding the natural sugar in group 3 and 10.
2.2.5. Statistical Analysis
- Statistical analysis was performed using SPSS (version 21.0, IBM, USA). All of the data were presented as mean and standard deviation. In addition, sociodemographic information was presented as percentage for categorical variables. Independent sample t-test was used to analyse the difference of each outcome between group with family history of type 2 diabetes (W-FHD) and group without family history of type 2 diabetes (WO-FHD). Kruskal Wallis test was performed as the post-hoc analysis between more than two groups such as: W group which was identified as first degree (W-FHD1), second degree (W-FHD2) and WO group. Significance was assigned at P-value of <0.05.
3. Results
3.1. Subject Characteristics
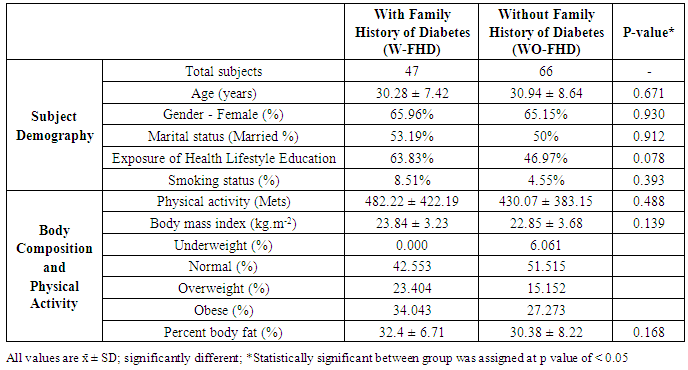
- In total 131 subjects were grouped based on their family history of type 2 diabetes (T2DM) into two groups: with or without family history of T2DM (W-FHD and WO-FHD). Family history of T2DM was defined as all first degree (mother, father, brothers and sisters) and second degree (maternal and paternal aunts, uncles, and grandparents) biological relatives with T2DM.
|
3.2. Sweet Taste Threshold
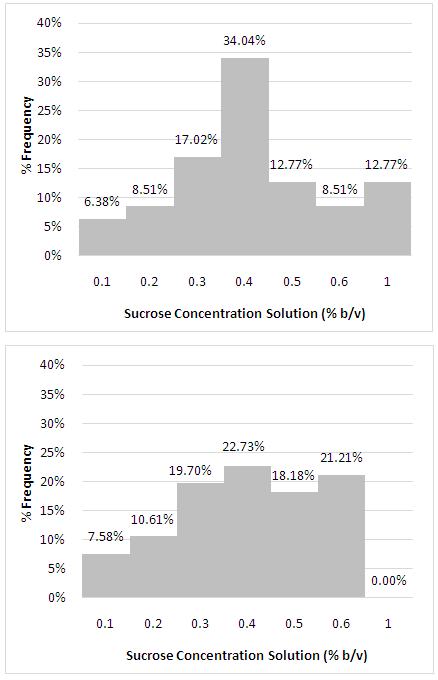
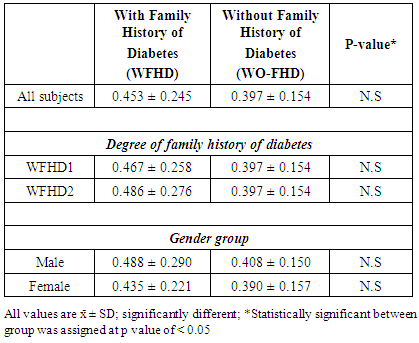
- Only 47 individuals with family history of T2D (W-FHD) and 66 individuals without family history of T2D (WO-FHD) underwent the sucrose threshold test. The distribution of the various threshold level of sucrose solution and average of threshold value between groups are given in Figure 1 and Table 2. For both groups, majority of the subjects had sucrose threshold at the 0.4% (weight/volume) concentration. However, none of WO-FHD needed higher concentration than 0.6% to detect and recognize sweet taste of sucrose while 12.77% (n=6) subjects in W-FHD needed higher concentration (1%) (Figure 1).
|
3.3. Hedonic Evaluation of Sweet Tea with Various Sweetness Level
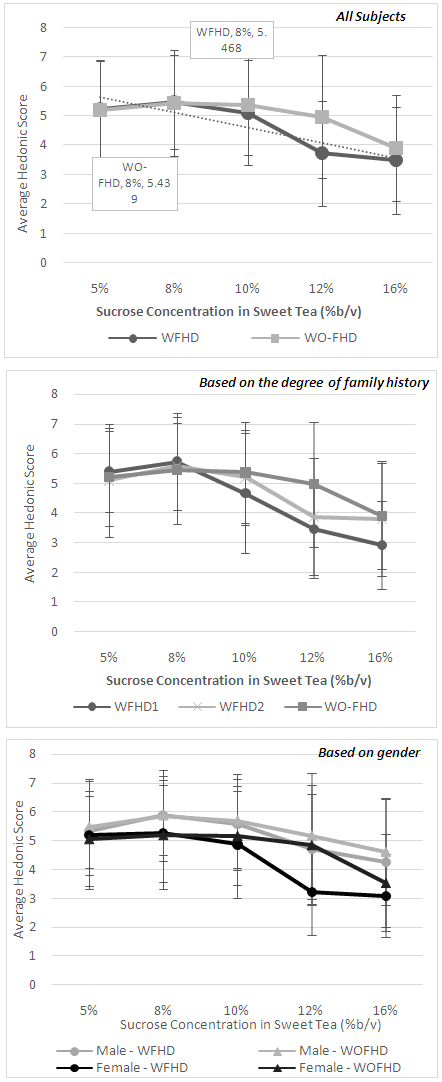
- Sweet tea with various sucrose concentrations (5-16% weight/volume) were used to examine the preference of sweet taste. Both groups, W-FHD and WO-FHD, scored tea with 8% of sucrose as the most pleasant. About 36% of subjects in each group scored this concentration with score 7 and 8 (like moderately and like very much). Subjects in W-FHD group give a non-significant higher hedonic score compared to the WO-FHD group (5.468 ± 1.586 vs. 5.439 ± 1.807, p =0.930). The average of hedonic scores of each sweet tea samples were given in Figure 2. Furthermore, it was found that the additional sucrose concentration above 8% lowered the hedonic score in both groups, with lowest acceptance value found in sweet tea with 16% sucrose concentration. Further analysis based on the degree of family history of diabetes and gender were performed. The results showed that there was no significant difference in hedonic score between W-FHD1 and W-FHD2. The sweet tea with 8% sucrose still had the highest score with slightly higher score given by W-FHD1 group. However, for the higher sweetness level of samples (10%, 12%, and 16%), W-FHD1 gave lower hedonic score compared to W-FHD2 and WO-FHD (Figure 2b).Based on gender group analysis, tea samples with 8% sucrose were consistently chosen as the most favoured sweetness level between men and women in W-FHD and WO-FHD group. However, it was found that men gave higher hedonic scores than women for all of the sweet tea samples (p>0.05).
3.4. Dietary Sugar Intake
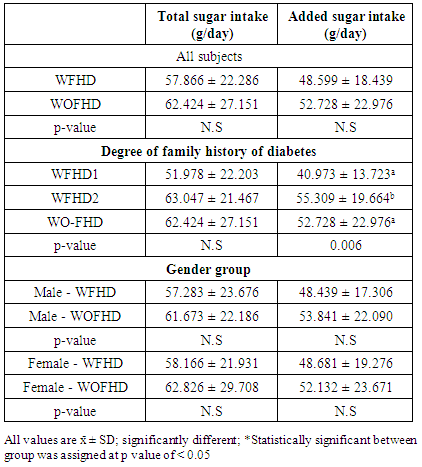
- The mean of total sugar intake, including natural and added sugar, of each group was presented in Table 3. Total sugar intake in WO-FHD group was higher than W-FHD as well as added sugar intake. However, these differences were not statistically significant (p = 0.346 and p = 0.310). Based on the degree of family history of diabetes group analysis, W-FHD1 had a significant lower added sugar intake compared the other groups (p=0.006). Moreover, based on gender group analysis, both in male and female group, individuals with family history of diabetes had lower total and added sugar intake compared to those without family history of diabetes. However, these differences were not statistically significant.
|
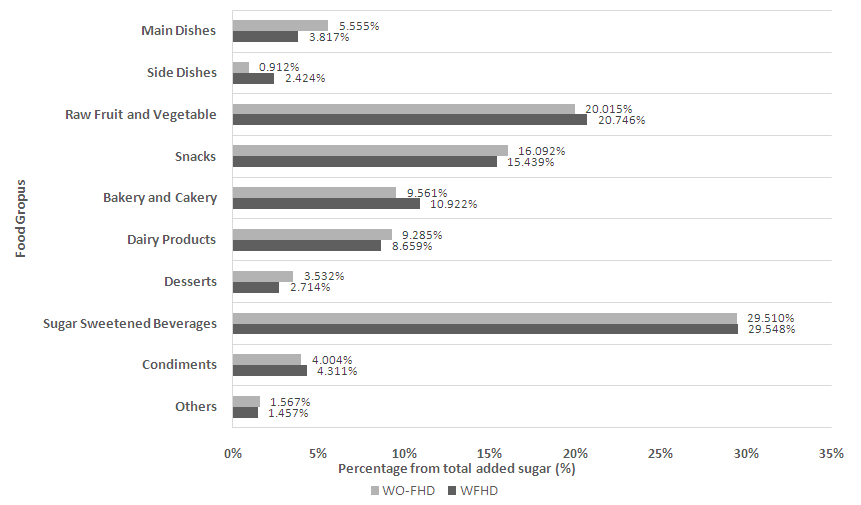 | Figure 3. Percentage distribution of sources of sugar intake by food group |
4. Discussions
- Previous studies have shown how sensitivity towards specific taste might influence food choice [1] and play a significant role in determining total food intake [2, 3, 15]. It is suggested that when someone consume the amount of tastants which is equal to the taste threshold, it will initate a reaction which releases neurotransmitters into sensory cranial nerve fibers and transmits taste information to the brain. Then, in conjunction with olfactory, thermal and textural informations, the brain will elicit the perception of flavor according to experience, motivation, and hedonic valence which affects ingestive response [2-4, 33]. Thus, individuals who are less sensitive toward sweet taste might be predicted to choose food with higher concentration of sugar and have a higher total sugar intake [2-4]. This proposed conceptual model for sensitivity, hedonic and preferences, and food intake has been extensively studied not only for sweet taste [34-36] but also for other basic tastes including salty [14, 17, 37], bitter [16, 35], umami [8], and even fatty taste [3, 38, 39] although the results remain inconsistent [15, 16].Based on the proposed mechanism aformentioned, it is expected that W-FHD will have a higher sweet threshold and preference compare to WO-FHD, which subsequently trigger higher sugar intake and thus further increase their risk of diabetes. However, results of this study showed that there were no significant differences between W-FHD and WO-FHD neither in sweet taste recognition nor preference. The mean recognition threshold value (±0.4% weight/ volume) observed in this study was higher compared to other studies. Methods and age group differences might explain this varying results [25, 35]. It was also observed that W-FHD had a non-significant higher sweet taste threshold and preference to the sweet tea with 8% sucrose. In addition, dietary sugar intake between both groups did not have any considerable differences, eventhough sugar intake in W-FHD was slightly lower. Liking for specific taste is reported to be innate and has been developed in early childhood [3, 5, 40], however some studies have shown that dietary restriction in long term [41], for example salt restriction might increase someone’s sensitivity toward salty taste and vice versa [42]. Therefore, it could be suggested that the subjects with family history of diabetes in this study might be more concern about their diabetes risk and thus limiting their sugar intake. This is then suggested to impact their sensitivity and preferences toward sweet taste. However, this study was not able to assure this cause and effect since this observational study was only limited in one time point examination.Nonetheless, further analysis regarding to the degree of family history of diabetes found that W-FHD1 consumed significantly less added sugar compared to W-FHD2 and WO-FHD. This result was not unpredicted because W-FHD1 has a closer relationship with their diabetic family members and thus percieve themself to have higher risk of diabetes; followed by attempts to change their lifestyle behaviours to minimize their risk, including limiting added sugar intake [43-45]. In addition, 40% of W-FHD1 had joined nutrition education programs or seminars which are related to healthy lifestyle within the past five years. Education program is essential in improving understanding about what to do to have a healthier life [45].Moreover, study by Whitford et al. (2009) in 297 diabetic subjects showed that they initiatively speak to their family members, especially to their children, about the risk of diabetes. In this study, 90% of the subjects recognized the benefit of sharing this information with their family members to improve the awarness of healthy lifestyle [46]. Therefore, W-FHD1 in this study, who have at least one parent (93%) diagnosed with diabetes, might have more awareness about the risk of diabetes and adjust their food intake.Another possible reason explaining the lower added sugar intake in W-FHD1 was as an additional outcome of social support given to their diabetic family members. Preparing meals is known as one of the social supports that might help improving glycemic and lipid profile in diabetics [47]. It is also assumed that consuming the same meals that have been prepared for diabetics improved diet quality, including less sugar or low glycemic index foods [1, 48-50]. Nonetheless, the present study did not investigate these factors in depth.Gender differences in health-related behaviors, including food choice, have been reported in many studies [7, 10, 11, 51]. It is reported that women’s greater weight control obsession and stronger beliefs in healthy eating appear to be partly attributed to higher quality dietary pattern in women [51]. However, in this study, it was found that women subjects had a higher sugar intake compared to men subjects within the group of W-FHD and WO-FHD even though they were slightly more sensitive toward sweet taste and gave lower hedonic score to the sweet tea. This result did not support the initial hypotesis, which might be caused by several factors. It is known that food choice is not solely intermediated by sensory response, but also by cognitive restraint, attitudes toward foods, nutritional knowledge, or social influence [1, 2, 52]. Furthermore, previous studies found that women preffered snacks with high sugar content as comfort food. Sweet cravings are also more common found in women, while male tend to crave savory food than sweets [53-54].There are some limitations to be considered in this present study. First, this study only used sweet tea as the sample to examine the acceptance of sweet taste in subjects. Sweet substances in different food matrix might lead to a different preference result [25]. Second, subjects’ hunger and fullness rate before the sensory test were not examined and this may give a considerable impact to hedonic score [55]. Third, this study did not employ the health risk models, a commonly model to predict a person's health-related behavior [56]. Fourth, the limited number of subjects in this study indicates that a bigger study involving more subjects would be needed to support current findings.Despite those limitations, this study could provide new understanding regarding sensory function and sugar intake in normoglycemic subjects based on their family history of diabetes. Furthermore, this study also showed that Indonesian adults easily exceed the recommended limit of sugar intake by WHO eventhough they have a higher risk of diabetes due to their family medical history. Since diabetes is a major public health challenge which threatens all over the world including Indonesia and sugar intake has been studied to have a strong positive association with diabetes, strategy in reducing sugar intake must be put as an important issue in government agendas in order to build a healthier Indonesia.
5. Conclusions
- From this observational study, it is evident that there was no difference in sensitivity and preference toward sweet taste between individuals with and without family history of diabetes. Furthermore, both groups had a higher than recommended daily sugar intake with no significance difference observed between both groups. This high sugar intake indicates that exploring further approaches to reduce sugar intake is very important in order to prevent the development diabetes. However, added sugar intake was significantly different between groups with different degree of family history of diabetes. Further investigations and better study design are required to assure the relationship between family history, dietary restriction, and sensory function alteration since taste perception is suggested to be as a result of cumulative effect of genetic factor and lifetime exposure to certain tastes.
ACKNOWLEDGEMENTS
- The study was funded by PT. Nutrifood Indonesia.
 Abstract
 Reference
 Full-Text PDF
 Full-text HTML