-
Paper Information
- Paper Submission
-
Journal Information
- About This Journal
- Editorial Board
- Current Issue
- Archive
- Author Guidelines
- Contact Us
International Journal of Diabetes Research
p-ISSN: 2163-1638 e-ISSN: 2163-1646
2017; 6(2): 35-40
doi:10.5923/j.diabetes.20170602.01

The Metabolic Hormones Leptin, Adiponectin and Troponin T in Type 2 Diabetes Patients and Athletes in Jamaica
 Abstract
 Reference
 Full-Text PDF
 Full-text HTML
Aldeam Facey1, Lowell Dilworth2, Rosemarie Wright-Pascoe3, Melissa Walker4, Rachael Irving1
1The Department of Basic Medical Sciences, University of the West Indies, Mona
2The Department of Pathology, University of the West Indies, Mona
3Department of Medicine, University Hospital of the West Indies, Mona
4School of Nursing, University of the West Indies, Mona
Correspondence to: Aldeam Facey, The Department of Basic Medical Sciences, University of the West Indies, Mona.
| Email: |  |
Copyright © 2017 Scientific & Academic Publishing. All Rights Reserved.
This work is licensed under the Creative Commons Attribution International License (CC BY).
http://creativecommons.org/licenses/by/4.0/

Diabetes mellitus, the metabolic disease which affects millions is increasing in prevalence. Type 2 diabetes mellitus results from genetic predisposition and lifestyle. Physically fit individuals such as athletes, even with a genetic predisposition tend to have a low incidence of type 2 diabetes mellitus. Several metabolites are associated with the disease and can provide insights regarding its development. The study sought to determine the association between type 2 diabetes mellitus and the metabolic hormones: leptin, adiponectin and troponin and to evaluate these hormones in athletes. Individuals ranging from 18 to 50 years of age were screened for diabetes using fasting glucose and HbA1c. Participants were classified into 6 groups: male athletes (MA), female athletes (FA), male diabetes patients (MD), female diabetes patients (FD), male controls (MC), female controls (FC). Leptin, adiponectin and troponin were determined for each group. Leptin levels were significantly higher in MD and FD while adiponectin was significantly lower in MD and FD. Skeletal muscle troponin T was not significantly different among the groups studied. Adiponectin and leptin may be used to distinguish between persons with diabetes and normoglycemia however levels of physical activity may not result in higher adiponectin concentration or lower leptin concentration in the non-diabetes state.
Keywords: Diabetes Mellitus, Leptin, Troponin T, Adiponectin, Athletes
Cite this paper: Aldeam Facey, Lowell Dilworth, Rosemarie Wright-Pascoe, Melissa Walker, Rachael Irving, The Metabolic Hormones Leptin, Adiponectin and Troponin T in Type 2 Diabetes Patients and Athletes in Jamaica, International Journal of Diabetes Research, Vol. 6 No. 2, 2017, pp. 35-40. doi: 10.5923/j.diabetes.20170602.01.
1. Introduction
- Type 2 diabetes mellitus is a well-known disease which affects millions of people [1]. Type 2 diabetes mellitus is increasing worldwide and it is the result of both genetic predisposition, behavioral and environmental factors [2]. The disease, formerly known as non-insulin-dependent diabetes mellitus, can be prevented with lifestyle changes [1]. Lifestyle changes and treatment with metformin can reduce the occurrence of diabetes mellitus [2]. Lifestyle changes, however, have been found to be more effective [2]. There are two popular theories regarding the etiology of type 2 diabetes. One is the evolution of a genotype that no longer has survival benefits and the other is that it is an adult metabolic response to fetal malnutrition [3]. Insulin resistance is commonly associated with type 2 diabetes. Central obesity is the most common factor causing insulin resistance [3]. Insulin deficiency in diabetes patients is due to the inability to compensate for insulin resistance [3]. Several biochemical metabolites are associated with adiposity as well as the development of type 2 diabetes mellitus. One of these metabolites is adiponectin. Adiponectin is similar in structure when compared with collagenous proteins, and is secreted by adipocytes. Adiponectin is proposed to mediate insulin resistance related obesity [4]. Recent research done to investigate the role of Adiponectin in the development of type 2 diabetes found that individuals suffering from the disease had a lower concentration of adiponectin when compared with the non-diabetes population. As such, individuals with higher concentrations of adiponectin are less likely to develop type 2 diabetes mellitus [4]. A clinical study among hemodialysis patients found that patients with higher body mass index values had a lower concentrations of serum adiponectin. [5]. Leptin is another metabolite associated with type 2 diabetes mellitus. Leptin is a protein released by adipocytes which aids in the regulation of eating behavior through central neuroendocrine mechanisms [6]. This adipocyte-specific protein provided the first link to the regulation of body weight [7]. Severe obesity can be caused by a lack of or resistance to leptin and it was found that there are increased levels of leptin with increasing adiposity in humans and rodents [8]. Even though leptin generally increases with adiposity, it was found that at each BMI level there is variability in serum leptin concentration. This suggests that there are differences in its secretion rate from fat [9]. In younger elite kayakers it was observed that short-term detraining resulted in a significant increase in waist circumference, insulin and leptin [10]. The magnitude of the increases in insulin and leptin was dependent on the level of inactivity, where a partially detrained athlete did not express an increase as marked as was found in the totally detrained athlete [10].Troponin is the inhibitory or contractile regulating protein complex of striated muscle. Research shows that elevation in cardiac troponin T (cTnT) occurs frequently in type 2 diabetes mellitus [11, 12]. Elevations are also associated with an increased risk of cardiovascular disease [11]. An exercise induced increase in troponin in endurance athletes was also discovered by researchers [13]. However, it was found that this was not always reproducible and may be a physiologic reaction under special conditions [14]. Slow skeletal muscle troponin T is coded for by the gene TNNT1 [15]. Researchers have proposed that TNNT1 is a biomarker for muscle adaptation to resistance training in older adults [15]. Recently, epigenetic markers have been used as a new parameter in the assessment of the influences of lifestyle factors on obesity phenotypes [16]. A study involving adolescents showed differential methylation levels of the TNNT1 gene between the high and low responders to a weight loss program [16]. It was also found that the level of methylation was significantly associated with changes in weight [16]. Individuals with more methylation of the TNNT1 gene, showed better response to the weight loss program [16].The TNNT1 gene was found to be consistently elevated in the brains of mouse treated with ketamine [17]. TNNT1 interacts directly with the Fox01 gene, which is known to be involved in numerous peripheral metabolic pathways and central energy homeostasis [17]. The induction of expression of the TNNT1 gene by ketamine possibly illustrates the genes involved in metabolic syndromes [17]. While cTnT elevations occurs in persons with diabetes, this troponin is specific to the cardiac muscles only [12]. No published study was found establishing a relationship between TNNT1 muscle troponin and type 2 diabetes mellitus.The study aimed to assess three metabolic parameters which may be involved in the development or progression of type 2 diabetes mellitus. Athletes, controls and participants with type 2 diabetes mellitus were recruited for the study. A metabolic profile inclusive of adiponectin, leptin and troponin was created, defining the healthy, physically active individuals, the healthy sedentary individuals and the diabetes patients and the associations with these metabolites.
2. Method
- Ethical approval was granted by the University Hospital/ University of the West Indies Ethics Committee for conduct of the research. Athletes were selected from the University of the West Indies, Jamaica Track and Field Team as well as a track club whose members train on the University of the West Indies, Campus. Patients diagnosed with type 2 diabetes mellitus were selected from the Diabetes Clinic of the University Hospital of the West indies (UHWI), where they had already been classified as having type 2 diabetes mellitus using standard procedure by endocrinologist and internal medicine consultants Signed informed consent was obtained from each participant.Six groups were defined and selected for this study. The groups included male athletes, female athletes, male diabetes patients, female diabetes patients, male controls and female controls. All participants ranged between 18 and 50 years old. Alcoholics and smokers were excluded from this study. The participants were asked to fast and rest overnight before the start of the assessment, following which samples were collected the following morning. Three consecutive resting pulse rate and blood pressure measurements were recorded using an electronic sphygmomanometer while the participant was sitting [18]. Anthropometric measurements inclusive of waist circumference, hip circumference, height and weight were taken. A modified American Council on Exercise physical fitness questionnaire [19] was used as a tool to distinguish groups. The questionnaire was modified to include past and present medical history. Each athlete trained 5 days each week with a certified coach, the non-athletes and diabetes patients had less than 20 minutes of exercise per week.Body fat percentages were measured using the BodyMetrix Analyzer. This method utilized the three-site technique which employed a modified version of the Jackson-Pollock three site skinfold equation for males and the Pollock three site equation for the females [20]. The Machine measures the thickness of the fat at the specific site by use of ultrasound technology [21]. Three points on the right side of the body were used. For males, the ultrasound machine was placed at the chest mid-way between the nipple and the shoulder joint. A read out was displayed on a computer which recorded the thickness of each tissue that is fat, muscle and the interfaces in millimeters. This was done 2 to 3 times and an average for improved accuracy was determined. This was repeated at the two other areas, one an inch right of the umbilicus and the other on the thigh mid-way between the knee and hip joints. For females, the sites used are: mid right triceps, the right hip an inch above the pelvic bone and an inch right of the umbilicus. From the readings obtained the percentage body fat was calculated. A glucometer was used to measure the fasting glucose for those who had no history of diabetes and to confirm diabetes in those participants who were registered at the Diabetes Mellitus Clinic at UHWI. A Lactate Plus analyser was used to measure the resting lactate level. Fasting glucose and lactate measurements involved a small prick of the index finger to produce the blood sample needed. Venipuncture was used to collect two samples of blood. One sample was collected in a red top vacutainer for serum and was used to test for the metabolic hormones: leptin, adiponectin and troponin T. These assessments were done using ELISA kits supplied by Thermo Fisher Scientific Inc. The second sample was collected in a collection tube with anticoagulant and used to test for glycated hemoglobin HbA1c.Data AnalysisOne-way ANOVA analysis was done using the SPSS 17 software to compare the means across the groups. One-way ANOVA analysis was combined with Turkey’s post hoc procedure to determine significant differences across the groups. Pearson’s bivariate correlation was used to assess the relationships between body fat and leptin and between body fat and adiponectin. The level of significance was noted at the P≤0.05 level. Data was reported as mean ±SD.
3. Results
- The male and female athletes had significantly lower fat percentages when compared to the patients with diabetes mellitus (Table 1 and 2). The female controls did not have a significantly lower fat percentage when compared to the patients with diabetes (Table 1 and 2). Leptin concentrations were notably higher in the diabetes patients compared to the athletes and control groups (P<0.05) (Figure 1). Leptin concentration was higher in the females than in males. The hormone was found to be significantly lower in female athletes than in the female controls (Figure 1). No difference was noted between the male athletes and controls (Figure 1). Leptin levels increased significantly with fat (P<0.05), however, while the mean body fat of the diabetes patients was higher compared the other groups leptin levels did not decrease with lower body fat in the diabetes group.Adiponectin concentration was significantly lower in the diabetes patients (P<0.05) (Figure 2). Troponin T showed no significant differences among the groups assessed (Figure 3).As was expected, the HbA1c and glucose concentrations of the diabetes groups were higher when compared to the athletes and control groups for both males and females (Figure 4).
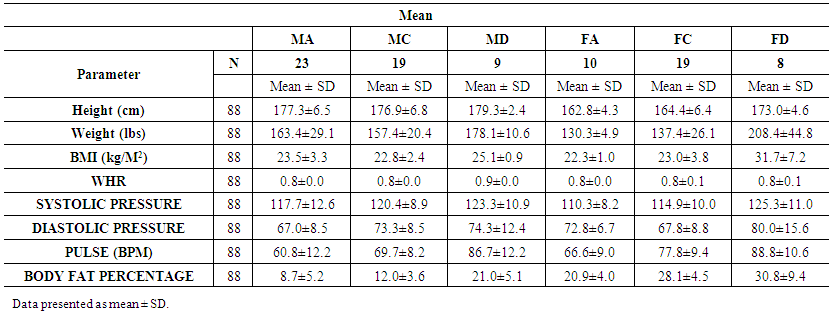 | Table 1. Comparisons of anthropometrical characteristics among the groups |
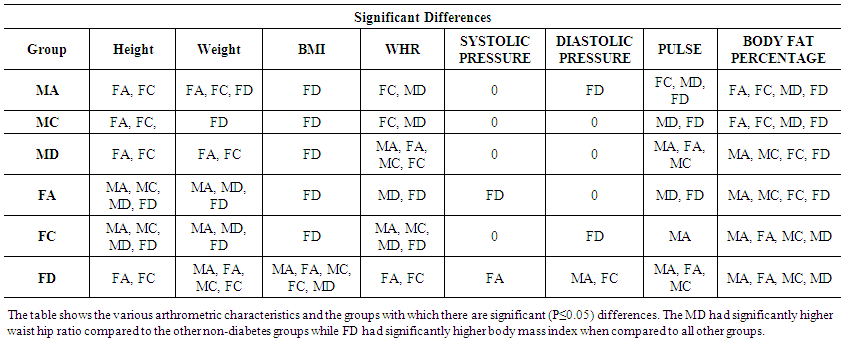 | Table 2. Significant differences in anthropometrical characteristics among the groups. P≤0.05 is significant |
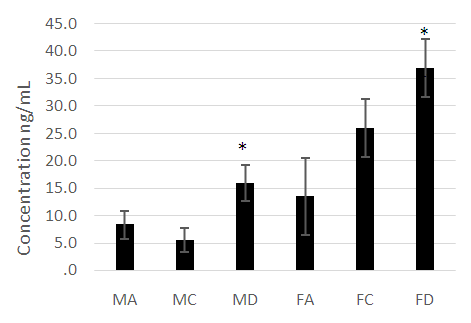 | Figure 1. A comparison of leptin concentrations across the diabetes, athletic and control groups assessed. Leptin concentrations were significantly higher (P<0.05) in the MD compared to MC and MA and significantly (P<0.05) higher in FD compared to FC and FA |
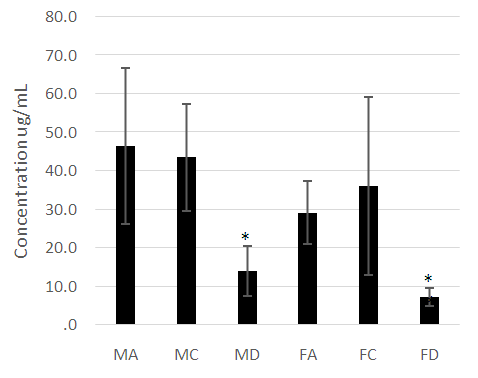 | Figure 2. A comparison of adiponectin concentration among the diabetes, athletic and control groups. Adiponectin is significantly lower (P<0.05) in the diabetes patients (MD, FD) compared to the other groups |
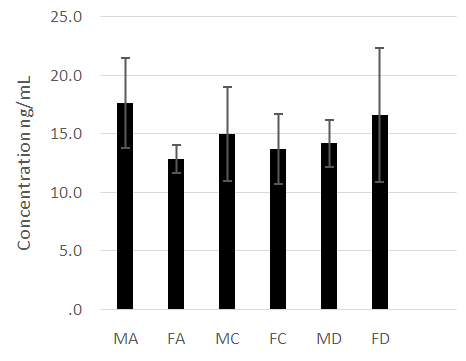 | Figure 3. A comparison of skeletal muscle troponin T concentrations among the diabetes patients, athletic and control groups. No significant differences were noted across the groups (P>0.05) |
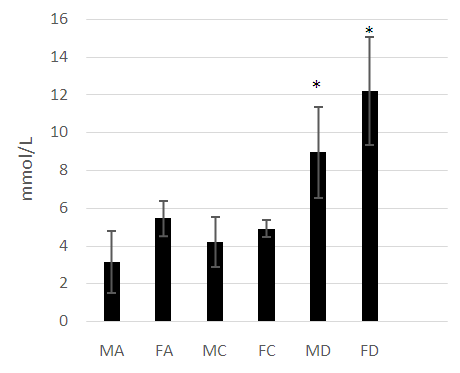 | Figure 4. A comparison of the fasting glucose concentrations among the diabetes, athletic and control groups. Fasting glucose was significantly higher in the diabetes patients (MD, FD) compared to all other groups (P<0.05) |
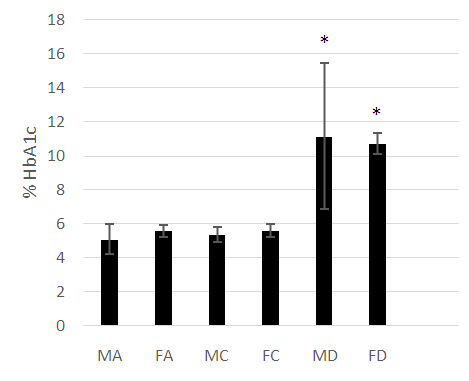 | Figure 5. A comparison of HbA1c concentrations among the diabetes, athletic and control groups. HbA1c is significantly higher (P<0.05) in the diabetes patients (MD, FD) |
4. Discussion
- The anthropometrical data we obtained was similar to that seen with current literature. Male athletes and controls had significantly lower waist- hip ratios and body fat parentages when compared to the patients with diabetes. The same is true for the female population, with the patients with diabetes having the highest mean body fat percentage). HbA1c and fasting glucose tests are very effective in diagnosing and monitoring diabetes mellitus. The patients with diabetes had the highest concentrations of HbA1c and fasting glucose which were statistically significant when compared with the other groups (P<0.05). This clearly distinguished the groups and established the status of the patients with diabetes at the time of the study.Leptin concentration was significantly higher in the female patients with diabetes when compared to the controls and to the athletes (Figure 1). Leptin concentration in the female athletes was significantly lower than that seen in female controls. Leptin concentration was also higher in the population of male patients with diabetes when compared to the athletes and controls. There was no significant difference between the male controls and athletes, however. However, body fat percentage is significantly lower in the female athletes compared to the controls while there are no significant differences in body fat in the male athletes and controls. This suggests that differences in fat associate more with lipid concentration than with physical activity in a non-diabetes cohorts. Leptin is produced by adipocytes and as such the groups with the highest mean fat percentage also had the highest leptin levels. Besides being associated with diabetes, in this study, leptin level is gender- dependent. These results concurred with literature findings [21, 22]. Leptin concentration positively correlates with body fat, however in the diabetes group the elevation in leptin concentration is independent of variations in body fat. This suggests that the hormone may be directly involved in the pathology of the disease. The results indicated that the leptin that was increased in patients with diabetes was likely due to resistance to leptin given the biological function of leptin. Adiponectin was significantly lower in patients with diabetes in both the males and females (Figure 2). There were no significant differences, however between the athletic and control groups. Based on these findings, insulin resistance seemed to have impaired the release of adiponectin. Researchers have found that by using thiazolidinediones, they could upregulate adiponectin and its receptor, thereby producing an antidiabetes effect through insulin sensitization [23]. The study provided confirmation that adiponectin is reduced in the type 2 diabetes population and provides a basis for the consideration of adiponectin in the assessment of the disease.No relationship could be established between type 2 diabetes and skeletal muscle troponin T. There were no significant differences among the groups assessed. Skeletal muscle troponin T is present in muscles, as opposed to fat and as such was not affected by variations in adiposity. The results indicate that skeletal muscle troponin T concentration may not be affected by insulin resistance. This was the first study investigating the relationship between TNNT1 expression in terms of serum concentration and type 2 diabetes mellitus in the Jamaican population.
5. Conclusions
- The research showed that leptin concentration is elevated in type 2 diabetes mellitus and is strongly correlated with body fat in normoglycemia. Adiponectin is significantly lower in type 2 diabetes mellitus. The results suggested that high levels of adiponectin and lower levels of leptin are indicators of decreased risk for type 2 diabetes development. Both adiponectin and leptin can be considered in the assessment and the development of treatments for type 2 diabetes mellitus. Increased physical activity or athleticism does not result in higher adiponectin concentration or lower leptin concentration in the non-diabetes patients. There is no association between skeletal muscle troponin T and athleticism or type 2 diabetes mellitus in the Jamaican population studied.
ACKNOWLEDGEMENTS
- The authors wish to acknowledge the Office of Graduate Studies and Research at the University of the West Indies, Mona, for funding the research.