International Journal of Diabetes Research

p-ISSN: 2163-1638    e-ISSN: 2163-1646

2016;  5(2): 26-34

doi:10.5923/j.diabetes.20160502.02


Dietary Adherence Pattern in the Context of Type 2 Diabetic Management within Clinical Setting, Kenya

Musee C. N.1, Omondi D. O.2, Odiwuor W.3

1Department of Nutrition and Health, Maseno University, Maseno, Kenya

2Kenya Nutritionists and Dieticians Institute (KNDI), Department of Nutrition and Health, Maseno University, Kenya

3Department of Education Psychology, Maseno University, Maseno, Kenya

Correspondence to: Omondi D. O., Kenya Nutritionists and Dieticians Institute (KNDI), Department of Nutrition and Health, Maseno University, Kenya.

Email:

Copyright © 2016 Scientific & Academic Publishing. All Rights Reserved.

This work is licensed under the Creative Commons Attribution International License (CC BY).
http://creativecommons.org/licenses/by/4.0/

Abstract

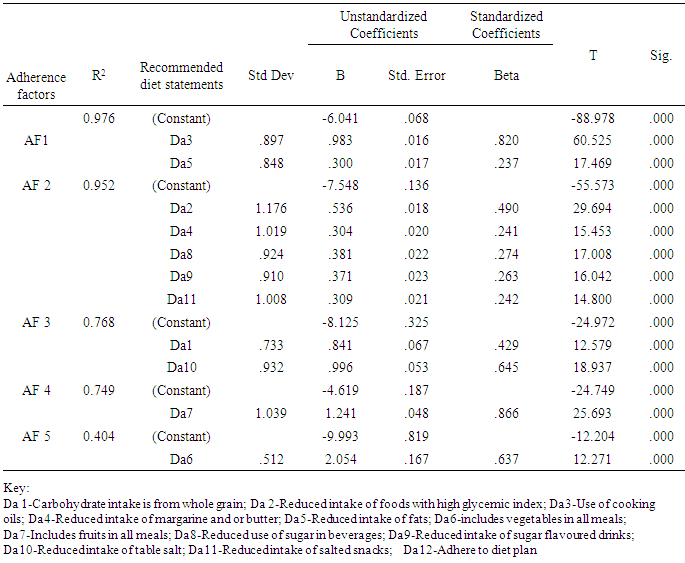
Background: There is a rise in prevalence of Type 2 diabetes in Kenya, and an increase in related complications, which lead to disability and death. Diet modification to control blood sugar, lipid levels and pressure are vital in lowering risk and complications development in the management of Type 2 diabetes. Studies indicate that adherence to diet therapy is below average, even when patients understand the importance of the therapy. Information on diet adherence in the management of Type 2 diabetes in Kenya is in most cases scanty, making it difficult to make focused recommendations. The objectives of this study were to assess the level of diet adherence in dietary management of Type 2 diabetes. Materials and Methods: Across sectional study analysis of a sample of 240 adult diabetics with 35 years and above and have managed the condition for at least six months was executed. Information on dietary behaviour was collected using a pre-tested dietary habit assessment survey tool. Hierarchical regression with preceding principle axis factoring was used to assess the relationship between the recommended diet and diet adherence with a preceding principal axis factoring.Results: The study revealed that majority of the participants (73.9%) had a diet adherence level of 80%, and only 22.3% had 100% diet adherence as per the recommendation of the health providers. An adherence pattern focused mainly on controlling blood glucose and reducing development of complications. It emerged that adherence category one was characterized by replacing cooking oils with fats (R2=0.976, ρ<0.001), category two characterized by reduced intake of sugar, margarine, butter and salt (R2=0.952, ρ<0.001) while category three was characterized by reduced salt and increase whole grain intake (R2=0.768, ρ<0.001). Conclusions: In conclusion, the study confirmed that three categories of adherence pattern could emerge with more concern put on replacing fat with cooking oil, followed by factors with emphasis on reduced intake of sugar, margarine, butter and finally a factor with more emphasis put on reduced salt along with increased grain intake. Efforts are required to improve diet adherence, which emerged to be inadequate even when patients receive diet advice and can afford the diet.

Keywords: Type 2 diabetes, Diet, Adherence pattern, Management

Cite this paper: Musee C. N., Omondi D. O., Odiwuor W., Dietary Adherence Pattern in the Context of Type 2 Diabetic Management within Clinical Setting, Kenya, International Journal of Diabetes Research, Vol. 5 No. 2, 2016, pp. 26-34. doi: 10.5923/j.diabetes.20160502.02.

1. Background

Non-communicable diseases including diabetes will in future contribute to more deaths than communicable diseases [1] [2]. Projections from the past five years indicated that there will be a 69% increase in the number of people with diabetes [1] [3]. Kenya, is recorded an increasing trend of Type 2 diabetes prevalence, from 3.3% in 2010 to a projection of 4.5% in 2025 [4][5] and a growth in the disease burden [2] [6] [7]. In the course of time, untreated diabetes results in blindness, kidney failure and lower limb amputation, and also leads to the onset of cardiovascular disease, the leading cause of death in diabetes patient’s [8] [9] [10].
Type 2 diabetes can be controlled and prevented through lifestyle changes with a focus on diet management [11] [12] [13]. Studies show that diet management, reduce the complications associated with Type 2 diabetes [6] [14] [15] [16] [17] [18] [19]. Yet, studies show, that the extent to which patients follow the recommended dietary regime is below optimal in most cases, ranging from 22% to 70% [20] [21] [22] [23]. There is evidence that patients adhering to the diet recommendations given in the management of Type 2 diabetes are able to control blood glucose and manage the development and treatment of complications [24] [25] [26].
Dietary management of Type 2 diabetes is part of the Medical Nutrition Therapy (MNT), whose focus is to maintain blood glucose levels to as near normal as possible [24]. The general agreement is that patients should receive dietary counseling by a professional nutritionist or dietician, and have their diets tailored to suit individual needs, taking into consideration individual preferences, cultural practices and the willingness to change [24] [27] [28].
Diet recommendations for Type 2 diabetes are tailored from the goals of MNT, and are dependent on whether the need is primary, secondary or tertiary prevention. In primary prevention, the focus is to identify individuals at risk of developing Type 2 diabetes and prescribe a diet mostly aimed at weight reduction. In secondary prevention, the focus is to prevent the development of complications in individuals with Type 2 diabetes. In tertiary management, the focus is to control the microvascular and macro vascular complications of Type 2 diabetes [4]. Patients are guided to modify their diets depending on whether they are in primary, secondary or tertiary levels of management. The general agreement is that dietary counseling has to be carried out by a dietician or nutritionist preferably with an interest in diabetes mellitus. Different authors agree that restrictions on calorie intake should be minimal, to provide the required energy and avoid the breakdown of protein by the body for energy needs, and that, diets have to be tailored to suit individual needs, preferences and cultural practices [4] [19] [24] [26] [29] [30] [31] [32] [33] [34] [35].
In order to improve dietary management of Type 2 diabetes, it is important to establish the diet adherence levels, to help manage Type 2 diabetes This study therefore sought to assess the level of adherence to diet in dietary management of Type 2 diabetes among eligible patients in Jaramogi Oginga Odinga Teaching and Referral Hospital.

2. Materials and Methods

This study adopted a cross sectional study design. Data was collected within a period of three months and analyzed once. This study design was chosen because it does not allow for any manipulation of factors and provides population characteristics as they occur at one point in time.The study was carried out at in Kenya, in Jaramogi Oginga Odinga Teaching and Referral Hospital, which is the major referral hospital in Nyanza, Western and North Rift, serving over 12 districts in Nyanza alone and with a catchment population of over 5 million people in the three provinces [36]. The population of this study was made up of all Type 2 Diabetes clinic attendees aged 35 years and above. This age group is more independent in terms of decision-making, which may include what and how they eat [37]. A sampling frame of 480 patients was arrived at based on the average number of individual patients who visit the clinic every day and the length of time it would take before they made their second visit
The sample, which consisted of 238 diabetic patients, was determined by the formula proposed by Yamane in 1967. The formula is as shown below;
n=N/1+N (e) 2
Where n is sample size
N is population size and
e is the level of precision:
n=N/1+N (e) 2=480/1+480(0.05)2=218 patients
The sample size was increased by 10% to account for contingencies such as non-response and recording error.
Therefore, 10/100 of 218=21.8=22, giving a total sample size of 218+22=240 individuals [38].
Within the context of measurement, dependent variable was mainly diet adherence construct. This was defined as the extent to which patients follow health provider recommended diet. Independent underlying variables included dietary management options in the management of Type 2 diabetes. In this case, advice to consume complex carbohydrates, foods with a low glycemic index, polyunsaturated fats, monounsaturated fats, fruits and vegetables, reduced salt and sugar, and consistency in following a diet plan, in the management of Type 2 diabetes. The seven statements of dietary management options were represented by 12 attributes of recommended diet for Type 2 diabetes within MNT. Increased consumption of complex carbohydrates was represented as “carbohydrate intake is made from whole grain flour, that is, whole wheat, maize/millet/sorghum”. Reduced consumption of foods with a high glycemic index was given as “ reduced intake of foods with high glycemic index” ( a list of foods that have a been known to lead to elevated blood sugar, comparable to intake of pure glucose). Reduced saturated and trans fat intake was represented as “use cooking oils”, which are of plant origin and have high contents of high-density lipoprotein,“reduce intake of margarine and or butter, “reduce intake of fats”, mainly cooking fats and fats from animal products such as lard. There was need to isolate margarine, a transfat and butter an animal fat from cooking fats, and combine them based on their use, being that they are used mostly as spreads rather than for cooking. Increased consumption of fruits and vegetables was given as, “includes vegetables in all meals” and “includes fruit in all meals”. Reduced sugar intake as, “reduce use of sugar in food and beverages” and “reduce intake of sugar flavoured drinks and snacks”. Reduced salt intakeas, “reduce intake of table salt”that is in cooking and when added to already cooked foods, and “reduce intake of salted snacks”. Finally, consistent adherence to the dietary plan, which is derived with the patient during counselling, as “adhere to diet plan”. These attributes were rated as “Never, Rarely, Sometimes, Often, and Always” in line with the respondents’ assessment of their own intake, with each respond represented by a corresponding number one to five, respectively.

3. Results

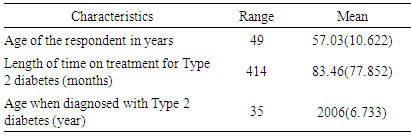
The respondents had a mean age of 57.03 (10.622), and had been receiving treatment for an average of 83.46 (77.852) months, or 6years. This indicates that all the respondents were within the inclusion criteria of male and female patients aged 35 years and above, who have had and have been managing Type 2 diabetes for at least six months.
Table 1. Inclusion characteristics of respondents
     
In addition, majority of the respondents were female, with a larger percentage being married. Most of them had also attained some form of formal education, with 41.8% of the respondents having attained secondary education, 35.4% primary education, 15.6% tertiary education and only 7.2% recording none, meaning they did not attend school. In addition, more than half of the participants had some form of occupation, with 46% running their own businesses (self-employed) while a smaller percentage (23.5%) were employed. The percentage of those with no meaningful engagement, that is unemployed, was higher than those employed at 29.9% (Table 2).
Table 2. Patients Demographic Characteristics
     
Most of the respondents were on diabetic medication, and had been advised on their diet. In assessing diet accessibility, factors other than perceptions that may influence adherence to the modified diet, referred to as socio-economic factors, in the operational framework, were analyzed. These included the percentage of respondents who could afford the modified diet (66.8%), those who agreed that the modified diet was culturally accepted (97.3%) and those who access the required foods in a nearby market (distance), or if it was grown within their area of residence (environment) or if they had to travel a long distance from their place of work to access the modified diet (workplace) at 90.4%, 84.3% and 83.6% respectively (Table 3).
Table 3. Diabetes management information
     
An assessment of genetic history of revealed that less than half of the participants, had a parent, sibling, spouse, child, grandparent, uncle or aunt with diabetes, indicating a family history of diabetes. The question was not specific on the type of diabetes, and in some cases, we could have more than one person with the condition.
The scores for the 12 attributes of recommended diet were transferred to an excel sheet, and for negative practices, where it was expected that the score should be “never” the values were reversed, so that “never” ranked highly as “always” in a positive practice. The scores were summed up and divided to derive a mean score for each participant. The least possible mean score was 1 or 20% adherence, in relation to the maximum score of 5 which was 100% adherence. Most of the participants had a mean adherence 4 or 80% adherence, with only 22.3% having a mean score of 5 or 100% representing “always” adhering to the modified diet (Figure 1).
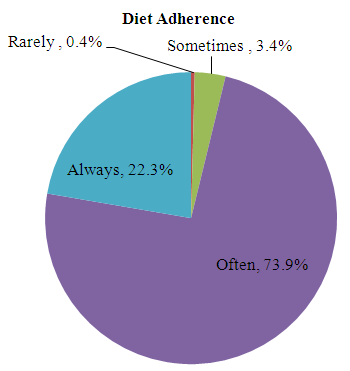
Figure 1. Distribution of respondents by mean level of adherence
The mean level of adherence derived was 4 which translates to “often” adhering to the modified diet. Further analysis to get a percentage level of adherence was done, by dividing the mean adherence level of 4 by the maximum adherence level of 5 and multiplying by 100 to get 80% adherence. The indicators were then subjected to factor analysis to derive a diet adherence pattern, which would indicate the order of contribution of each of the 12 diet recommendation statements to the adherence level observed, and be used to determine the focus of dietary management.
The test for sample size adequacy indicated that the sample size for each item was adequate based on Kaiser-Meyer-Olkin Measure of Sampling Adequacy and Bartlett’s Test of Sphericity (KMO=0.584, χ2 = 346.91, ρ<0.001). The KMO results implied that the proportion of variance (0.584) in the component (diet adherence) being measured could be accounted for by the underlying factors (attributes of recommended diet). The results from Bartlett’s Test of Sphericity indicate that the inter-correlation matrix between diet adherence and the attributes of recommended diet are significantly related (χ2 = 346.91, ρ<0.001). It therefore implies that factors extracted would account for a fair amount of variance in dietary adherence.
In factor analysis, it is hypothesized that in a given attribute such as diet adherence, there exists a number of common factors (internal attributes which are unobservable and cannot be directly measured) which influence the potentiality of the many surface attributes seen such as what is described in the 12 recommended diet statements. To be able to reflect the effects of the common factors, measures of the surface attributes are used. The score derived from measuring these surface attributes is assumed to be at least in part, the result of the influence of the common factor. The common factors therefore are used to understand and account for observed behaviour. Factor analysis derived these common factors and ascertained which of the 12 recommended diet statements reflect the effect of the derived factors. It is usually possible that one recommended diet statement might reflect more than one factor, depending on how the derived factors are correlated [39] [40].
To derive an adherence pattern, which would give direction on how fulfill adherence, factor extraction based on standard Eigen values set at 1 [39] [40], and varimax rotation, revealed that it was possible to derive five common factors that had a unit variance of more than one, and were possible diet adherence pockets among the study population. It means therefore that it was possible to extract five principle components that account for more variance, than that accounted for by each of the 12 recommended diet attributes. All the five factors of diet adherence, accounted for 37.62% of the variance in dietary adherence. The purpose of varimax rotation was to spread the observed variance (37.62%) among the five extracted components to be able to show clearly the recommended diet statements that loaded on each diet adherence factor.
The first diet adherence factor, adherence factor one (AF1), accounted for 11.8% of the total variance in dietary adherence, and was a reflection of two recommended diet statements, use of cooking oil and reduced intake of fats. The second diet adherence factor, adherence factor two (AF2), was able to account for 10.96% of the total variance in dietary adherence. It was in turn a reflection of five recommended diet statements; reduced intake of foods with high glycemic index, reduced intake of margarine and or butter, reduced use of sugar in beverages, reduced intake of sugar flavoured drinks and snacks, and reduced intake of salted snacks.
The third diet adherence factor, adherence factor three (AF3), accounted for 5.79% of the total variance in dietary adherence and was a reflection of two recommended diet statements indicators. These were carbohydrate intake from whole grain and reduced intake of table salt. The fourth and fifth diet adherence factors, adherence factor four (AF4) and adherence factor five (AF5), in that order, were able to account for 4.99% and 4.06% respectively of the total variance in dietary adherence. Adherence factors AF4 and AF5 were a reflection of recommended diet statements which “include fruits in all meals” and “include vegetables in all meals”, respectively (Table 4).
Table 4. Possible diet adherence factors
     
Further discriminate analysis revealed that “use of cooking oil” and reduced intake of fat, as predictors of diet adherence factor one (AF1) were able to account for 97.6% of its total variance, (R2=0.976, F= 4493.096, ρ<0.001). However, as seen in table 4, “use of cooking oil” was a more powerful predictor of AF1, (β=0.82, t=60.53, ρ<0.001), compared to reduce intake of fat (β=0.237, t=17.469, ρ<0.001). It implies that as use of cooking oil increases by 1 standard deviation (0.897), adherence factor one increases by 0.82 standard deviations, when all other predictor effects are held constant (Table 5).
Table 5. Diet adherence factors and their respective recommended diet statements
     
Linear regression analysis for adherence factor two, AF2, revealed that, reduced intake of foods with high glycemic index, reduced intake of trans fats, reduced use of sugar in beverages, reduced intake of sugar flavoured drinks and snacks and reduced intake of salted snacks, accounted for 95.2% of its total variance (R2=0.952, F=873.603, ρ<0.001). However, reduced intake of foods with high glycemic index was more powerful as a predictor of AF2, (β=0.49, t=29.694, ρ<0.001). Such foods tend to cause a rapid rise in blood sugar levels. It was followed in order of power of prediction, by reduced use of sugar in beverages (β=0.274, t=17.008, ρ<0.001), reduced consumption of sugar flavoured drinks and snacks (β=0.263, t=16.042, ρ<0.001), reduced intake of table salt (β=0.242, t=14.8, ρ<0.001) and reduced intake of margarine and or butter (β=0.241, t=15.453, ρ<0.001). The focus to control blood sugar and lower the risk of complication development, AF2, is by reducing intake of foods with a high glycemic index, and to a lesser extent, reducing use of sugar in beverages, reducing consumption of sugar flavoured drinks and snacks, reducing intake of salt and reducing use of margarine and or butter.
The same analysis for adherence factor three, AF3, revealed that recommended diet statements, carbohydrate intake is from whole grain and reduced intake of table salt were able to account for 76.8% of the total variance of adherence factor three, (R2=0.768, F=365.944, ρ<0.001). However, reduce intake of table salt was a more powerful predictor of adherence factor three (β=0.645, t=18.937, ρ<0.001), compared to carbohydrate intake is from whole grain (β=0.429, t=12.579, ρ<0.001). The focus for adherence factor three was based on the belief that to lower risks of complications development, they will need to focus more on reducing salt intake and to a lesser extent on intake of whole grain carbohydrate.
Recommended diet statement, includes fruits in all meals accounted for 74.9% of the total variance of adherence factor four, AF4 (R2= 0.749, F=660.106, ρ<0.001) and was able to significantly predict adherence factor four (β=0.866, t=25.693, ρ<0.001).
Finally for adherence factor five AF5, the recommended diet statement, includes vegetables in all meals was able to account for 40.4% of its total variance (R2= 0.404, F=150.574, ρ<0.001) and was able to significantly predict adherence factor five (β=0.637, t=12.271, ρ<0.001) (Table 5). For adherence factor four and five, whose focus is more on healthy eating to prevent infections, the belief is that as they consume more fruits and vegetables in their meals, they will be able to stay healthy.

4. Discussion

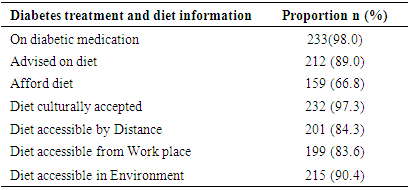
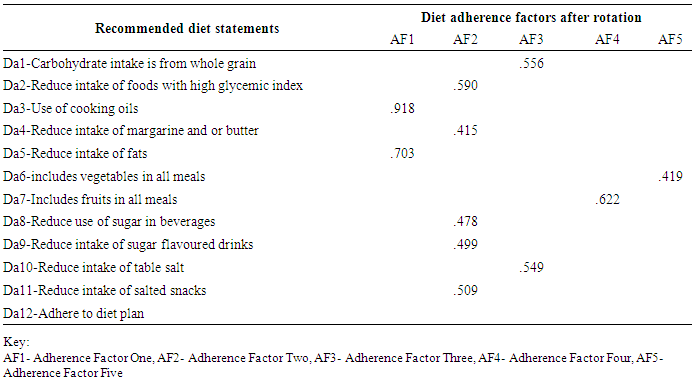
The study revealed a mean adherence level of 4 out of 5, which translates to 80%. The implication is that patients managing Type 2 diabetes will adhere “often”, but not always to their diet recommendations. The fact that majority of the patients, 98.3%, were taking medication, implies that diet alone was insufficient to control blood sugar, supports this finding. In agreement to this study results, other studies have found that due to inconsistency in adherence to diet, patients with Type 2 diabetes have to take medication to control blood sugar [41] [42] [43]. In both cases therefore, non-adherence to diet may lead to the use of medication to control blood sugar, making patients with Type 2 diabetes vulnerable to extra costs they incur in medical care, more so in Kenya, which apparently receives inadequate funds for diabetes prevention and care [5]. Furthermore, patients with Type 2 diabetes preferred taking medication to control blood sugar as opposed to diet, with the belief that medication would lower the consequences of diabetes, was easier to take than preparing a meal, less distressful to adhere to and led to development of fewer complications [21]. However, World Health Organization (WHO) advices that for effective blood glucose control, then a complete adherence to a combination of medication, diet and exercise is required [20], except in cases where age and other conditions restrict the type of diet, one can take [44]. On the other hand though, other studies have found that the side effects of prolonged medication use eventually lead to non-adherence [45] [46] [47], indicating the need for more focus on dietary adherence to reduce the reliance on medication for blood glucose and disease progression control.
Further analysis on adherence pattern revealed five possible adherence factors, which accounted for 37.62% of the total variance of dietary adherence. Adherence factor one, which was reflected in increased use of oils and reduced intake of saturated and Trans fat was the highest contributor (11.8%) to diet adherence. Saturated and trans fats found in animal sources and solidified plant oils respectively, contribute to high levels of low-density lipoprotein cholesterol, which causes cardiovascular diseases. This adherence factor appeared to focus on controlling onset of other complication such as cardiovascular diseases [14] [24] [48]. Adherence factor two, reflected in reduced intake of foods with a high glycemic index, reduced sugar intake, reduced intake of margarine and or butter and reduced intake of salted snacks accounted for 10.96% of adherence. These recommendations, which are geared towards direct control of blood glucose and blood pressure [24] [49] [50] [51] [52], appeared to be a result of the need to control blood glucose and reduce the complications of Type 2 diabetes.
Adherence factor three, characterized by reduced salt intake and an increased intake of whole grain carbohydrate was aimed at lowering the risk to complications development [24] [26] [48] [50] [52] [53] [54] [55] [56]. The focus for adherence factor three appeared to focus on maintaining blood pressure and lowering the risk of complications. Adherence factors four and five, which accounted for less than 10% each of adherence, were a measure of increased fruit and vegetable consumption in that order. These results, in which consumption of whole grain carbohydrates, fruits and vegetables were less contributors to the total adherence, agree with another study, which revealed a low adherence to plant-based diets [57]. In this case, a plant-based diet was defined as the intake of whole grain, plant-based foods and the exclusion of meat, dairy products, eggs, refined and processed foods, from the diet [58]. This displays an adherence pattern, in which there is a need to control progression to cardio vascular diseases, followed by control of blood glucose and the development of complications, then lowering the risk of complications and general health. The established adherence pattern is in line with the focus as given in the Kenya National Clinical Guidelines for Management of Diabetes (NCGMD), for the secondary management of Type 2 diabetes, except for the order.
In the Kenya NCGMD, secondary management of Type 2 diabetes involves the early detection and management of complications, through good blood glucose control. Before a diet plan is drawn, tests are done to ascertain blood sugar, blood pressure and blood lipid levels. First, there is need to maintain blood glucose control to as near normal as possible and prevent the development of complications. In the case of the study results, this was the second focus. In the Kenya NCGMD, the second focus is to maintain a lipid and lipoprotein level that reduces the risk of cardiovascular disease, which was the first focus according to the study. Studies show that the control of LDL cholesterol helps to reduce the development of cardiovascular disease [14] [48]. The third focus for NCGMD is to maintain blood pressure levels to as near normal as possible and lower the risk of complications development, which was the same for this study.
This study assessed the level of adherence to diet in the management of Type 2 diabetes, information that has been inadequate in Kenya as a country [20], in the hope that it will be used to intensify efforts in managing the condition. It recommends that efforts be made to further increase diet adherence levels to at least 95% in dietary management of Type 2 diabetes, for all patients managing the condition. In addition, in controlling of CVDs, emphasis for this group should be laid on first reducing overall fat intake. This will ensure a reduction in complications, loss of life and a reduced cost in the management of Type 2 diabetes.
The results revealed a mean adherence level of 4 or 80% adherence. This is because majority of the participants had a mean adherence level of four, with less than one quarter having a mean adherence level of 5 or 100% adherence. Further analysis revealed an adherence pattern, whose main focus was first, to control the onset of cardiovascular disease, then the control of blood glucose and the development of complications. Finally to lower the risk of complication development and maintain general good health. This is in line with the main purposes of diet modification in secondary management of Type 2 diabets as outlined in the Kenya NCGMD. The trend estblished is similar to the recommendations given by the National government in Kenya through its NCGMD, an indication that they are in practice.
However, the Kenya NCGMD, does not consider non-adherence and for that reason has not given instructions on how to handle it. Even though 89% of the respondents had received diet advice, and 66.8% acknowledged that they could afford the recommended diet, only 22.3% said they always adhere to diet. In another study, to assess diet adherence, care providers were more confident with their ability to instruct patients on diet than in their ability to help them make these changes, and 40% of the care providers believed that their patients were unable to follow a diet regularly [59]. The implication is that patients who receive diet advice and even those who can afford it, will not necessarily adhere.
The indication is that further efforts to identify reasons for non-adherence have to be made. This does not come with the Kenya NCGMD, yet is vital if adherence levels have to improve. Different studies have shown that barriers to healthy eating are vast [22] [60] including cynicism to government health messages [61]. Other Studies have shown that initiatives such as encouraging family support, where a family member accompanies the patient for office visits to the clinic enhances diabetes self-management [60] [62]. One purpose of the Kenya NCGMD is to assist health care providers to identify locally appropriate and sustainable ways of improving diabetes management in Kenya [4]. The author of this research report recommends that part of these ‘locally appropriate and sustainable ways’ include facilitators of diet adherence and that they be includedin the guidelines to enhance diet adherence.

References

[1]  Shaw, J. E., Sicree, R. A., & Zimmet, P. Z. (2009). Global Estimates of the Prevalance of Diabetes 2010 and 2030. Diabetes Resolution Clinical Practice, 4-14.
[2]  Mario, A., & Sridavi, A. (2008). Diabetes in Sub Saharan Africa: Kenya, Mali, Mozambique, Nigeria, South Africa and Zambia. International Journal of Diabetes in Developing Countries, 101-108.
[3]  Motala, A., & Ramaiya, K. (2010). Diabetes: The Hidden Pandemic and Its Impact on Sub- Saharan Africa. Diabetes Leadership Forum (pp. 1-48). Johannesburg: Novo Nordisk.
[4]  National Diabetes Control Programme. (2010, July). Kenya National Diabetes Strategy 2010-2015. Nairobi, Nairobi, Kenya: Ministry of Public Health and Sanitation.
[5]  McFerran, L. (2008). Obstacles to Diabetes Care in Kenya. Medical Journal of Therapeutics Africa, 2(2), 127-129.
[6]  Kayima, J. K. (2002). The Changing Spectrum of Type 2 Diabetes Mellitus. East African Medical Journal, 397-399.
[7]  Dropkin, B. M. (2010). An approaching epidemic: Exploring Diabetes Awareness and Care in Mombasa, Kenya. Unpublished paper, School for international training, Kenya.
[8]  Roglic, G., & Unwin, N. (2010). Mortality Attributable to Diabetes: Estimates for the Year 2010. Diabetes Resolution Clinic Practice, 87(1), 15-19.
[9]  Boyle, J. P., Theodore, T. J., Gregg, E. W., Barker, L. E., & Williamson, D. F. (2010). Projection of the year 2050 Burden of Diabetes in the US Adult Poppulation: Dynamic Modeling of Incidence, Mortaltiy and Prediabetes Prevalence. Population Health Metrics, 8(29).
[10]  Gregg, E. W., Gu, Q., Williams, D., de Rekeneire, N., Cheng, Y. J., Geiss, L., & Engelgau, M. (2007). Prevalence of Lower Extremity Associated with Normal Glucose Levels, Impaired Fasting Glucose and Diabetes among US Adults aged 40 or Older. Diabetes Resolution Clinic, 458-488.
[11]  Crandall, J. P., Knowler, W. C., & Kahn, S. E. (2008). The Prevention of Type 2 Diabetes. National Clinical Practical Endocrinal Metabolism, 4(7), 382-393.
[12]  Gillies, C. L., Abrams, K. R., Lambert, P. C., Cooper, N. S., Sutton, A., Hsu, R. T., & Khunti, K. (2007). Pharmacological and Lifestyle Interventions to Prevent or Delay Type 2 Diabetes in People with Impaired Glucose Tolerance. British Medical Journal Doi: 10;1136/bmj.39063.689375.55.
[13]  Makrilakis, K., & Katsilambros, N. (2008). Prediction and Prevention of Type 2 diabetes. Hormones (Athens), 2, 22-34.
[14]  Chorzempa, A. (2006). Type 2 Diabetes Mellitus and It's effects on Vascular Disease. Journal of Cardiovascular Medicine, 21(6), 485-492.
[15]  Cornier, M.-A., Dabelea, D., Hernandez, T. L., Lindstrom, R. C., Steig, A. J., & Stob, N. R. (2008). The Metabolic Syndrome. Endocrine Review, 29(7), 777-822.
[16]  Steyn, N. P., Lambert, E. V., & Tabana, H. (2009). Nutrition Interventions for the Prevention of Type 2 Diabetes. Conference on 'Multidiscplinary Approaches to Nutritional Problems' Symposium on "Diabetes and Health" (pp. 55-70). Cape Town: Nutrition Society.
[17]  Miller, C. K., Edwards, L., Kissling, G., &Sanville, L. (2002). Evaluation of a Theory- Based Nutrtion Intervention for Older Adults with Diabetes Mellitus. Journal of America Medical Association, 1069-1074, 1079-1081.
[18]  Gutschall, M. D., Miller, C. K., Mitchell, D. C., & Lawrence, F. (2009). A Randomised Behavioural Trial Targetting Glycaemic Index Improves Dietary Weight and Metabolic Outcomes in Patients with Type 2 Diabetes. Public Health Nutrition, 1-9.
[19]  Copell, K. J., Kataoka, M., Williams, S. M., Chrisholm, A. W., Vorgers, M. S., & Mann, J. L. (2010, May 19). Nutrition Intervention in Patients with Type 2 Diabetes Who are Hyperglycaemic Despite Optimised Drug Treatment- Lifestyle Over and Above Drugs (LOADD) Study: Randomised Control Trial. Otago, Dunedin, New Zealand.
[20]  Sabate, E. (2003). Adherence to Long Term Therapies: Evidence for Action. Geneva: World Health Organisation.
[21]  Broadbent, E., Donkin, L., & Stroh, J. C. (2011). Illness and Treatment with Adherence to Medications, Diet and Excercise in Diabetic Patients. Diabetes Care, 34, 338-340.
[22]  Adewale, B. G., Langalibalele, H. M., Malete, H. N., Govendar, I., & Ogunbanjo, A. G. (2013). Non-Adherence to Diet and Excercise Regime Amongst Patients with Type 2 Diabtes Mellitus Attending Extension II Clinic in Botswana. Care Farm Medicine, 1-6.
[23]  Peyrot, M., Rubin, R. R., Lauritzen, T., Snoek, F. J., Mathews, D. R., & Skovland, S. E. (2005). Psychological Barriers to Improve Diabetes Management: Results of the Cross- National Diabetes Attitudes, Wishes and Needs (DAWN) Study. Diabetic Medication, 1379-1385.
[24]  Bantle, J. P., Rossett, J. W., Albright, A. L., Apovian, C. M., Clark, N. G., Franz, M. J., . . . Wheeler, M. L. (2008). Nutrition Recommendations and Interventions for Diabetes: A Position Statement of the American Diabetes Association. Diabetes Care, 61-78.
[25]  Bloomgarden, T. Z. (2009). Glycemic Treatment in Type 1 and 2 Diabetes. Diabetes Care, 2549-2555.
[26]  Boden, G., Sargrad, K., Homko, C., Mozzoli, M., & Stein, P. T. (2005). Effects of a Low Carbohydrate Diet on Appetite, Blood Glucose Levels, and Insulin Resistance in Obese Patients with Type 2 Diabetes. Ann International Medicare, 403-411.
[27]  CDC. (2004). Primary Prevention of Type 2 Diabetes Mellitus by Lifestyle Interventions: Implications for Health Policy. Ann Family Medicine, 957-958.
[28]  Esposito, K., Kastorini, C. M., Panagiotakas, D. B., & Giugliano, D. (2010). Prevention of Type 2 diabetes by Dietary Pattern: A Systematic Review of Prospective Studies and Meta-Analysis. Epub, 471-476.
[29]  Klein, S., Sheard, N. F., Pi-Sunyer, X., Daly, A., Wylie-Rosset, J., Karmen, K., & Clark, G. N. (2004, August). Weight Management Through Lifestyle Modification for the Prevention and Management of Type 2 Diabetes: Rationale and Strategies. Diaibetics Care, 27(8), 2067-2073.
[30]  Savoca, M., & Miller, C. (2001). Food Selection and Eating Patterns: Themes Found Among People with Type 2 Diabetes Mellitus. Journal of Nutrition Education, 224-233
[31]  Thomas, D. E., & Elliot, E. J. (2010). The Use of Low Glycaemic Index Diets in Diabetes Control. British Journal of Nutrition, 797-802.
[32]  Davis, S. M., & Miller, K. C. (2006). Education Needs Regarding the Glycemic Index in Diabetes Management. Top Clinical Nutrtion, 17-25.
[33]  Schulze, M., Liu, S., Rimm, E. B., Manson, J. B., Willet, W. C., & Hu, F. B. (2004). Glycemic Index, Glycemic Load and Dietary Fibre Intake and Incidence of Type 2 Diabetes in Younger and Middle Aged Women. American Journal of Clinical Nutrition, 348-356.
[34]  Wardlaw, G. M. (2003). Contemporary Nutrtion, Issues and Insights (Fifth edition ed.). New York: McGraw-Hill.
[35]  Jenkins, D., Nguyen, T., Corrigan, S., Banach, M., Ares, S., Mitchel, S., & Nguyen, T. (2008). Effect of a Low - Glycemic Index or a High - Cereal Fiber Diet on Type 2 Diabetes. Journal of American Medical Association, 300(23), 2742-2753.
[36]  PPOA. (2010). New Nyanza Provincial General Hospital Procurement Review. Nairobi: Public Procurement Oversight Authority.
[37]  Zepeda, E., Leigh, F., Ndirangu, L., Omollo, J., & Wainaina, S. (2013). Discussion Paper: Kenya's Youth Employment Challenge. New York: UNDP
[38]  Yamane, T. (1967). Statistics: An Introductory Analysis. New York: Harper and Row.
[39]  Gorsuch, R. L. (1983). Factor Analysis (2nd ed.). Hillsdale: Lawrence Erbaum Associates.
[40]  Tabachnick, B. G., & Fidell, L. S. (1996). Using Multivariate Statisitics (3rd ed.). New York: Harper Collins.
[41]  American Diabetes Association. (2013). Standards of Medical Care in Diabetes Management. Diabetes Care, 511-566.
[42]  Emilio, L., Perez, G., Avarez, M., Dilla, T., Gullen, V. G., & Beltran, D. O. (2013). Adherecnce to Therapies in Patients with Type 2 Diabetes. Diabetes Care, 175-194.
[43]  Grant, R. W., Pirragha, P. A., Meigs, J. B., & Singer, D. E. (2004). Trends and Complexity of Diabetes Care in the United States from 1991 to 2000. Arch International Medicine, 1134-1139.
[44]  Turcatto, H., Faria, G., Fernanda, F., Rodriguez, L., Zanetti, M. L., Flavio, M., . . . Damasceno, C. (2013). Factors Associated with Adherence to Treatment of Patients with Diabetes Mellitus. Acta Paul Enferm, 231-237.
[45]  Pollack, M. F., Purayidathe, F. W., Bolge, S. c., & Williams, S. A. (2010). Patient Reported Tolerability Issues with Oral Antidiabetes Agents Associated with Adherence Treatment Satisfaction and Health Related Quality of Life. Diabetes Resolution Clinic Practise, 204-210.
[46]  Hauber, A. B., Mohamed, A. F., Johnson, F. R., & Falvey, H. (2009). Treatment Prefferences and Medication Adherence of People with Type 2 Diabetes Using Oral Glucose Lowering Agents. Diabetes Medication, 416-424.
[47]  Donnelly, L. A., Morris, A. D., & Pearson, E. R. (2009). Adherence in Patients Transferred From Immediate Release Metformin to a Sustained Release Formulation: A Poppulation Based Study. Diabetes Obesity Metabolism, 338-342.
[48]  CDC. (2011). National Diabetes Fact Sheet: National Estimates and General Information on Diabetes and Prediabetes in the United States. Atlanta GA: US Department of Health and Human Services.
[49]  Fagherazzi, G., Vilier, A., Saes, S. D., Lajous, M., Balkau, B., & Clavel, C. F. (2013). Consumption of Artificially and Sugar- Sweetened Beverages and Incidences of Type 2 Diabetes in the Etude Epidemiologique Aupre des Femmes de la Mutuelle Generale de Education Nationale. Amercian Journal of Nutrition, 517-523.
[50]  Davison, K. A., Negrato, C. A., Cobas, R., Matheus, A., Tannus, L., Palma, C. S., & Araujo, N. (2014). Relationship Between Adherence to Diet, Glycemic Control and Cardiovascular Risk Factors in Pateints with Type 1 Diabetes; A Nation Wide Survey in Brazil. Nutrition Journal, 1-19.
[51]  Gannon, M. C., & Nuttall, F. Q. (2006). Control of Blood Glucose in Type 2 Diabetes without Weight Loss by Modification of Diet Composition. Minnesota: Nutrition and Metabolism.
[52]  Greenwood, D. C., Threapleton, D. E., Evans, C. E., Cleghorn, C. L., Nykjaer, C., Woodhead, C., & Burley, V. J. (2013). Glycemic index, Glycemic Load, Carbohydrates and Type 2 diabetes. Diabetes Care, 4166-4171.
[53]  Gonzalez, C. L., Barcadi, G. M., & Jimenez, C. A. (2011). Effects of Low Carbohydrates Diet on Weight and Glycemic Control Among Type 2 diabetes Individuals: A systemic Review of RCT Greater Than 12 Weeks. Nutrition Hospitality, 1270-1276.
[54]  Fung, T. T., Chuive, S. E., McCullough, M. L., Rexrode, K. M., Logroscino, G., & Hu, F. B. (2008). Adherence to a DASH diet and Risk of Coronary Heart Disease and Stroke in Women. Arch International Medicine, 713-720.
[55]  Hodge, A. M., English, D. R., O'dea, K., & Giles, G. G. (2004). Glycemic Index and Diet Fibre and the Risk of Type 2 diabetes. Diabetes Care, 2701-2706.
[56]  Cho, S. S., Qi, L., Fahey, G., & Klurfed, D. (2013). Consumption of Cereal fibre, Mixture of Whole Grains and Bran, and Whole Grains and Risk Reduction in Type 2 Diabetes, Obesity and Cardiovascular Disease. American Journal of Clinical Nutrition, 594-619.
[57]  Lee, V., Mckay, T., & Arden, C. (2015). Awarenes and Perceptions of a Plant Based Diet for Treatment and Management of Type 2 Diabetes in a Community Education Clinic: A Pilot Study. Journal of Nutrition Metabolism, 1-6.
[58]  Tuso, P. J., Ismail, M. H., & Bartolotto, C. (2013). Nutritional Updates for Physicians: Plant Based Diets. Permanente Journal, 61-66.
[59]  Marshal, H., Sandy, C., Lee, J., Melinda, J. D., Harrison, J., Koppert, J., . . . Chiu, S.-C. (2001). Barriers to Providing Diabetes Care in Community Health Centres. Diabetes Care, 268-274.
[60]  Wen, L., Parchman, M., & Shephard, M. (2004). Family Support and Diabetes Barriers among Older Hispanic Adults with Type 2 Diabetes. Family Medicine, 423-430.
[61]  Gough, B., & Conner, M. (2006). Barriers to Healthy Eating amongst Men: A Qualitative Analysis. Social Science & Medicine, 387-395.
[62]  Mayberry, L. S., & Osborn, C. Y. (2012). Family Support, Medical Adherence and Glycemic Control Among Adults with Type 2 Diabetes. Diabetes Care, 1239-1245.