International Journal of Diabetes Research

p-ISSN: 2163-1638    e-ISSN: 2163-1646

2015;  4(3): 49-57

doi:10.5923/j.diabetes.20150403.02

Euthyroid Nodular Disease in Relation to Insulin Resistance

Entesar Omar Ahmad El Saghier1, Zeinab Abdel Bassit Hassan1, Areej Mahmoud Ahmed Shawky2

1Endocrinology and Metabolism department, Faculty of Medicine for girls, Al-Azhar University, Egypt

2The national institute of Nutrition, Egypt

Correspondence to: Entesar Omar Ahmad El Saghier, Endocrinology and Metabolism department, Faculty of Medicine for girls, Al-Azhar University, Egypt.

Email:

Copyright © 2015 Scientific & Academic Publishing. All Rights Reserved.

Abstract

Background: Nodular thyroid disease is a common endocrine problem. There is scarce information on the effect of hyperinsulinemia on the development of thyroid nodules. Objectives: to assess the frequency of insulin resistance (IR) in patients with euthyroid nodular thyroid disease, and to investigate any possible association between insulin resistance and thyroid functional and/or morphological changes within a sample of Egyptian patients. Research design and methods: This is a cross-sectional study including sixty subjects having euthyroid nodular thyroid disease, their ages ranged from 25 to 60 years old. They were purposively selected and evaluated for manifestations of IR. For all subjects, waist circumference (WC) and body mass index (BMI) were measured. Serum TSH, FreeT4, FreeT3, fasting plasma glucose, and fasting serum insulin (FI) were measured. Degree of IR was calculated using Homeostasis model Assessment-index (HOMA-index). Thyroid ultrasound (US) was performed and thyroid volume (TVml), nodule volume (NVmm), and nodular number (NN) were measured. Results: According to results of HOMA-Index, 56.70% of studied subjects had levels >2.7 denoting significant IR. No significant difference was found between subjects with and those without IR as regards thyroid profile. Subjects with IR had more frequent thyroid nodules besides greater TV and NV. Among the studied parameters, multivariate linear regression analysis revealed that, TV was mainly associated with FI and HOMA-index (p<0.000, p<0.002, respectively). The main predictors for developing more than one nodule were BMI, TV, HOMA-index, and FI. None of the studied parameters had an association with NV. Conclusions: IR is common among Egyptian patients with euthyroid nodular thyroid disease. Thyroid gland is a novel vulnerable tissue that may be affected by IR, in the form of increased thyroid volume and higher risk of nodule formation.

Keywords: Thyroid nodules, Insulin resistance, HOMA-Index

Cite this paper: Entesar Omar Ahmad El Saghier, Zeinab Abdel Bassit Hassan, Areej Mahmoud Ahmed Shawky, Euthyroid Nodular Disease in Relation to Insulin Resistance, International Journal of Diabetes Research, Vol. 4 No. 3, 2015, pp. 49-57. doi: 10.5923/j.diabetes.20150403.02.

1. Introduction

Insulin resistance (IR) is a pathological condition characterized by an inadequate physiological response of peripheral tissues to circulating insulin which results in metabolic and hemodynamic disturbances [1]. IR is a major component of the metabolic syndrome, which denotes a constellation of risk factors that generally occur together and increase the risk for various diseases, including type 2 diabetes and several other metabolic diseases [2, 3], cerebrovascular and coronary artery disease [4, 5] neuro-degenerative disorders[6], infectious diseases [7] and cancer [8, 9].
Although not all obese individuals are insulin resistant, the more overweight/obese a non diabetic individual is, the greater the likelihood that they will be insulin resistant/hyperinsulinemic. [10, 11]
Thyroid nodularity is a common endocrine problem. The incidence of thyroid nodules is approximately 4-7% in adults [12]. With the widespread use of the high-frequency ultrasound scan, the detection rate of thyroid nodules is increasing [13]. Most of the sonographically detected thyroid nodules are benign [14], and less than 7% of nodules reveal malignancy [15].
It is well known that insulin acts as a growth factor that stimulates cell proliferation. However, the reported data on the effects of hyperinsulinemia on the thyroid gland is scarce [1].
The current study was carried out to assess the frequency of IR in patients with euthyroid nodular thyroid disease, and to investigate any possible association between IR and thyroid functional and/or morphological changes within a sample of Egyptian subjects.

2. Subjects & Methodology

2.1. Study Design and Population

This was a cross-sectional study. A total number of 60 subjects having euthyroid nodular thyroid disease were purposively selected from the endocrine outpatient clinic at Al Zahraa University Hospital, Cairo (Iodine sufficient area) [16], through the period from November 2013 to January 2015. Their ages ranged from 25 to 60 years, 17 were males and 43 were females.

2.2. Ethical Issues

All subjects were informed of the general aim of the study and their participation in the study was fully voluntary. Confidentiality of collected data was guaranteed to participants and an informed consent had been obtained pre-enrollment.

2.3. Inclusion Criteria

Subjects having normal thyroid profile (namely, TSH, Free T4 and FreeT3) besides nodular thyroid morphology (elicited clinically and by ultrasound) constituted the study subjects.

2.4. Exclusion Criteria

Patients with thyroid dysfunction, those on thyroid medications, patients with diabetes or any debilitating diseases, and history of neurological or psychological illness (depression, epilepsy, schizophrenia) that may have an effect on thyroid profile, were excluded from the study.

2.5. Methodology

All patients included in the study were subjected to the following:
- Detailed medical history, full physical examination including appropriate examination of thyroid gland, inspection for clinical signs of IR like central obesity, acanthosis nigricans and skin tags.
- Body Mass Index (BMI) was obtained by dividing the body weight (kg) by the square of height (m) [17]. Waist circumference (WC) in cm was measured at a point midway between the lowest rib plane and the iliac crest [18].

2.6. Laboratory Investigations

Venous samples were drawn after an overnight fasting for measurement of:
TSH, free T3 and free T4: those were measured using ELISA Reader (SLT. Spectra, 2000). TSH (Normal range: 0.4-4.0UI\ml), FT4 (Normal range: 0.8-2ng\dL), FT3 (Normal range: 1.3-5Pg\mL).
Fasting plasma glucose was measured by the glucose oxidase technique (Stanbio Glucose Liqui color (oxidase) Procedure NO.1070), normal range (70-96mg\dL).
Fasting serum insulin was assayed by ELISA Reader (EIA-2935), normal range (2-25µU\mL).
IR was estimated based on calculation of the homeostasis model assessment (HOMA) index for each patient. This was done using the formula: (fasting plasma insulin in Iu/ml × fasting plasma glucose in mmol/l ÷ 22.5). IR was defined as having cut-off level of HOMA-index >2.7 [19]. According to this cut-off, subjects were classified into:
§ Group (1): Patients having IR, they all had HOMA-index>2.7.
§ Group (2): Patients without IR, they had HOMA-index<2.7.

2.7. Thyroid Ultrasound Scanning (US)

Thyroid Ultrasound scanning (US) was performed to all patients by the same radiologist, using a 7.5 MHz linear transducer (Logiq 5 Pro, GE Medical Systems, WI, USA). Thyroid volume (TV ml) was calculated by the elliptical shape volume formula (0.479×length ×width× height) for each lobe (normal thyroid volume: 7.9-15.7ml). Nodule volume (NV mm) was calculated using the formula for the volume of a prolate ellipse (0.53×length× width ×diameter). Measurement of the volume of one nodule was performed if the thyroid gland contained one nodule, and the volume of the largest nodule if there were more than one nodule. The number of nodules (NN) was also evaluated by US. [20]

2.8. Statistical Analysis

Data were collected, coded, revised and entered to the Statistical Package for Social Science (IBM SPSS) version 20. The data were presented as number and percentages for the qualitative data and mean, standard deviations and ranges for the quantitative data. Chi-square test was used in the comparison between two groups with qualitative data and Fisher exact test was used instead of the Chi-square test when the expected count in any cell was found to be less than 5. Independent t-test was used in the comparison between two groups with quantitative data and parametric distribution. Spearman correlation coefficients were used to assess the significant relation between two quantitative parameters in the same group. Multivariate linear regression analysis was used to assess the predictors of nodule volume (NV) while the multivariate logistic regression analysis was used to assess the predictors of number of nodules. The confidence interval was set to 95% and the margin of error accepted was set to 5%. The p-value was considered significant at value P < 0.05 and non significant at P > 0.05.

3. Results

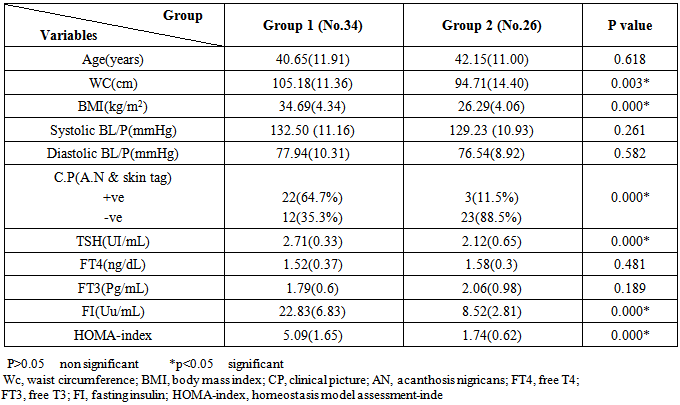
Demographic, clinical and biochemical data of the whole studied subjects had been described in table (1). According to the cut-off level of HOMA-Index >2.7, the whole subjects had been classified into group 1, which included subjects with IR, (34 out of 60, thus comprising 56.70%), and group 2, which included those without IR, (26 out of 60, comprising 43.30% of all studied subjects). Group 1 had significantly higher BMI and WC than group 2 (34.69±4.34 kg/m2 vs 26.29±4.06 kg/m2, p<0.00 and 105.18±11.36 cm vs 94.71±14.40 cm, p<0.003 respectively). Clinical signs of IR was more frequently detected among group 1 compared to group 2 (64.7% vs 11.5% respectively, p<0.00). Thyroid profile was normal in all studied subjects, however, mean TSH levels was higher in group 1 compared to group 2 (2.71±0.33 uIU/ml vs 2.12±0.65 uIU/ml respectively, p<0.00). No significant difference was found between groups 1 and 2 as regard FT4 (1.52±0.37 ng/ml and 1.58±0.3 ng/ml respectively, p=0.481) and FT3 (1.79±0.6 pg/ml and 2.06±0.98 pg/ml respectively, p=0.189).
Table (1). Comparison of demographic, clinical, and biochemical data between group 1 and group 2
     
Thyroid morphology of the whole subjects had been presented in table (2). Mean TV and mean NV were 14.99±2.7 ml and 0.10±0.05 mm, respectively. Among the whole subjects, 30% had one nodule, 18.3% had two nodules, and 51.7% had >2 nodules. Group1 had significantly greater TV than group 2 (16.83±1.7 ml vs 12.57± 1.67 ml, p<0.00). Also, they had greater NV [0.13±0.0mm vs 0.08±0.01mm, p<0.00]. As regards number of nodules within the thyroid gland, group 2 had higher percent of one nodule, than group 1 (2.9% vs 65.4%). Group 1 had higher percent of distribution of ≥ 2 nodules than group 2 (2 Nodules were found in 20.6% vs 15.4% and > 2 Nodules were found in 76.5% vs 19.2, p<0.00).
Table (2). Comparison between group 1 and 2 as regards thyroid U/S parameters
     
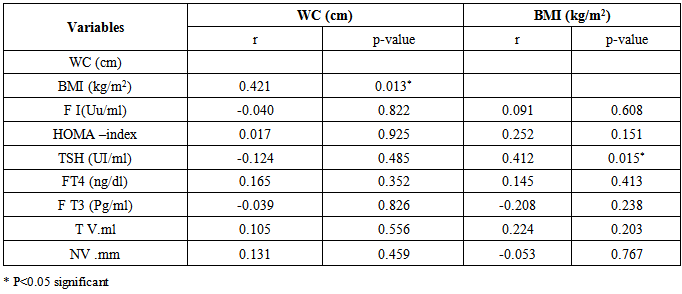
Among the group with IR there was significant positive correlation between BMI and WC (r =0.421, p<0.05) and between BMI and TSH levels (r=0.412, p<0.05) (table 3). Significant positive correlation was also detected between HOMA-index, FI and TSH levels (r=0.702, p<0.000 and r=0.615, p<0.000, respectively), between HOMA-index, FI and TV (r=0.958, p<0.000 and r=0.961, p<0.000, respectively) and between HOMA-index, FI and NV (r=0.613, p<0.000 and r=0.646, p<0.000 respectively) (table 4).
Table (3). Correlation of WC and BMI with relevant clinical, biochemical and thyroid U/S parameters in group with IR
     
Table (4). Correlation of HOMA-index and FI with thyroid profile, and thyroid u/s parameters in group with IR
     
There was a significant positive correlation between TSH and both TV and NV (r=0.572, p<0.00 and r= 0.407, p<0.001 respectively) (table 5).
Table (5). Correlation of serum TSH with TV, NV, NN in all studied subjects
     
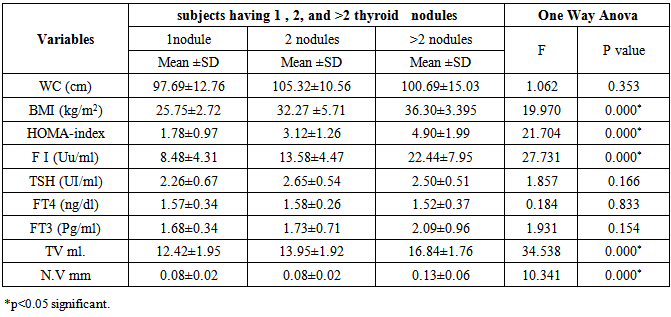
Table (6) showed that patients harboring >2 nodules had greater BMI than those with 2 or 1 nodule (36.30±3.39 vs 32.27±5.71 and 25.75±2.72 respectively, p<0.000). Also, they had higher HOMA–index and FI levels [(4.90±1.99 vs 3.12±1.26 and 1.78±0.97 respectively, p<0.000) and (22.44±7.95 vs 13.58±4.47 and 8.48±4.31 respectively, p<0.000)]. Also they had greater TV and NV [(16.84±1.76 vs 13.95±1.92 and 12.42±1.95 respectively, p<0.000) and (0.13±0.06 vs 0.08±0.02 and 0.08± 0.02 respectively, p<0.000)].
Table (6). Comparison between subjects having 1, 2, and >2 thyroid nodules as regards relevant studied parameters
     
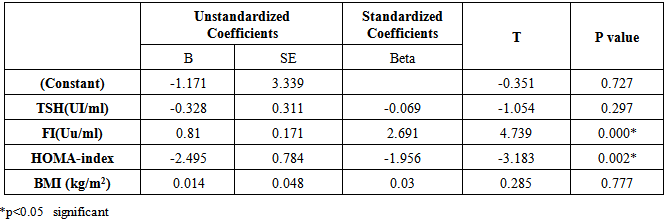
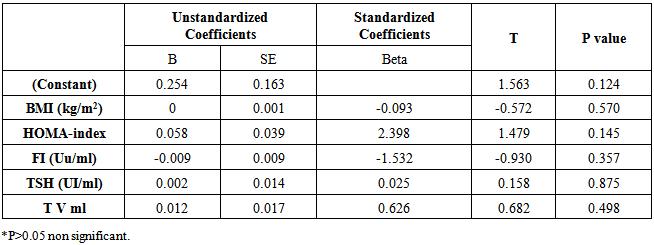
Among the studied parameters, multivariate linear regression analysis revealed that, TV was mainly associated with, HOMA-index and, FI (p<0.002, p<0.000, respectively), as shown in table (7). Multivariate logistic regression analysis revealed that BMI, HOMA-index, FI, and TV were the main predictors for developing more than one nodule (table 8). None of the studied parameters had an association with NV (table 9).
Table (7). Multivariate Linear regression analysis for the predictors of thyroid volume
     
Table (8). Multivariate logistic regression analysis for the prediction of formation of more than one nodule
     
Table (9). Multivariate Linear regression analysis for the predictors of NN
     

4. Discussion

The association between IRS (or its related component including type 2 diabetes, polycystic ovary syndrome) and thyroid functional and/or morphological abnormalities comes to the forefront of the medical literature in thyroidology, not only in benign conditions [21, 22], but also had been extended to thyroid carcinogenesis [23].
Insulin sensitivity is traditionally determined by the euglycemic-hyperinsulinemic clamp technique [24], but in the general population; it is more convenient and cost-effective to estimate HOMA-index using plasma glucose and insulin [19, 25]. In this study we use HOMA- index cut-off (>2.7) [19] to detect the frequency of IR among the sixty subjects who presented with euthyroid nodular thyroid disease.
The frequency of IR in healthy individuals with normal glucose tolerance is nearly 25% [26]. In the current study, the frequency of subjects with IR was (56.70%).
Those with IR had higher BMI and WC than those without IR (p<0.000, p<0.003 respectively). Overall and abdominal obesity have been associated with IR or compensatory hyperinsulinemia in numerous cross-sectional studies [27]. In some population-based studies on non-diabetic subjects, obesity and weight gain have predicted increases in insulin levels or hyperinsulinemia [28]. For both temporal sequences, there are plausible physiological mechanisms that may explain the association [29]. The existing data are, however, derived from different ethnic populations, age groups, and often from special high-risk populations, which limits the generalizability of the results [28].
In the current study, mean levels of TSH was higher in subjects with IR as opposed to those without IR. Although serum concentrations of thyroid hormones lies in the normal range, minor differences seem to be important as was reported in previous studies [30, 31, 21]. It is known that thyroid hormones can stimulate the expression and activate a number of proteins that are candidates for regulating insulin sensitivity [32]. Recent studies suggested that not only overt thyroid dysfunction, but, even euthyroidism is also associated with the metabolic syndrome and IR [33].
In the current study, mean TSH level was positively and significantly associated with BMI, which is similar to results reported by few studies [34, 35, 36]. TSH directly stimulates preadipocyte differentiation and results in adipogenesis [37]. It is recognized that overt thyroid dysfunction is associated with weight changes, but the influence of a minor alteration of thyroid function remains unclear [37].
A relationship between thyroid function and overweight/obesity condition seems to exist, and may be mainly influenced by IR. Whether variations in TSH and/or thyroid hormones, within a normal range, can influence body weight or whether obesity per se can alter thyroid function cannot be stated so far [38].
In the current study, there was a strong association between TSH level and presence of IR (FI, HOMA-index), which is confirmed by other studies [39, 40]. However, no association was found between serum free thyroid hormones (FT4 and FT3) and the presence of obesity or IR, a finding which is in accordance with results reported by Ayturk et al [40].
The most consistently reported finding by studies evaluating thyroid functional changes, is that serum level of TSH was higher in subjects with metabolic syndrome and IR. Data regarding free thyroid hormones was discrepant between different studies [41, 42].
To verify this complex relationship, some studies suggested that humoral or hormonal mediators from adipose tissue stimulate the hypothalamus-pituitary-thyroid axis in order to increase TSH secretion [43]. There is possibly a relationship between leptin and thyroid hormones via an influence of leptin on the negative feedback regulation of thyroid hormones. Leptin was also found to regulate TRH expression [44]. Recent evidence has suggested that the relationship between leptin levels and fat mass is curvilinear [45]. Insulin also increases total leptin levels [46].
Thyroid nodules are characterized by excessive growth and structural transformation of one or several areas within the normal thyroid tissue. Their etiology seems to involve complex interactions between environmental and genetic factors [47].
To study the relation between IR and thyroid morphology, US was used. We found that subjects with IR had greater thyroid gland volume, and thyroid nodule volume. Furthermore, they had higher percent of number of nodules. Significant correlation was also found between degree of IR measured by HOMA-index and TV and NV (p<0.000).
These results are comparable with the first reports by Rezzonico et al [48], Rezzonico et al [49] in Argentina. Other studies in Turkish and Italian populations have also shown that nodular thyroid disease might be related to higher HOMA-Index and metabolic syndrome. [50-52]
Numerous studies have found an association between TV and BMI. In most of these studies TV is positively correlated with BMI [53, 54]. However, in the present study we could not reveal any association between TV and obesity parameters (BMI, and WC). Usluogullari et al [21], found similar results. Contradictory findings of these reports might be related to difference in study populations including ethinicity, genetic background and BMI. In addition, a causal relationship between TV and BMI was not specifically explained [40].
Not only were IR indices (HOMA-index, and FI) associated with TV and NV, but also, TSH level was significantly and positively associated with TV and NV.
At first glance, it seems clear that TSH is the major growth factor of the thyroid gland. However, this straightforward interpretation neglects some findings that point to an intricate complexity of TSH-dependent and independent mechanisms within a network of interacting positive and negative signals [55]. TSH is not only involved in the control of differentiated functions, it also regulates the expression of growth factors e.g. insulin like growth factor-1 (IGF-1) and their receptors [56], and may contribute to an increased responsiveness of thyroid cells to growth factors [49]. Chronic elevation of insulin is associated with increased availability of serum IGF-1, sustained exposure to high serum IGF-1 is likely to play role in the development of thyroid proliferation [57].
In the current study, among the variables that might have an effect on thyroid volume, IR as assessed by HOMA-Index, but not TSH, was associated with increased thyroid volume. These results are in agreement with results of Rezzonico et al [48]. They highlighted that thyroid gland morphology is another victim of the IR syndrome.
Considering the factors that likely increase the frequency of thyroid nodule, IR, BMI and TV were the main predictors. Ayturk et al [40], found that IR was associated with increased risk of nodular formation. However, we did not find association between any of the studied variables and NV.
There is a recent rise in thyroid cancer. The rate of malignancy is 1.5% to 17% in nodules detected on imaging performed for non–thyroid-related indications [58]. However, the true rate of malignancy is unknown, because many nodules are small enough to escape detection [59]. It should be questioned whether there are modifiable risk factors contributing to this increased risk [60]. Recently, an intriguing area of research in thyroidology is the association of IRS and thyroid tumerogenesis [61, 23], as it is well known with some other non-thyroid carcinoma [61].
In the current study, one malignant thyroid nodule (papillary thyroid cancer) was detected by fine needle aspiration cytology (FNAC) in one out of sixty subjects (1.6%), and the size of this nodule was just approaching 1cm. By revising the character of the patient, we found that she had considerably a marked degree of obesity mainly visceral adiposity, and IR (BMI=33.80kg/m2, WC=113cm, FI=20 Uu/ml, HOMA-index=4.4). There is scarce information on the effect of hyperinsulinemia on the development of thyroid cancer. However, it has been shown that insulin receptors are over expressed in most thyroid tumors as an early step in thyroid carcinogenesis [62]. The identification that thyroid gland morphology is jeopardized by the presence of IR through the risk of nodular formation and possibility of tumorogenesis warrants further studies with larger sample size in order to reach a solid conclusion.

5. Conclusions and Recommendations

IR is common among Egyptian patients with euthyroid nodular thyroid disease. Thyroid gland is another vulnerable tissue that might be affected by IR in the form of increased thyroid volume and the higher risk of nodule formation. Hence, subjects with euthyroid nodular thyroid disorder, having high probability of IR, surely constitute an important target group for active intervention with lifestyle measures with emphasis on weight loss and exercise. FNAC, should be considered in nodules less than 1 cm in patients having IR, especially if associated with US findings pointing to the risk of possible malignancy.
The shortcomings of this study include the small-sized sample, the cross-sectional nature which does not permit inferences on the causality of associated IR and nodular thyroid disease, and lack of control group. Moreover, other hormones like IGF-1 and leptin levels had not been measured.

References

[1]  Ascaso JF, Pardo S, Real JT, Lorente RI, Priego A, Carmena R. Diagnosing insulin resistance by simple quantitative methods in subjects with normal glucose metabolism. Diabetes Care 2003; 26:3320–3325.
[2]  Campbell AW. The diabetes pandemic. Alternative Therapies in Health and Medicine 2011; 17 8–9.
[3]  Karagiannis T, Paschos P, Paletas K, Matthews DR, Tsapas A. Dipeptidyl peptidase-4 inhibitors for treatment of type 2 diabetes mellitus in the clinical setting: systematic review and meta-analysis. BMJ 2012; 344 e1369.
[4]  Hadaegh F, Mohebi R, Cheraghi L, Tohidi M, Moghaddam NB, Bozor- ogmanesh M, Sheikholeslami F, Azizi F. Do different metabolic syndrome definitions predict cerebrovascular events and coronary heart disease independent of their components?: 9 years follow-up of the tehran lipid and glucose study. Stroke 2012; 43: 1669–1671.
[5]  Vykoukal D, Davies MG. Biology of metabolic syndrome in a vascular patient. Vascular 2012; 20; 156–165.
[6]  Talbot K, Wang HY, Kazi H, Han LY, Bakshi KP, Stucky A, Fuino RL, Kawaguchi KR, Samoyedny AJ, Wilson RS et al. Demonstrated brain insulin resistance in Alzheimer’s disease patients is associated with IGF-1 resistance, IRS-1 dysregulation, and cognitive decline. Journal of Clinical Investigation 2012; 122: 1316–1338.
[7]  Jeon CY, Haan MN, Cheng C, Clayton ER, Mayeda ER, Miller JW & Aiello AE. Helicobacter pylori infection is associated with an increased rate of diabetes. Diabetes Care 2012; 35: 520–525.
[8]  Byers T, Sedjo RL. Does intentional weight loss reduce cancer risk? Diabetes, Obesity & Metabolism 2011; 13: 1063–1072.
[9]  Spyridopoulos TN, Dessypris N, Antoniadis AG, Gialamas S, Antonopoulos CN, Katsifoti K, Adami HO, Chrousos GP, Petridou ET. Insulin resistance and risk of renal cell cancer: a case–control study. Hormones 2012; 11 308–315.
[10]  Abbasi F, Brown BW, Lamendola C, McLaughlin T, Reaven GM. Relationship between obesity, insulin resistance, and coronary heart disease risk. J Am Coll Cardiol 2002; 40:937–943.
[11]  McLaughlin T, Allison G, Abbasi F, Lamendola C, Reaven G. Prevalence of insulin resistance and associated cardiovascular disease risk factors among normal weight, overweight, and obese individuals. Metabolism 2004; 53:495–499.
[12]  Desser TS, Kamaya A. Ultrasound of thyroid nodules. Neuroimaging Clin N Am 2008; 18:463-478.
[13]  Frates MC, Benson CB, Charboneau JW, Cibas ES, Clark OH, et al. Society of Radiology in Ultrasound. Management of thyroid nodules detected by US: Society of Radiologist in Ultrasound Consensus Conference Statement. Radiology 2005; 237:794-800.
[14]  Cappelli C, Pirola I, Cumetti D, et al. Is the anteroposterior and transverse diameter ratio of non palpable thyroid nodules a sonographic criterion for recommending FNAC? Clinical Endocrinol (Oxf) 2005; 63:689-693.
[15]  Papini E, Guglielmi R, Bianchini A,et al. Risk of malignancy in non palpable thyroid nodules: Predictive value of ultrasound and color-Doppler features. J Clin Endocrinal Metab 2002; 87: 1941-1946.
[16]  WHO, Unicef, ICCiDD. Assessment of iodine deficiency disorders and monitoring their elimination, Third edition, 2007.
[17]  WHO. Physical status: the use and interpretation of anthropometry. Report of a WHO Expert Committee. WHO Technical Report Series 854. Geneva: World Health Organization, 1995.
[18]  Wang J, Thornton JC, Bari S, et al. Comparisons of waist circumferences measured at 4 sites. Am J Clin Nutr 2003; 77:379–384.
[19]  Matthews D, Hosker J, Rudenski A, Naylor B, Treacher D, Turner R. Homeostasis model assessment: insulin resistance and β-cell function from fasting plasma glucose and insulin concentrations in man. Diabetologia 1985; 13:412–419.
[20]  Brunn J, Block U, Ruf G, Bos I, Kunze WP and Scriba PC. Volumetric analysis of thyroid lobes by real-time ultrasound. Dtsch Med Wochenschr 1981; 106: 1338-1340.
[21]  Usluogullari CA, Balkan F, Onal ED, Ucler R, Tam AA. Does Thyroid Volume and Nodule Formation Increase in Patients with Euthyroid Metabolic Syndrome?. Endocrinol Metab Syndr 2014; 3:3.
[22]  Abd El-Hafez HA, Elrakhawy MM, Abd el-Aziz S, El-Eshmawy MM. Thyroid function and volume are associated with anthropometric measurements and insulin resistance in Egyptian women with polycystic ovary syndrome. Diabetes & Metabolism 2013; 4:7.
[23]  Cho SW, Yi KH, HAN SK, Sun HJ, Kim YA,et al. Theraputic potential of metformin in papillary thyroid carncer in vitro and in vivo. Molecular and cellular Endocrinology 2014; 393: 24-29.
[24]  DeFronzo RA, Tobin JD, Andres R. Glucose clamp technique: a method for quantifying insulin secretion and resistance. Am J Physiol Endocrinol Metab 1979; 13:E214.
[25]  Wallace T, Matthews D. The assessment of insulin resistance in man. Diabet Med 2002; 13:527–534.
[26]  Hollenbeck C, Reaven GM. Variations in insulin stimulated glucose uptake in healthy individuals with normal glucose tolerance. J Clin Endocrinol Metab 1987; 64:1169–1173.
[27]  DesprSs JP, Marette A. Obesity and insulin resistance. Epidemiologic, metabolic, and molecular aspects. In: Reaven GM, Laws A (eds). Insulin resistance. The metabolic syndrome X. Humana Press, Totowa, New Jersey 1999; 51–81.
[28]  Lakka HM, Salonen JT, Tuomilehto J, Kaplan GA, Lakka TA. Obesity and Weight Gain Are Associated with Increased Incidence of Hyperinsulinemia in Non-Diabetic Men. Horm Metab Res 2002; 34: 492–498.
[29]  Kahn BB, Flier JS. Obesity and insulin resistance. J Clin Invest 2000; 106: 473–481.
[30]  Davis FB, Thayer K, Colborn T. Significant effects of mild endogenous Hormonal changes in humans: considerations for low dose testing. Environ. Hlth Pers 2001; 109: 21-25.
[31]  Andersen S, Pedersen KM, Bruun NH, Laurberg P. Narrow individual variations in serum T4 and T3 in normal subjects: A clue to the understanding of subclinical thyroid disease. J Clin Endocrinol. Metabol 2007; 87: 1068-1072.
[32]  Klieverik LP, Janssen SF, Van Riel A, Foppen E, Bisschop PH, Serlie MJ, Boelen A, Ackermans MT, Sauerwein HP, Fliers E, Kalsbeek A. Thyroid hormone modulates glucose production via a sympathetic pathway from the hypothalamic paraventricular nucleus to the liver. Proc Natl Acad Sci 2009; 106: 5966-5971.
[33]  Chun H, Song K. "High normal" thyroid stimulating hormone: does it matter? Korean J. Intern. Med 2013; 28(2): 162-164.
[34]  Bastemir M, Akin F, Alkis E, Kaptanoglu B. Obesity is associated with increased seum TSH level .Independent of thyroid function. Swiss Medical Weekly 2007; 137:431-434.
[35]  Nyrnes A, Jorde R, Sundsfjord J. Serum TSH is positively associated with BMI. Int J Obesity 2006; 30:100-5.
[36]  Manji N, Boelaert K, Sheppard MC, Holder RL, Gough SC, Franklyn JA. Lack of association between serum TSH or free T4 and body mass index in euthyroid subjects. Clin Endocrinol 2006; 64:125-8.
[37]  Solanki A, Bansal S, Jindal S, Saxena V, Shukla US. Relationship of serum thyroid stimulating hormone with body mass index in healthy adults. Brief Communication 2013; 17(7): 167-169.
[38]  Ambrosi B, Iorio L Delnevo A Malavazos AE, Morricone L, Sburlati LF, Orsi E. Relationship of thyroid function with body mass index and insulin-resistance in euthyroid obese subjects. Journal of Endocrinological Investigation 2010; 33(Issue 9): 640-643.
[39]  De Pergola G, Ciampolillo A, Paolotti S, Trerotoli P, Giorgino R. Free triiodothyronine and thyroid stimulating hormone are directly associated with waist circumference, independently of insulin resistance, metabolic parameters and blood pressure in over- weight and obese women. Clinical Endocrinology 2007; 67: 265-269.
[40]  Ayturk S, Gursoy A, Kut A, Anil C, Nar A, Tutuncu NB. Metabolic syndrome and its components are associated with increased thyroid volume and nodule prevalence in a mild to moderate iodine-deficient area. Eur J Endocrinol 2009; 161: 599-605.
[41]  Michalaki MA, Vagenakis AG, Leonardou AS, Argentou MN, Habeos IG, Makri MG, Psyrogiannis AI, Kalfarentzos FE, Kyr-Iazopoulou VE. Thyroid function in humans with morbid obesity. Thyroid 2006; 16: 73-78.
[42]  Knudsen N, Laurberg P, Rasmussen LB, Bülow I, Perrild H, Ovesen L, Jørgensen T. Small differences in thyroid function may be important for body mass index and the occurrence of obesity in the population. Journal of Clinical Endocrinology and Me- tabolism 2005; 90: 4019-4024.
[43]  Sari R, Balci MK, Altunbas H, Karayal-Cin U. The effect of body weight and weight loss on thyroid volume and function in obese women. Clinical Endocrinology 2003; 59: 258-262.
[44]  Zimmermann-Belsing T, Brabant G, Holst JJ, Feldt-Rasmussen U. Circulating leptin and thyroid dysfunction. European Journal of Endocrinology 2003; 149: 257-271.
[45]  Mantzoros CS, Moschos SJ. Leptin: in search of role (s) in human physiology and pathophysiology. Clinical Endocrinology 1998; 49:551-567.
[46]  Lewandowski K, Randeva HS, Ocallaghan CJ, Horn R, Medley GF, et al. Effects of insulin and glucocorticoids on the leptin system are mediated through free leptin. Clinical Endocrinology 2001; 54: 533-539.
[47]  Hegedüs L, Bonnema SJ, Bennedbaek FN. Management of simple nodular goiter: Current status and future perspectives. Endocr Rev 2003; 24: 102-132.
[48]  Rezzonico J, Rezzonico M, Pusiol E, Pitoia F, Niepomniszcze H. Introducing the thyroid gland as another victim of the insulin resistance syndrome. Thyroid 2008; 18: 461-464.
[49]  Rezzonico J, Rezzonico M, Pusiol E, Pitoia F, Niepomniszcze H. Metformin treatment for small benign thyroid nodules in patients with insulin resistance. Metabolic syndrome and related disorders 2011; 9: 69-75.
[50]  Balkan F, Onal ED, Usluogullari A, Tuzun D, Ozdemir D, et al. Is three any association between insulin resistance and thyroid cancer?: A case control case study. Endocrine 2014; 45:55-60.
[51]  Rendina D, De Filippo G, Mossetti G, Zampa G, Muscariello R, et al. Relationship between metabolic syndrome and multinodular non- toxic goiter in an inpatient population from a geographic area with moderate iodine deficiency. Journal of Endocrinological Investigation 2012; 35:407-412.
[52]  Yasar H, Ertugrul O, Ertugrul B, Ertugrul D, Sahin M. Insulin resistance in nodular thyroid disease. Endocrine Reaserch 2011; 36:167-174.
[53]  Zakaria E, Ghanem NS, Abd Al-Salam RF, Elshaehaby AR. The Thyroid Gland is Another Victim of the Insulin Resistance Syndrome. Med J Cairo Univ 2012; 80(1):151-158.
[54]  Semiz S, Senol U, Bircan O, Gumuslu S, Bilmen S, Bircan I. Correlation between age ,body size and thyroid volume in an endemic area. journal of Endocrinology Investigation 2001; 24:559-563.
[55]  Derwahl M, Studer H. Pathogenesis and treatment of multinodular goiter. In: Fagin J.A. (ed). Thyroid Cancer. Boston/Dordrecht/London: Kluwer 1998; 155-186.
[56]  Studer H, Derwahl M. Mechanisms of non- neoplastic endocrine hyperplasia a changing concept: A review focused on the thyroid gland. Endocr Rev 1995; 16: 411-426.
[57]  Pothiwala P, Jain SK, Yaturu S. Metabolic syndrome and cancer. Metabolic Syndrome and Related Disorders 2009; 7: 279-288.
[58]  Yoon DY, Chang SK, Choi CS, et al. The prevalence and significance of incidental thyroid nodules identified on computed tomography. J Comput Assist Tomogr 2008; 32(5):810-815.
[59]  Belfiore A, Russo D, Vigneri R, Filetti S. Graves’ disease, thyroid nodules and thyroid cancer. Clin Endocrinol (Oxf) 2001; 55(6):711-718.
[60]  Richardson DB. Exposure to ionizing radiation in adulthood and thyroid cancer incidence. Epidemiology 2009; 20: 181-187.
[61]  Gursoy A. Rising thyroid cancer incidence in the world might be related to insulin resistance. Med. Hypotheses 2010; 74: 35-36.
[62]  Malaguarnera F, Frasca A, Garozzo F, Giani G, Pandini V, et al. Insulin receptors isoforms and insulin –like growth factor receptor in human follicular cell precursors from papillary thyroid cancer and normal thyroid. J Clin Endocrinol Metab 2011; 96: 766-774.