-
Paper Information
- Paper Submission
-
Journal Information
- About This Journal
- Editorial Board
- Current Issue
- Archive
- Author Guidelines
- Contact Us
International Journal of Diabetes Research
p-ISSN: 2163-1638 e-ISSN: 2163-1646
2015; 4(1): 13-21
doi:10.5923/j.diabetes.20150401.03
A Survey Comparing the Management of Diabetes, Hypoglycaemia and Hyperglycaemia by Type 1 and Type 2 Insulin Users
 Abstract
 Reference
 Full-Text PDF
 Full-text HTML
Joan Taylor1, Robert Gregory2, Ahmed Alsabih3, Mohamd Alblihed4, Paul Tomlins1, Tarsem Sahota1
1Leicester School of Pharmacy, Faculty of Health and Life Sciences, De Montfort University, The Gateway, Leicester, United Kingdom
2Department of Diabetes and Endocrinology, University Hospitals of Leicester NHS Trust, Leicester General Hospital, Leicester, United Kingdom
3Department of Physiology, College of Medicine & King Khalid University Hospital (KKUH), King Saud University, Riyadh, Kingdom of Saudi Arabia
4College of Medicine, Taif University, Taif, Kingdom of Saudi Arabia
Correspondence to: Tarsem Sahota, Leicester School of Pharmacy, Faculty of Health and Life Sciences, De Montfort University, The Gateway, Leicester, United Kingdom.
| Email: |  |
Copyright © 2015 Scientific & Academic Publishing. All Rights Reserved.
Aim: The opinions and attitudes of type 1 (T1) and type 2 (T2) insulin users toward their diagnosis, management, treatment and complications as a result of their diabetes were sought. Methods: A bottom-up survey design consisting of 66 open and closed questions was used to determine both positive and negative experiences of patients currently using insulin by injection only. Results: 707 insulin users (71% T1 and 29% T2) predominately from the UK completed the questionnaire. A comparison between T1 and T2 insulin users found that exercise, diet, BG testing and excursions from normoglycaemia were the most common source of difficulty amongst these insulin dependent patients. The majority of T1 participants were found to use a basal bolus insulin regimen (Lantus/Levemir and a short-acting insulin such as Novorapid®, Humalog® or Actrapid® but only 34% of T2 insulin users used a similar system with 35% using biphasic insulin aspart 30 (Novomix®) which may have due to lesser hypoglycaemic events. Conclusions: The results from this survey which focus on the common needs of insulin users show that careful follow-up after diagnosis, frequent testing and education about calorie turnover from intake and exercise are required for both T1 patients but more so for T2 patients whose needs become similar to those of T1 patients once they begin to inject insulin.
Keywords: Diabetes, Insulin users, Hypoglycaemia, Hyperglycaemia
Cite this paper: Joan Taylor, Robert Gregory, Ahmed Alsabih, Mohamd Alblihed, Paul Tomlins, Tarsem Sahota, A Survey Comparing the Management of Diabetes, Hypoglycaemia and Hyperglycaemia by Type 1 and Type 2 Insulin Users, International Journal of Diabetes Research, Vol. 4 No. 1, 2015, pp. 13-21. doi: 10.5923/j.diabetes.20150401.03.
Article Outline
1. Introduction
- About 366 million people have various common forms of diabetes, including lifestyle associated T2 (90% of the total) [1], with T1, gestational [2] and other minority diabetic conditions such as latent autoimmune diabetes of adults (LADA) and maturity onset diabetes of the young (MODY) accounting for the rest. This number is expected to rise by about 50% in the next 15 years, so that about 10% of the world’s population would experience diabetes in one form or the other [3].Insulin remains the only effective treatment for regulation of glucose levels in T1 diabetes, although adjuncts such as anti-hypertensives and statins are now included to protect the cardiovascular system from other biochemical abnormalities. For T2, the combination of dietary control, metformin and sulphonylureas (such as Gliclazide®) are common as a preventive therapy for metabolic derangement. Insulin is often added later in the progress of T2 disease (or if there has been a heart attack) and many authorities believe this is often done too late [4].Diabetes produces changes in the body chemistry that lead to the loss of protein function throughout the tissues [5]. High blood glucose (BG) concentration glycates inappropriately and permanently to the amine groups in proteins leading to structural protein and enzyme changes in various tissues [6, 7]. Other biochemical dysfunctions and compensatory anomalies occur in concert. The result is a metabolic derangement of carbohydrate and lipid that underpins the development of some of the complications that develop in poorly controlled diabetes of either main type [8]. These complications are mainly cardiovascular, renal, ophthalmic and neurological but also include dental, infection-related and wound-healing difficulties all of which as expensive to treat.The best treatment for maintaining acceptable HbA1c values for T1 and T2 diabetes comes from frequent testing and insulin doses known as ‘intensive control’ [9]. The evidence has been available for more than twenty years but the uptake is far from universal. The methodology is usually a combination of calculated background long acting (basal) and meal associated insulin boost (short-acting bolus) doses and characterised by the variation of dosing to allow a more normal diet than previously. The critical thing is to adjust frequently during the day to keep BG from chronically occurring excursions from normal. The invasiveness of injection and finger prick testing could be alleviated by the use of an insulin infusion pump and the eventual roll out of continuous glucose monitors. Investment in out-patient and community support staff, such as diabetes specialist nurses (DSNs) and the provision of pumps (much more common in the USA) are failure points common to many health services not only nationally but globally. The financial burden in the UK amounts to £1 million per hour [10, 11] which could be reduced by an improvement in the uptake of intensive control. Evidence across the world for children and adults shows that they fail to achieve optimum HbA1c [12]. A fall in HbA1c from 7.9 to 7.0 (63 to 53mmol/mol) lowers microvascular risk by 25% which is critical because poorly controlled T1 can reduce lifespan by 20 years [12].In this work we present data from responses to a questionnaire distributed to T1 and T2 insulin users relating to their diagnosis, management, treatment and complications as a result of their diabetes. As ~80% of T2 diabetes patients are treated on oral medications in the UK [10] the authors believe this is the first comparison between T1 and T2 insulin treated patients.
2. Method
2.1. Survey Design, Distribution and Response Collection
- A survey of patients with T1 and T2 diabetes who were insulin users was carried out. The questionnaires were produced in English and distributed to T1 and T2 insulin users through various channels. Advertisements were placed in various local and national media (such as newspapers) within the UK, and in publications from various diabetes charities such as Diabetes UK. An interactive web-based version of the survey (Survey Monkey®) was also available via a dedicated website for participants who wanted to submit responses via the internet. The UK Diabetes Network and other diabetes websites also distributed copies to members on their databases. Finally we used social networking sites such Twitter® and Facebook® to publicise the survey.A total of 707 participants answered 66 questions relating to their approach to glucose management, their appreciation of its importance and their understanding of the practical difficulties of achieving desired control. Responses were sought about their attitudes since diagnosis, their medical check-ups as well other areas of their management such as diet, hypo- and hyperglycaemia and other medical conditions.
2.2. Analysis of Responses
- The responses from Survey Monkey® were downloaded in Microsoft Excel 2010® and then coded before inputting into Statistical Package for the Social Sciences (SPSS) (version 22 “IBM”, Chicago, IL, US). All postal responses were entered manually using the same coding directly into SPSS®. All data were analysed using (SPSS) and Microsoft Excel 2010®. Descriptive statistics, frequencies and percentages were calculated to examine the different questions and variables in the survey. Data distributions were checked for normality and cross tabulations were used to investigate the relationship between T1 and T2 insulin users.
3. Results
3.1. Background Information, Diagnosis and Check-ups
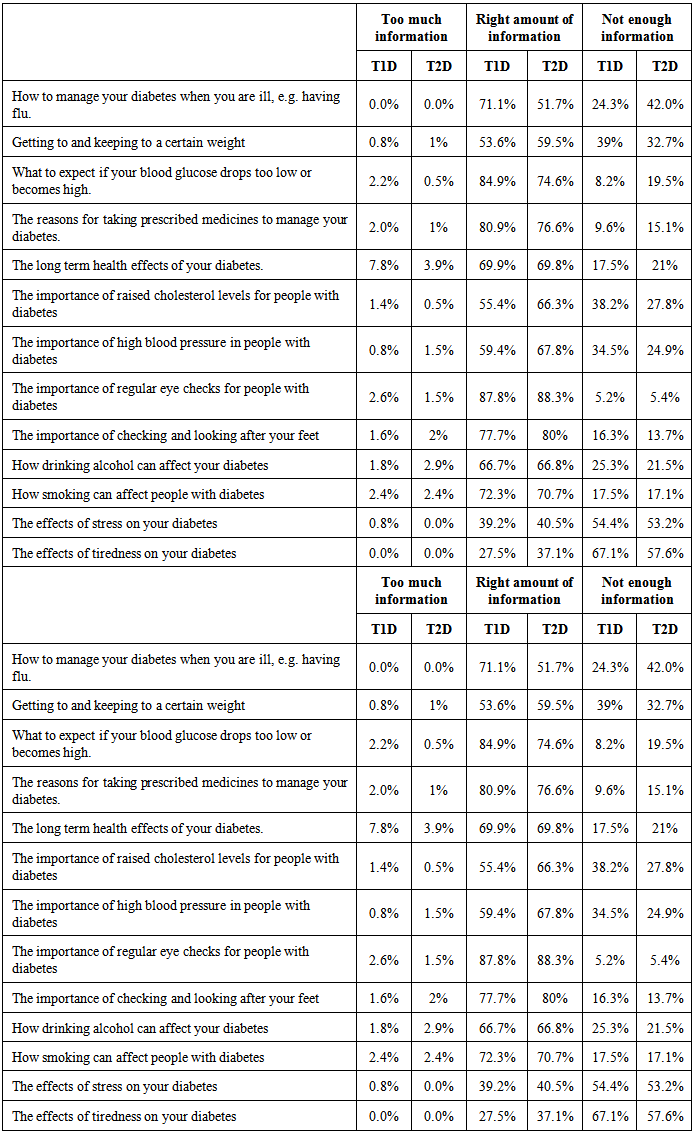
- From the 707 completed surveys, 95% of responses were from the UK where the survey was widely distributed and advertised with 91.1% of responses from British respondents of white ethnicity. The remaining responses were gathered from the USA. All respondents were insulin users with 71% having T1 diabetes and 29% having T2 diabetes. 42.2% of T1 respondents were male compared with 56.9% of T2. Respondents were asked how old they were when they left full-time education with 19.7% T1 and 44.3% T2 being 16 years or younger. However, 67.1% of T1 were most likely in or had a higher education (e.g. university), compared to 46% of T2. The most difficult aspect of the diabetes management for respondents was found to be exercising (36.6% for T2 and 34% for T1). Other difficulties were identified as diet, testing BG and injecting insulin. About 19.4% of T1 and T2 did not report anything difficult about their diabetes. 58.5% of the respondents thought that their diabetes was very well controlled.Respondents were asked where they went for their diabetes check-up, the majority (93%) were seen at their doctor’s surgery or in a hospital clinic. Respondents were also asked to describe the amount of written and verbal information they received when they were first diagnosed with diabetes. For verbal, 3% of T1 and 7.3% of T2 did not receive any information, 27.1% of T1, 31.7% of T2 received too little information and 44.6% of T1, 52.2% of T2 received the right amount of information. However, for written help, 8.8% of T1 and 14.6% of T2 did not receive any (such as leaflets or information booklets), 25.3% of T1, 22.4% of T2 too little information and the right amount of information was received by 32.5% of T1, 40.5% of T2. Of these, 2.8% of T1 and 2.0% of T2 had not had a diabetes check-up in the last 12 months, 30.9% of T1, 24% of T2 had one, 40% of T1, 49.5% of T2 had two and 26.2% of T1, 24.5% of T2 had had three or more check-ups.In the last 12 months, 69% of T1 and T2 had an opportunity most of the time to discuss their ideas about the best way to manage their diabetes with their medical advisors. However, a high proportion, 38.8% of T1 and 37.9% of T2 had no chance or rarely discussed possible different medications. In addition to this, 41.5% of T1 and 35.1% of T2 had rarely or never had personal advice about the kinds of food to eat and 43.5% of T1, 37% of T2 received similarly little personal advice about their levels of physical activity. More than half of the respondents (50.7% T1 and 56.7% T2) reported that they always or mostly had a plan to manage their diabetes over the next 12 months with their medical advisors. The majority of all respondents (95%) had had a HbA1c test, blood pressure measurement and their weight checked by a doctor or nurse in the previous 12 months as part of their treatment. Also in the past 12 months over 72.3% of T1 and T2 respondents had their cholesterol, eyes and bare feet examined. 36.3% of T1 and 26.3% of T2 had also talked to a dietician in the previous 12 months about their dietary management. When T1 and T2 respondents were asked if they had stayed in hospital overnight as a patient in the last 12 months, 19% of T1 and T2 reported that they had. Of those respondents 65.2% of T1 and 56.4% of T2 had stayed for 1 – 3 nights, with 43.7% of T1 and 17.9 of T2 reporting that the reason was diabetes related.
3.2. Management and Diet
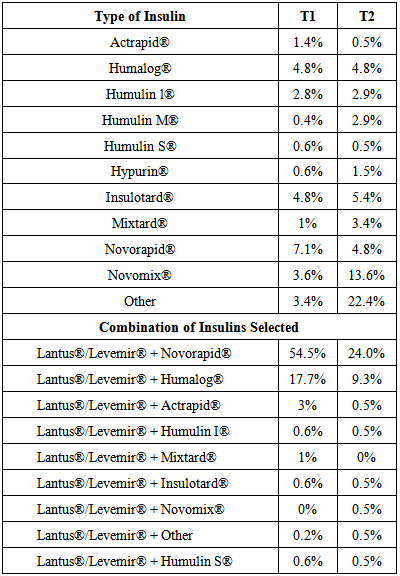
- Table 1 shows the types of insulin used by T1 and T2 respondents.
|
|
3.3. Hypoglycaemia
- The vast majority of respondents had experienced hypoglycaemia at some time since diagnosis (98.9% T1 and 86.1% T2), however, the majority of these respondents did not experience black out, convulsions/fit and coma when this occurred. Nevertheless, they experienced the following symptoms: paleness (45% of T1 and 22.4% of T2), trembling (64.7% of T1 and 56.1% of T2) , sweating (76.9% of T1 and 62% of T2), feeling of weakness (76.3% of T1 and 65.4% of T2), rapid heartbeat (37.6% of T1 and 22.4% of T2), hunger (49.2% of T1 and 25.9% of T2), agitation/irritability (69.5% of T1 and 34.6% of T2), poor concentration (68.9% of T1 and 46.3% of T2), blurred vision (43% of T1 and 23.4% of T2) and loss of coherence (45.2% of T1 and 21.5% of T2). In general, the survey found that people with T1 diabetes have experienced these symptoms more than T2.About 67% of T1 and T2 felt hypoglycaemic symptoms when their BG level was between 3 and 4 mmol/L. However, 6.3% of T1 and 19.9% of T2 felt similar symptoms between 4 and 5 mmol/L while 26.4% of T1 and 13.7% of T2 only felt symptoms below 3 mmol/L. 21.6% of T1 and 11% of T2 stated that hypoglycaemia affected their day-to-day activities quite a lot or great deal. However, 77.5% of T1 and 89% of T2 described little or no effect. Most of the respondents in this survey (93.2% of T1 and 76.1% of T2) responded to a low BG by taking a sugary food or drink immediately.About 14.3% of T1 and 8.4% of T2 had decided whether or not to drive, either on occasion or permanently due to problems with low BG. 29.6% of T1 and 20.1% of T2 had had “severe” hypoglycaemic episodes during the past 12 months with 52.4% of T1 and 61.8% of T2 having severe symptoms once or twice. 25.2% of T1 and 17.6% of T2 had it three to five times and 22.4% of T1 and 20.6% of T2 had it six times or more. During a12 month period, 16.3% of T1 and 6.5% of T2 had passed out or had a seizure because of low blood sugar and required help from others. Most of them (73.3% of T1 and 81.8% of T2) had this once or two times, 12% of T1 and 9.1% of T2 had it three to five times and 14.7% of T1 and 9.1% of T2 had it six times or more. When respondents were asked when their last “severe” low blood sugar episode happened, 55.3% of T1 and 43.2% of T2 reported that it happened longer than 6 months ago and 24.8% of T1 and 33.3% of T2 said that they had it within the last month. 4.5% of T1 and 4.6% of T2 reported they had to go to hospital because of their hypoglycaemic episode.
3.4. Hyperglycaemia
- When respondents were asked if their BG had ever been above 20mmol/L, 84.2% of T1 and 57.5% of T2 replied positively. About 63.2% of T1 and 46.7% of T2 said they could sense when their BG was above 13mmol/L without testing. Interestingly, however, 31% of T1 and 33.8% of T2 had found their BG 13mmol/L or above once or twice a week. 59.2% of T1 and 33.1% of T2 had more than twice a week. Only a third, (33.1%) of T2 and 9.8% of T1 had never reported a BG as high as 13mmol/L or above, but despite the tendency to hyperglycaemia, 93.2% of T1 and 97.1% of T2 had never been in a coma because of high BG. When respondents were asked what triggered their high blood sugar (13mmol/L or above), 36.5% of T1 and 16.6% of T2 said it was due to a missed insulin injection. 27.1% of T1 and 25.9% of T2 mentioned the trigger was an illness or due to physiological stress such as infection.
3.5. Other Medical Conditions and Complications
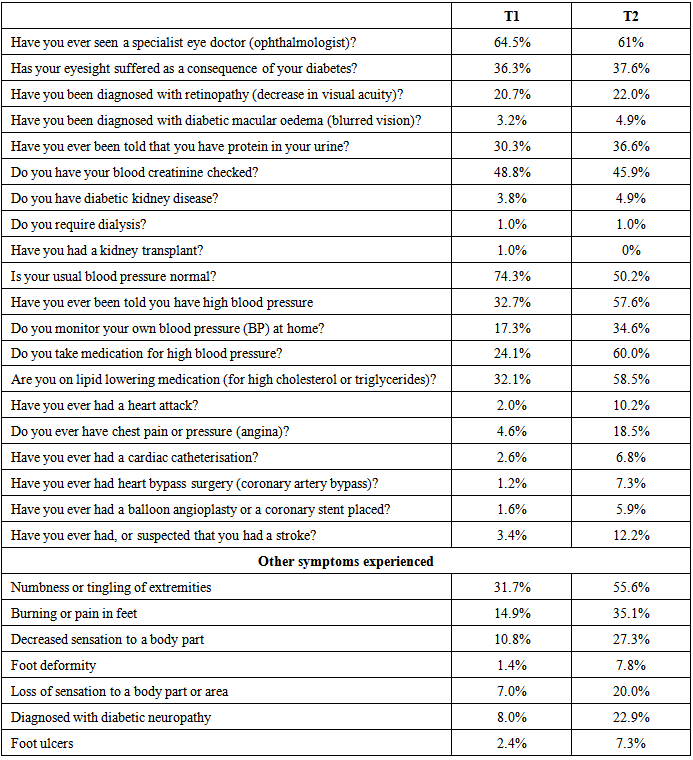
- 28.3% of those with T1 and 26.7% of T2 were hospitalised several times. Table 3 shows a summary of responses from both T1 and T2 respondents relating to other medical conditions diagnosed or symptoms tested for. 57.6% of T2 and 32.7%T1 had been told that they had high blood pressure (BP) and 34.6% of T2 and 17.3% of T1 monitored their BP at home. When asked about BP medication, 60% of T2 and a quarter of T1 said that they took it. When respondents were questioned about other complications, 10.2% and 18.5% of T2 had had a heart attack or chest pain/pressure (angina), respectively, only 2% and 4.6% of T1 had these complications. Stroke was suspected or experienced by 12.2% of T2 and 3.4% of T1.
|
4. Discussion
- In the UK the prevalence of T2 diabetes in comparison to T1 is approximately 9 to 1 respectively [10]. The causes of T2 diabetes are often attributed to patients being overweight or obese and the first line of treatment are usually oral medications (sulfonylureas and Metformin®) and lifestyle changes such as more frequent exercise and improvements in dietary control. Once these changes have been implemented and the patient still maintains abnormal BG and HbA1c readings suggesting that they no longer maintain normoglycaemia as a result of factors such loss of insulin receptor sensitivity and beta cell deterioration, insulin is introduced. Symptoms of T2 diabetes usually present in people who are over 25 years of age although the highest prevalence are in patients over 60 years of age [13]. In this work we provide a comparison by means of a questionnaire between insulin users with T1 and T2 diabetes to assess how they have essentially managed and treated their diabetes.Most of the responses gathered in this survey were from patients with T1 diabetes which usually presents in people under the age of 40 with the majority of cases occur in juveniles. As these patients are generally younger than most T2 patients and they have to inject insulin daily in order to survive, they may respond more enthusiastically to questionnaires. There was a greater proportion of T1 than T2 respondents having received a higher education and this may underpin a keenness for learning more about their condition and engaging in research initiatives. It may be important when recruiting for surveys to think about the font size and other aspects of visual clarity, so that those with poor or ageing eyesight are not excluded.In 2007 the largest survey ever conducted by the Healthcare Commission’s National Patient Experience Survey Programme [13], which included 152 Primary Care Trusts (PCT) across England collected responses from 68501 questionnaires (a response rate of 55%), where 87% of the respondents were T2 and 13% T1. Of those respondents 96% T1 and 17% T2 (25% of the total 68501 respondents) were insulin users in the same way as those participating in this survey. They found that 73% of all respondents received the right amount of verbal information, compared with 57% of all respondents when it came to written information at the time of diagnosis. They also found that those patients diagnosed with diabetes in the last five years were more likely to receive the right amount of written and verbal information. Although the Healthcare Commission’s findings [13] were from all respondents in the survey (so include T2 tablet users as well as others) their results suggest that there is a lack of information provided across the whole spectrum of people diagnosed with diabetes in terms of information to allow self-management effectively. The results in this work show that the provision for verbal information at the time of diagnosis was similar or better than for written information to the Healthcare Commission’s [13], 70% of T1 and 61% T2 received at least the right amount of verbal information and 65.9% T1 and 61% received at least the right amount of written information at diagnosis. These results show that well targeted information in both forms seems a prerequisite for managing patients on insulin.Respondents were asked where they went for their diabetes check-up, 22.6% of T1 and 52.1% T2 were seen in their doctor’s surgery, 70.2% of T1 and 41.7% were seen at a hospital clinic. The Healthcare Commission survey [13] found that 85% of T2 diabetes patients had their check-up at their doctors surgery, with only 13% attending a hospital clinic, whereas those with T1 diabetes had a check-up in a hospital clinic (63%) and 32% at their GP’s surgery. These findings would incorporate T2 diabetes patients who were controlling their diabetes by tablet so were not so perhaps did not need more specialised diabetes clinics. However, the T2 patients in this survey were insulin users similar to those that are T1 yet 52.1% (T2) versus 22.6% T1 were still seen by their GP suggesting that despite injecting insulin they were not checked in hospital clinics.The results from this survey correlate well with those found in the Healthcare Commission’s report [13] which showed that in the 12 months prior to answering their questionnaire 98% of the respondents had had their blood pressure measured, 91% HbA1c and weight, 89% cholesterol, 87% a urine test for protein, 83% their bare feet examined and finally only 23% reported seeing a dietician within the last 12 months. In the UK these tests form the basis of NICE guidelines for the nine care processes which diabetes patients should undergo, yet the National Diabetes Audit results for 2009/10 [14] showed that throughout the UK two-thirds of adults with T1 diabetes, and half of people with T2 diabetes fail to get these annual tests and investigations that are recommended in the national standards [14]. This survey found that for people with T2 diabetes the most difficult aspect of their diabetes management was found to be exercise. This was reflected in responses where 44.2% T1 and 37.1% T2 participated between one and three hours of exercise per week and 11.1% of T1 and 17.8% T2 respondents did not perform any exercise. T2 diabetes is often associated with lifestyle and in most cases can be related to lack of exercise and obesity. It was noticeable that the number of responses didn’t participate in any exercise was greater from people with T2 diabetes. This may have been influenced by the age of the T2 respondents who present diabetes symptoms in later life and they may also have other medical conditions which prevent participation in exercise.Diet was also identified by respondents as a source of difficulty for their diabetes with 29% of T1 finding difficult to find the right foods to manage their diabetes compared with 41.9% T2 insulin users. This is despite 51% T1 using an educational DAFNE programme and over 81% of all respondents receiving some dietary advice since diagnosis from their medical advisors [15] found that patients with T1 using MDI therapy often underestimated their carbohydrate intake by 20% and this was usually a result of anticipated exercise or fear of hypoglycaemia as a result of their injected insulin. Paradoxically, T1 patients who don’t have access to well-structured education may be systematically over-insulinised. Both these findings add to the growing body of evidence for the benefits of the DAFNE programme [16, 17]. A judicious and targeted insulin therapy following DAFNE training in T1 has been found to allow patients to achieve better glycaemic targets with less insulin [16]. Despite this only 7.2% of T2 respondents were using DAFNE and 50.8% of these T2 respondents counted their carbohydrates, suggesting that structured education programmes such as DAFNE for T2 insulin users were much less frequently used. The frequency of BG testing was higher in T1 insulin users with 65% T1 testing 4 or more times which correlates with 86.4% of T1 injecting insulin 4 or more times suggesting that respondents may have been injecting prior to calorie intake with a short-acting insulin such as Novorapid® or Humalog®. Table 1 showed that most T1 and T2 respondents were using Lantus®/Levemir® and in order to see if these respondents were on a basal bolus insulin regimen a cross tabulation of the data was performed with the short-acting insulins Novorapid®, Humalog® and Actrapid®. The data in Table 1 revealed all the insulins respondents were using so more than one option may have been ticked and for T1 respondents there were responses received which included more than two insulins but these were less than 1% of total T1 responses and have therefore not been separated out in Table 1. The data in Table 1 suggests that most T1 respondents (~75%) were using the long acting insulin (Lantus® or Levemir®) in combination with a short-acting insulin such as Novorapid®, Humalog® and Actrapid® and as such were using a basal bolus system. This was not the case for T2 respondents (~34%) were using the same basal bolus system and ~35% using Novomix® and other insulins not listed in the survey. In order to use a basal bolus insulin regimen the patient would have to test their BG prior to calorie intake and bolus accordingly which provides a more intensive BG control and would prevent hypo- and hyperglycaemia.[18] found that T2 patients using a basal bolus system have found that the number of injections per day and more frequent hypoglycaemic episodes difficult and report that after 24 weeks T2 patients switching from basal-bolus insulin regimens to biphasic insulin aspart 30 (Novomix®), glycaemic control and health related quality of life were significantly improved, and hypoglycaemia was significantly reduced. This may account for the higher number of T2 respondents using Novomix® in this survey.Differences in the testing of BG were found for T2 insulin users in this work compared to those of the Healthcare Commission [13] where 31% with T1 diabetes tested 4 or more with only 3% of T2. Similarly, only 4% with T1 never monitored their BG compared with 29% T2. This could be attributed to the greater number of participants taking part in the Healthcare Commission survey which was able to capture data over a broader range of patients with diabetes who may have been treating there diabetes with oral medications.Both T1 and T2 patients had experienced hypoglycaemia indicating that they their current treatment by insulin injection allowed them drift lower than normoglycaemia. Although most of these respondents did not exhibit serious symptoms such as black out or coma they did experience more typical conditions such as trembling and weakness. Agitation and poor concentration were felt by more T1 respondents. Most T1 and T2 respondents felt these symptoms when their BG was between 3-4mmol/L. Defining BG values for hypoglycaemia remains difficult with surgeons and forensic pathologists defining spontaneous pathological hypoglycaemia requiring investigation and treatment at BG < 2.2 mmol/L, to avoid defining healthy people as hypoglycaemic[19]. At the other extreme, the American Diabetes Association (ADA) [20] defined BG concentrations of < 3.9 mmol/L as hypoglycaemia, based on the reduction in endogenous insulin and increase in pancreatic glucagon which can be demonstrated at this level. However, defining hypoglycaemia < 3.9 mmol/L could lead to overestimation of clinically significant hypoglycaemia associated with any specific diabetes therapy. The European Medicines Agency [21] recommend a value of < 3.0 mmol/L when assessing hypoglycaemic risk of different treatment regimens. Impaired cognitive function is seen at plasma BG concentrations of < 3.0 mmol/L and avoidance of plasma BG concentrations of < 3.0 mmol/L has been able to restore hypoglycaemia awareness to people with T1 diabetes and defective counter regulation. As insulin-deficient patients with diabetes lose their ability to modulate either insulin or glucagon in response to hypoglycaemia and depend instead on autonomic activation, subjective awareness and adrenaline to defend against severe hypoglycaemia. Risk factors for individual episodes of hypoglycaemia in patients with T2 diabetes include behavioural, physiological and therapeutic factors, the most common behavioural factor being identified as missed or irregular meals. Other lifestyle factors include alcohol, exercise and incorrect use of glucose-lowering medication (dose/timing).Hyperglycaemia causes vascular risks such as hypertension and cerobropetal arteries increasing the chance of strokes taking place is twice as much in patients with diabetes [22]. The present survey shows that 63.2% of T1 respondents thought that they could sense when their BG was above 13mmol/L yet that dyslipidaemia as well as atherosclerotic changes in the heart and over 90% of T1 respondents had these above normal BG reading once or more a week. Similarly for T2 respondents, 46.7% could sense an above normal BG with 68% have these high BG episodes more than once a week. 33% of T1 respondents had suffered from diabetic ketoacidosis (DKA) and most of these had been hospitalised as a result indicating that the treatment and management of respondents was clearly not adequate to maintain BG control, similar trends were observed for T2 respondents. It is likely that the DKA episodes reported by T1 respondents will have included those that were reported at the time of diagnosis.The Diabetes Control and Complications Trial (DCCT) showed that 1422 patients with T1 diabetes who were treated with intensive control of BG concentrations for 6.5 years had a 57% reduced risk of cardiovascular events over a means follow up period of 17 years compared with individuals on conventional treatment [23]. These trials suggest that the balance of recurrent hypoglycaemia against the advantages of a low HbA1c value should consider factors such as the patient’s age, duration of diabetes and comorbidities. The results from this survey which focus on the common needs of insulin users show that careful follow-up after diagnosis, frequent testing and education about calorie turnover from intake and exercise are required for both T1 patients but more so for T2 patients whose needs become similar to those of T1 patients once they begin to inject insulin. Although these T2 insulin patients are often older than T1 insulin users who are often children at time of diagnosis the same resources should be made available in terms of management and treatment of their diabetes. The HbA1c value forms an important part of a diabetes patient’s management and subsequent treatment and as insulin is a potent drug the possibility of hypoglycaemia is always present. Treatments should therefore include judicious and frequent testing with a basal bolus insulin regimen. For T2 patients who struggle with BG management and frequent hyperglycaemia the introduction of insulin injections should also be much earlier before cumulative effects of complications make the patient too ill to really benefit.
5. Conclusions
- Aside from the serious personal consequences, the cost of diabetes and its complications has been variously quoted as 5-10% of the UK NHS budget [10], depending on the costing criteria and a recent report quotes this as equating to about £1m/h. The results from this study show that current treatment and management of diabetes care still poses difficulty for most patients and that for T1 and T2 diabetes patients further improvement is required.
ACKNOWLEDGEMENTS
- This paper presents independent research awarded under NEAT (New and Emerging Applications of Technology –Grant KO24), part of the Invention for innovation (i4i) programme of the National Institute for Health Research (NIHR). The views expressed in this publication are those of the authors and not necessarily those of the NHS, the NIHR or the Department of Health.