-
Paper Information
- Previous Paper
- Paper Submission
-
Journal Information
- About This Journal
- Editorial Board
- Current Issue
- Archive
- Author Guidelines
- Contact Us
International Journal of Diabetes Research
p-ISSN: 2163-1638 e-ISSN: 2163-1646
2013; 2(6): 112-122
doi:10.5923/j.diabetes.20130206.04
Plasma Vaspin Levels in Relation to Diet Induced Metabolic Disturbance in Rats
 Abstract
 Reference
 Full-Text PDF
 Full-text HTML
Mohammad A. Alghannam, Abeer A. Khalefa, Dalia I. Abd Alaleem, Ahmad A. Ahmad
Physiology department, Faculty of Medicine, Zagazig University
Correspondence to: Abeer A. Khalefa, Physiology department, Faculty of Medicine, Zagazig University.
| Email: |  |
Copyright © 2012 Scientific & Academic Publishing. All Rights Reserved.
Background: Vaspin is an adipocytokine with insulin-sensitizing effects. However, the relationship between vaspin level and metabolic disturbances is still controversial. Aim of this research was to investigate the relationship between vaspin levels and some of metabolic derangements induced by different types of diet in rats. Material and Methods: 40 healthy, albino wistar male rats of 120-150 gm weight were divided equally into four groups; (I) normal diet, (II) high fat diet “HFD”, (III) high fructose diet “HFrD” and (IV) high fat high fructose diet “HFHFrD”. The groups were fed for 12 weeks. Plasma levels of vaspin, glucose, insulin, total cholesterol (TC), triglycerides (TG), low density lipoproteins (LDL-C) and high density lipoproteins (HDL-C) were measured, in addition to measuring of arterial blood pressure (MABP). Results showed significant increase in vaspin, insulin, TC, LDL-C and TG levels and decrease in HDL-C levels in parallel with increase in BMI, abdominal circumference/thoracic circumference (AC/TC) ratio and MABP in the three fed groups when compared with the fourth normal diet fed group. These changes were more obvious in HFFrD fed group than in HFD and HFrD fed groups.It was found that vaspin levels positively correlated with BMI, AC/TC ratio, HOMA-IR , serum levels of glucose, insulin, TC, LDL-C and TG in all groups. Conclusion: Serum vaspin levels were significantly elevated in diet induced metabolic disturbance in rats and positively correlated with the measured anthropometric and metabolic parameters (except for HDL-C) in all groups. These findings clarify that vaspin can be used as a novel biomarker for diet induced metabolic derangement. As this adipokine was previously identified with insulin-sensitizing effects, its increase may play a compensatory role in this metabolic disturbance.
Keywords: Vaspin, Diet, Insulin, Fat, Fructose, Obesity, Rats
Cite this paper: Mohammad A. Alghannam, Abeer A. Khalefa, Dalia I. Abd Alaleem, Ahmad A. Ahmad, Plasma Vaspin Levels in Relation to Diet Induced Metabolic Disturbance in Rats, International Journal of Diabetes Research, Vol. 2 No. 6, 2013, pp. 112-122. doi: 10.5923/j.diabetes.20130206.04.
1. Introduction
- Globally, the incidence of obesity is rising rapidly, not only in industrialized nations but also in developing countries. Over the last several decades, obesity has been considered a public health problem due to its associated disorders, including insulin resistance, type II diabetes mellitus (T2DM), dyslipidemia, hypertension, and cardiovascular disease[1]. Apparently, accumulation of adipose tissue in the abdominal cavity, rather than excess body fat, is the major player in the adverse metabolic consequences of obesity[2] It is well known that modern diet rich in carbohydrates such as fructose and sucrose as well as saturated fat, play an important role in the genesis of obesity and metabolic syndrome[3].Numerous studies conducted in the past decade have revealed that adipose tissue secretes a variety of bioactive substances that circulate and affect target tissues[4]. Visceral adipose tissue-derived serpin (vaspin), was identified as an adipokine with insulin-sensitizing effects, which is a member of serine protease inhibitor family and has been identified to be predominantly secreted from visceral adipose tissue in a rat model of abdominal obesity and T2DM[5,6]. Vaspin was recommended to play a role in the pathogenesis of metabolic syndrome based on the evidence from animal experiments that used recombinant vaspin[5,6]. However, the correlation between serum vaspin levels and markers of insulin sensitivity, glucose metabolism, and obesity is still controversial[7-12].Therefore, this research was designed to study whether vaspin levels are altered in case of diet induced metabolic derangement and to study the correlation of this adipocytokine and different biochemical parameters of glucose and lipid metabolism in this case in adult male albino rats.
2. Methods
- AnimalsThis study was conducted on 40 healthy albino wistar male rats of 120-150 gm weight, were obtained from the animal house of the faculty of veterinary medicine of Zagazig University. The animals were kept in steel wire cages (4-6 rats/ cage) in the physiology animal house in faculty of medicine of Zagazig University under hygienic conditions.Animals had free access to water, kept at room temperature and were maintained on a 12h light/dark cycle. The rats were accommodated to animal house conditions for 2 weeks before the experiments took place. The experimental protocol was reviewed and approved by Institutional Review Board in faculty of Medicine of Zagazig University.Protocol and Experimental groups:The animals were divided into four equal groups (n=10): Group I "control group" which was fed a standard chow consisted of 25.8% protein, 62.8% carbohydrate (starch) and 11.4 % fat (lard)[13] for 12 weeks.Group II "High fat diet fed group (HFD)" which was fed a high-fat chow containing 21% protein (casein and methionine), 20% carbohydrate (starch), 59% fat (lard)[13].Group III "High fructose diet fed group (HFrD)" which was fed on diet containing 60% fructose instead of starch of the control diet[14].Group IV "High fat high fructose diet fed group (HFFrD)" which was fed on mixed diet containing 45% fructose and 20% lard and %35 protein[15].The diet was obtained from Faculty of Agriculture, Zagazig University.Anthropometric Parameters1- Measuring body weight: according to Nascimento et al.[16] 2- Measuring rat length: according to Novelli et al[17]. 3- Measuring abdominal circumference (AC) and thoracic circumference (TC): according to Novelli et al.[17].4- Calculating BMI index and AC/TC ratio: body mass index (BMI) equals body weight (gm) / length2 (cm2),[17]. Lastly, AC was divided on TC to calculate AC/TC ratio which is a measure of development of abdominal or visceral obesity[17].Measurement of Arterial Blood Pressure: An overnight fasted (8–10 h) rat was anesthetized with urethane (1200 mg/kg).The reflexes of the animal were checked, and it is placed on the rodent surgical table. The skin on the ventral side of the neck, right hind leg, and chest is carefully shaved and disinfected[18].Procedure for tracheostomy: A small incision (1.5–2 cm) is made in the neck of the rat for tracheostomy and carotid artery cannulation. The skin in the neck region is carefully cut open, and a slit incision is made in the rat platysma muscles. The trachea is identified, small incision is made on the cartilage tissue, and the tracheostomy is performed using a small piece of tracheal intubation tube[18].Procedure for cannulation of carotid artery: the carotid artery (red in color) is identified along with the vagus nerve (white in color) on either side of the trachea. One side of the carotid artery, along with the vagus nerve, is separated from the adjacent connective tissue and cleaned carefully without stimulating the vagus nerve. The blood vessel is separated from the vagus using a small needle, and the cephalic end of the blood vessel is tied and the cardiac end is clamped with a bulldog clamp for cannulation. The blood vessel is cannulated using a cannula pre-filled with heparinized normal saline (0.5 IU/ml).The other end of the cannula connected to a three-way stopcock connected to the pressure transducer and a syringe filled with heparinized saline. Then the carotid artery cannulation site is tied with a thread without obstructing the blood flow in the carotid cannula. After cannulation, the bulldog clamp at the cardiac end of the blood vessel is released slowly, ensuring that there is no bleeding at the cannulation site[18].Recording blood pressure: Calibration is performed using a known pressure levels with the help of a sphygmomanometer. The pressure cuff of the sphygmomanometer is removed and connected to the pressure transducer. Then, the pressure transducer is checked by inflating to a known pressure level. The conversion factor for calculating BP is determined. The calibration between the voltage (millivolts) and the pressure is performed, and the results are automatically calculated based on the calibration value and mean arterial blood pressure (MABP) can be calculated.After cannulation, the animal is connected to the Power Lab (AD Instruments Pty Ltd, Australia) to record the BP. The whole setup is allowed to stabilize for 10–20 min, during this time the animal is also monitored for any kind of bleeding. Blood sampling: Blood samples (about 8 ml/rat) were obtained from the heparinized cannulated carotid artery[19], and plasma was separated by centrifugation of blood at 3000 rpm for 15 min. The plasma was pipetted off using fine tipped automatic pipettes and stored frozen at -20ºC until assayed. Repeated freezing and thawing was avoided[20].Biochemical and Hormonal measurements:-Estimation of Plasma vaspin levels by Enzyme Amplified Sensitivity Immunoassay using (WKEA MED SUPPLIES CORP, 450 11th Ave, New York, NY 10123, USA) Kits.-Estimation of Plasma glucose levels according to Tietz,[21] using INS-EASIA, AP1251 (BioSource Europe S.A.-Rue de l’Industrie, 8-B- 1400 Nivelles-Belgium) kits.-Estimation of Plasma insulin levels by a solid phase enzyme amplified sensitivity immunoassay according to Temple et al.[22] using INS-EASIA, KAP1251 (BioSource Europe S.A.-Rue de l’Industrie, 4-A- 1300 Nivelles-Belgium) kits.-Estimation of Plasma total cholesterol (TC) levels by enzymatic colorimetric method according to Tietz,[21] using (BioSource Europe S.A.-Rue de l’Industrie, 8-B- 1400 Nivelles-Belgium) kits.-Estimation of Plasma triglycerides (TG) levels according to fossati,[23] using triglycerides ESPAS SL kits (Elttech S.A., Sees, France.)-Estimation of Plasma high density lipoprotein cholesterol (HDL-C) levels by enzymatic colorimetric method according to Nauck et al.[24], using (BioSource Europe S.A.-Rue de l’Industrie, 8-A- 1340 Nivelles-Belgium) kits .-Plasma low density lipoprotein cholesterol (LDL-C) levels were calculated according to Friedewald et al.[25].-Calculation of The homeostasis model of assessment of insulin resistance (HOMA-IR) =[insulin (µIU/ ml) x glucose (mmol/l) / 22.5] and[HOMA-IR = insulin (µIU /ml) x glucose (mg/dl) /405][26,27].Statistical analysis:Data were presented as mean ± S.D Statistical significance was determined by one way analysis of variance (ANOVA) followed by LSD test, P values less than 0.05 were considered to be significant. The correlations between parameters were analyzed using Pearson,s correlation.In statistical analysis, SPSS version 18 program for Windows (SPSS Inc. Chicago, IL, USA) was used.
3. Results
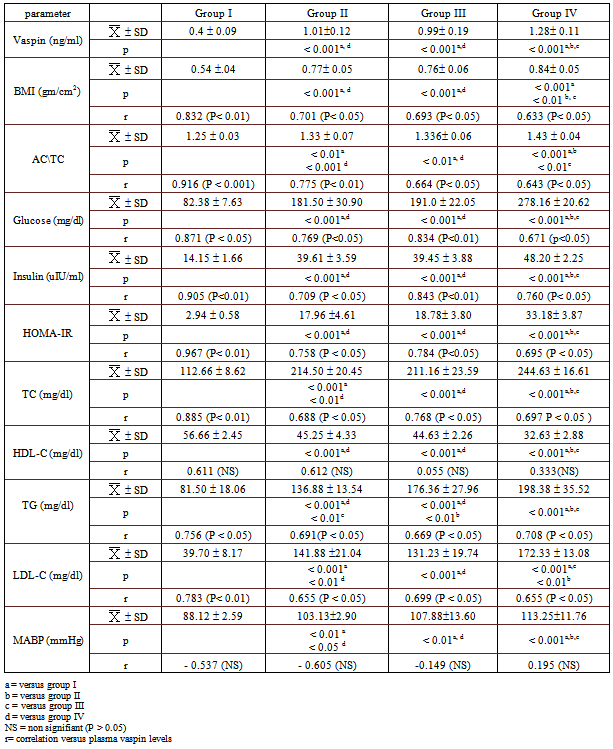
- Table 1: Circulating levels of vaspin, anthropometric parameters, metabolic parameters and arterial blood pressure in all studied groups. As regards vaspin levels (ng/ml), the mean values in group II (HFD), group III (HFrD) and group IV (HFHFrD) (1.010.12, 0.990.19 and 1.280.11, respectively) were significantly higher than that of group I (control) (0.4 0.09) (P < 0.001). In addition, the mean value of group IV was significantly higher than that of both group II and III (P < 0.001), but there was no significant difference between group II and group III (P > 0.05).As regards anthropometric parameters {BMI (gm/cm2) and (AC/TC)}, the mean value of BMI in group II, group III and group VI (0.77 0.05, 0.76 .058 and 0.84 0.05, respectively) were significantly higher than that of group I (0.54 0.04) (P < 0.001). Moreover, the mean value of group IV was significantly higher than that of both group II and group III (P < 0.01 and P < 0.001, respectively), however, there was no significant difference between group II and group III (P > 0.05). The mean value of AC/TC in group II, group III and group IV (1.33 0.07, 1.336 0.06 and 1.43 0.04, respectively) were significantly higher than that of group I (1.25 0.03) (P < 0.01, p< 0.01 and p< 0.001, respectively). In addition, the mean value of group IV was significantly higher than that of both group II and group III (P < 0.001 and P < 0.01 ,respectively), while there was no significant difference between group II and group III (P > 0.05).In addition, there was a significant positive correlation between circulating vaspin levels and the anthropometric parameters (BMI and AC/TC ratio) in all groups: group I (r=+0.832 (P< 0.01) & r=+0.916 (P < 0.001), Group II {0.701 (P< 0.05) & 0.775 (P< 0.01)}, group III {0.693 (P< 0.05)& 0.664 (P< 0.05)}, and group IV {0.633 (P< 0.05)& 0.643 (P< 0.05)}, respectively). As regards glucose metabolic parameters, the mean values of Glucose (gm/dl), insulin (uIU/ml) and HOMA-IR in group II (181.50 30.90, 39.61 3.59 and 17.96 4.61, respectively), group III (191.0 22.05, 39.45 3.88 and 18.78 3.80, respectively) and group IV (278.16 20.62, 48.202.25 and 33.183.87, respectively) were significantly higher than that of control group (82.38 7.63, 14.15 1.66 and 2.94 0.58, respectively) ( P < 0.001). While the mean value of glucose, insulin and HOMA-IR in group IV was significantly higher than that of groups II and III (P < 0.001), there was no significant difference between group II and group III (P > 0.05).In addition, there was a significant positive correlation between circulating vaspin levels and glucose metabolic parameters (glucose, insulin and HOMA-IR) in groups I {r=+0.871 (P < 0.05), r=+0.905 (P<0.01) and r=+ 0.967 (P< 0.01), respectively}, II {r=+0.769 (P<0.05), r=+0.709 (P < 0.05) and r=+ 0.758 (P < 0.05), respectively}, III {r=+0.834 (P<0.01), r=+0.843 (P<0.01) and r=+0.784 (P<0.05), respectively}, and group IV{0.671 (p<0.05), 0.760 (P< 0.05) and 0.695 (P < 0.05), respectively}.Regarding lipid profile parameters (gm/dl), the mean values of TC, TG and LDL-C in group II (214.50 20, 136.88 13.54 and 141.88 21.04, respectively), group III (211.16 23.59, 176.36 27.96 and 131.23 19.74, respectively) and group IV (244.63 16.61, 198.38 35.52 and 172.33 13.08, respectively) were significantly higher than that of control group (112.66 8.62, 81.50 18.06 and 39.70 8.17, respectively) (P < 0.001). In addition, the mean value of TC, TG and LDL-C in group IV was significantly higher than that of group II and III (P < 0.001), while there was no significant difference in TC and LDL-C levels between groups II and III (P > 0.05), TG levels were higher in group III when compared to that of group II (p<0.01). Moreover, there was a significant positive correlation between circulating vaspin levels and TC, TG and LDL-C levels in all groups: group I {(r = +0.885 (P < 0.01), r = +0.756 (P < 0.05) and r = +0.783 (P < 0.01), respectively)}, group II {r=+0.691(P < 0.05), r=+0.688 (P < 0.05) and r =+ 0.655 (P < 0.05), respectively)}, group III { r=+0.669 (P < 0.05), r=+ 0.768 (P < 0.05) and r = +0.699 (P < 0.05), respectively)} and group IV { r=+0.708 (P < 0.05), r=+0.697 P < 0.05) and r =+ 0.655 (P < 0.05), respectively)}.Furthermore, the mean values of HDL-C in group II (45.25 4.33), group III (44.63 2.26) and group IV (32.63 2.88) were significantly lower than that of control group (56.66 2.45) ( P < 0.001). While the mean value of HDL-C in group IV was significantly lower than that of groups II and III (P < 0.001), there was no significant difference between group II and group III (P > 0.05)Moreover, there was no significant correlation between circulating vaspin levels and HDL-C levels in any of the studied groups (P > 0.05). In addition, the mean values of MABP (mmHg) in group II (103.132.90), group III (107.8813.60) and group IV (113.2511.76) were significantly higher than that of control group (88.12 2.59) (P < 0.01, P < 0.01 and P < 0.001, respectively). While the mean value of MABP in group IV was significantly higher than that of groups II and III (P < 0.05 and P < 0.01, respectively), there was no significant difference between group II and group III (P > 0.05).Furthermore, there was no correlation between circulating vaspin levels and MABP in any of the studied groups (P > 0.05).
|
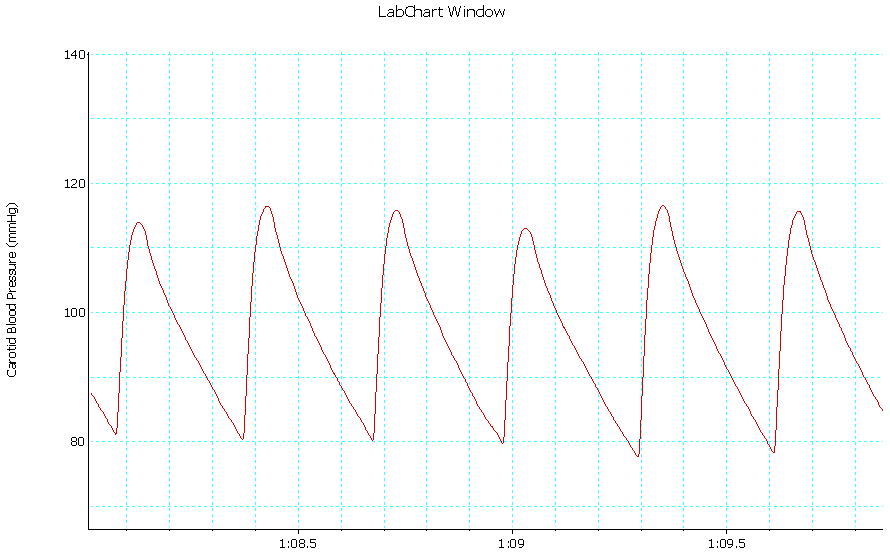 | Trace 1. Shows an example of a record of arterial BP in group I |
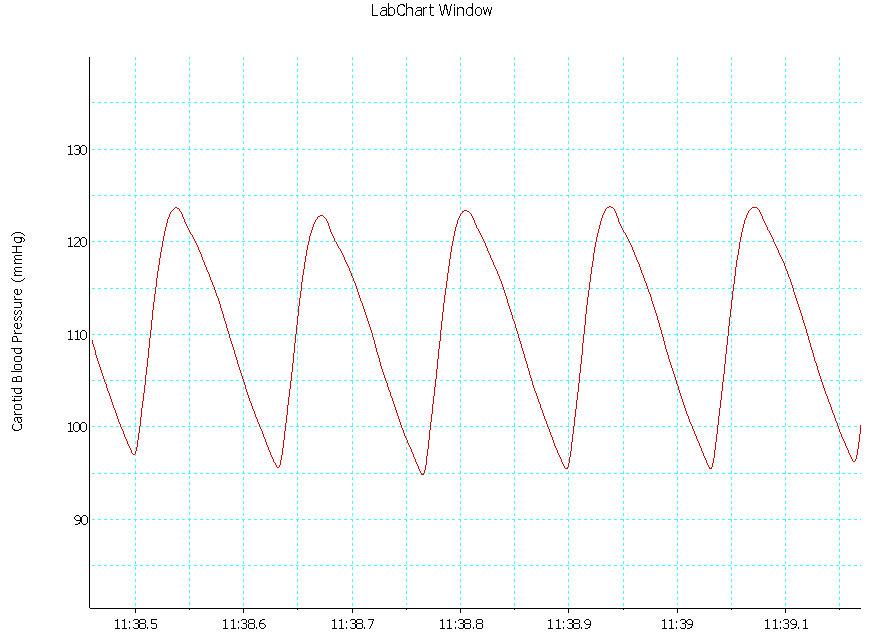 | Trace 2. Shows an example of a record of arterial BP in group II |
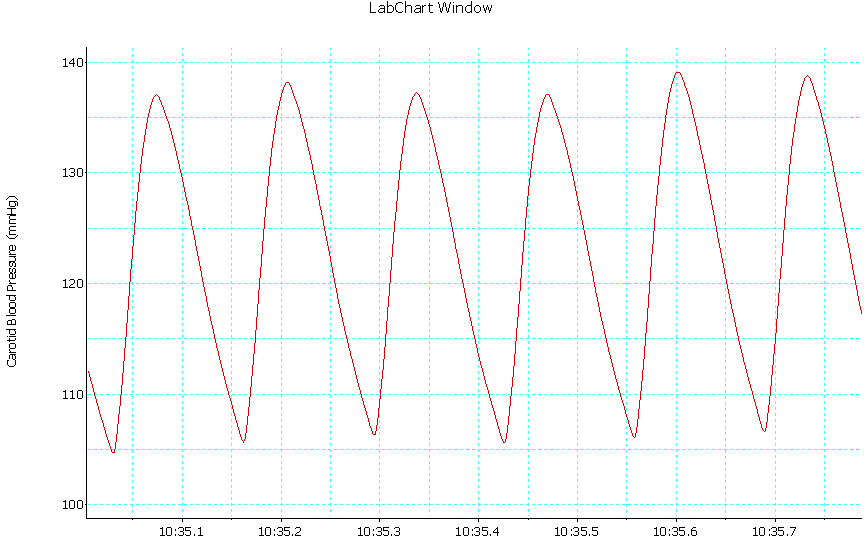 | Trace 3. Shows an example of a record of arterial BP in group III |
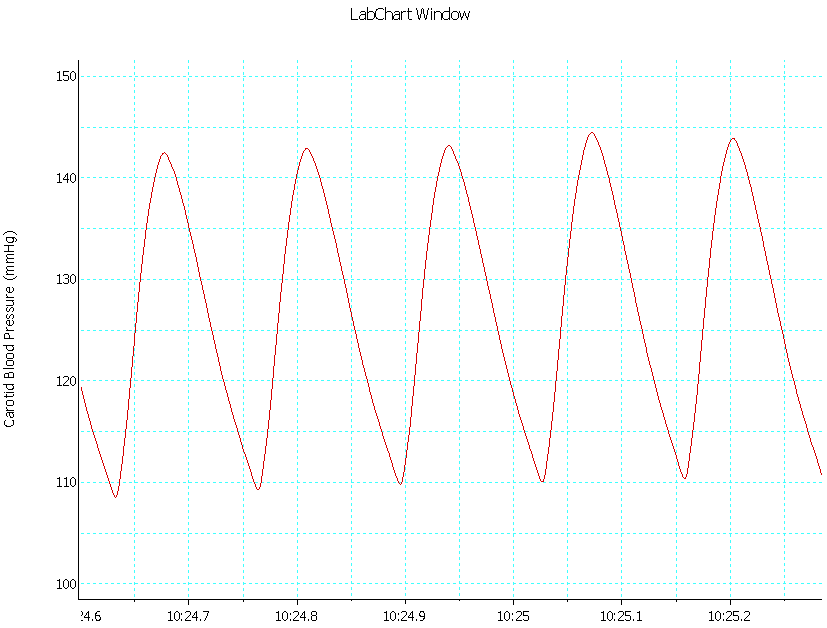 | Trace 4. Shows an example of a record of arterial BP in group IV |
4. Discussion
- During the past decade, it became obvious that the consequences of obesity, particularly insulin resistance, are influenced to a great extent by the actions of adipokines. Many studies support the key role of some of these adipokines in the development of obesity-related disorders and the metabolic syndrome, particularly in the pathogenesis of T2DM[28]. Vaspin is identified as a potential insulin-sensitizing factor and its expression in visceral white adipose tissue (WAT) is related to metabolic derangement in rat model of obesity and T2DM. Therefore, vaspin could have an essential role in pathogenesis of obesity and metabolic syndrome. However, the regulation of its circulating levels in obesity and T2DM is still controversial[6,29,28].In light of the previous data, this study aims to explore the relationship between circulating vaspin and metabolic derangement induced by different types of diet (HFD, HFrD and HFHFrD) for 12 weeks in adult male albino wistar rats.In the present study, according to our results, significant high circulating vaspin levels were found in rats fed on HFD, HFrD and HFHFrD compared with the controls. Moreover, circulating vaspin level was significantly high in rats fed on HFHFrD when compared with that of both HFD and HFrD.As an adipocytokine; vaspin is mainly expressed in adipose tissue, particularly visceral adipose tissue, so the elevated circulating vaspin levels in HFD, HFrD and HFHFrD fed groups can be explained by diet induced obesity (DIO); and this in line with our results that showed significant high BMI and AC/TC ratio, as anthropometric markers of obesity, in those groups when compared with that of control group.Moreover, circulating vaspin levels were significantly and positively correlated with BMI and AC/TC ratio in all groups.The results are in agreement with Youn et al.[9], and Ko et al.[12] who reported higher vaspin concentrations in overweight subjects when compared to the controls. Moreover, Choi et al.[30]; Feng et al.[31] and Saalbach et al. [32] reported that vaspin was positively correlated with BMI in the healthy controls. However, this correlation is not found in the diabetic groups.In contrast to the results, You-min et al [33] found that serum vaspin was decreased and negatively correlated with body weight in chronic high fat diet induced metabolic syndrome in rats.As a third opinion, Auguet et al.[34] demonstrated that serum vaspin levels did not increase in morbidly obese women and that vaspin levels did not correlate with BMI.Another finding in the results is a significant high circulating vaspin levels found in HFHFrD fed group (IV) when compared with that of HFD and HFrD fed groups (groups II and III, respectively). However, no significant difference in circulating vaspin levels was found between HFD and HFrD fed groups. So, in addition to obesity; diabetic status, insulin resistance and its severity are a second possibility to explain the rise in circulating vaspin level in diet induced metabolic derangement. Accordingly, the results showed significant high levels of glucose, insulin and calculated HOMA-IR in the three groups as compared with the control group. Moreover, circulating vaspin levels are significantly and positively correlated with circulating glucose levels, circulating insulin levels and calculated HOMA-IR in all groups. This finding could be explained by vaspin induction, being insulin sensitizing, as a compensatory mechanism in states of impaired glucose tolerance[5,35].The current results are in line with those of other investigators who reported that serum vaspin levels were found to be significantly high in T2DM and correlated positively with markers of insulin resistance and glycemic control such as fasting circulating glucose, HOMA-IR, insulin, and HbA1c %[36-39].It is noteworthy to point that vaspin messenger RNA expression was previously found to be absent in lean normal glucose tolerant individuals and was more frequently detected in T2DM patients[7]. In addition, glucose is found to cause a significant dose-dependent increase in vaspin net protein production and secretion from human omental adipose tissue explants[40] which indicates that vaspin is induced by hyperglycemia and explains the significant correlation between vaspin and glucose levels in the current study.Gulcelik et al.[41] found that patients on metformin that enhances peripheral glucose uptake and improves insulin sensitivity, had less serum vaspin levels than patients who were not taking metformin. This explains the relation between vaspin and insulin levels in the present study. Moreover, Zhang et al. [38] found that circulating vaspin levels significantly increased in patients with poor glycemic control, however, vaspin levels significantly decreased by rosiglitazone treatment as compared with the T2DM patients inadequately controlled on metformin alone. It was reported that the reduction of circulating vaspin levels was associated with the amelioration of insulin sensitivity as shown by the changes in fasting insulin levels and HOMA-IR.In the same context, Hida et al.[5] reported that administration of recombinant human vaspin improved insulin sensitivity, glucose tolerance and suppressed the expression of the genes related to insulin resistance such as resistin and tumor necrosis factor-alpha (TNF-α), in diet-induced obese mice, whereas it increased that of the glucose transporter-4 and adiponectin in WAT. Moreover, Youn et al.[9] reported that circulating vaspin was significantly correlated with leptin serum concentrations, supporting the notion that vaspin closely reflects body fat mass. In addition, González et al.[35] found that leptin administration was able to partially reverse the lower WAT vaspin levels after fasting. Therefore, these findings indicated that vaspin is strongly regulated by nutritional status and leptin is one of the nutritional signals modulating those changes.Furthermore, Shaker and Sadik [42] reported that visceral vaspin expression was higher than that of subcutaneous fat and was positively correlated with body weight, and they found that up-regulation of visceral vaspin expression in diet induced obesity was associated with insulin resistance and rise in serum leptin level. In addition, vaspin treatment was found to be associated with sustained glucose-lowering effects in leptin receptor - deficient (db/db) mice[7].Furthermore, Heiker et al.[43] provided evidence that the serpin function of vaspin is essential for its physiologic effects and demonstrated that the anti-diabetic vaspin effects in vivo was not the result from increased insulin sensitivity but are rather based on an insulin-stabilizing effect most likely by inhibiting human kallikrein 7-mediated insulin degradation.Moreover, Auguet et al.[34] found that serum vaspin levels were inversely correlated with levels of lipocalin-2 (LCN2) and interleukin-6 (IL-6). It has been reported that LCN2 is an adipokine that seems to be an independent risk factor for hyperglycemia and insulin resistance in humans. It has also been related to inflammation[44]. IL-6 is a known proinflammatory cytokine that also increased in obesity[45]. Taken together, these findings might suggest that vaspin has an anti-inflammatory profile.On the other hand, Seeger et al.[8] and Youn et al [9] did not find any difference between vaspin levels of T2DM patients and normal glucose tolerance (NGT) participants. In addition, other studies showed that there was no association between serum vaspin and HOMA-IR in non-diabetic humans[46,34].As a third opinion, it was reported that serum vaspin was correlated negatively with HOMA-IR in diabetic patients[41] and obese children[47]. Moreover, Lower serum vaspin was reported in T2DM patients with microvascular complications[41]. This controversy in the association of vaspin levels with markers of obesity and insulin resistance reported in previous studies may be due to different patient populations or other currently undefined factors that may affect vaspin or its substrate protease[40] or vaspin might be differentially regulated in humans and rodents.The present results showed also significant high levels of plasma TC, TG and LDL-C along with significant low levels of HDL-C in the three groups when compared with that of control group. Moreover, circulating vaspin levels were found to be significantly and positively correlated with some markers of lipid metabolism such as triglycerides (TG), total cholesterol (TC), and low density lipoprotein- cholesterol (LDL-C) in all groups.Our finding comes in agreement with other studies that reported positive correlation between vaspin levels and triglycerides levels in control subjects[48]. However, Seeger et al.[8] and Atya et al.[49] found no correlation between vaspin and lipid profile in diabetic patients. Moreover, El-Mesallamy et al.[37] reported that vaspin levels in T2DM, were found to be significantly correlated with some markers of lipid metabolism such as TG, TC, and to a lesser extent LDL-C, which indicates that vaspin may play a role in lipid metabolism or might be induced by diabetic dyslipidemia as a compensatory mechanism, especially because vaspin is an adipokine secreted by adipocytes. However, You-min et al[33] and Giomisi et al. [50] showed a negative association between vaspin levels and lipid profile. Regarding arterial blood pressure, a significant high mean arterial blood pressure (MABP) was found in the three groups (II, III and IV) when compared with that of control group. However, no significant correlation was found between circulating vaspin levels and MABP in any studied group.These finding comes in agreement with several other studied that found no significant association between circulating vaspin and blood pressure[51-53].However, Ko et al.[12] reported a significant positive correlation between diastolic blood pressure and circulating vaspin levels in prepubertal children. While, Lee et al.[52] found a significant negative correlation between circulating vaspin levels and systolic blood pressure.Regarding the comparison among the three groups (II, III and IV), all these groups showed significant high levels of plasma vaspin, BMI, AC/TC ratio, glucose, insulin, HOMA-IR, TC, LDL-C, TG and MABP which were accompanied by significant low levels of HDL-C when compared with that of control group.Group IV (HFHFrD) showed significant high vaspin levels, BMI and AC/TC ratio, glucose, insulin, HOMA-IR, TC, LDL-C and TG levels accompanied by low levels of HDL-C when compared with that of both HFD and HFrD fed groups (II & III). However, no significant differences were found between HFD and HFrD fed groups in levels of vaspin, BMI and AC/TC ratio, glucose, insulin, HOMA-IR, TC, LDL-C or HDL-C levels. While TG showed a significant high levels in group III when compared with that of group II.Our data are in agreement with many other studies that proved the association among obesity, dyslipidemia, insulin resistance and hypertension[54-56].HFrD is an established model for producing hyperlipidemia and hypertension in experimental animals. Our finding in line with other studies showed that HFrD administration for 8 weeks increased the body weight, blood pressure, serum glucose, TG, TC levels and decreased the HDL-C level[57,14,58].The increase in TG level in HFrD may be due to stimulation of hepatic VLDL-triacylglycerol synthesis and secretion accompanied by decreased VLDL-triacylglycerol clearance[59].Finally, this more deterioration in metabolic parameters in HFHFrD group as compared with thode of both HFD and HFrD groups can be explained by the increase in food intake (mixed diet is more palatable)[3] or may be due to the combined effects of high fat and high fructose on the metabolism.Conclusion: Circulating vaspin levels are elevated in diet induced metabolic disturbance in rats and correlated with most of the metabolic parameters. These findings verify that vaspin can be used as a novel biomarker for diet induced metabolic derangement. As this adipokine was previously identified with insulin-sensitizing effects, its increase may play a compensatory role in this metabolic disturbance. Further studies are necessary for a better understanding of the molecular mechanisms regulating vaspin, providing new insights into the pathogenesis of diet induced metabolic derangement.