-
Paper Information
- Previous Paper
- Paper Submission
-
Journal Information
- About This Journal
- Editorial Board
- Current Issue
- Archive
- Author Guidelines
- Contact Us
International Journal of Diabetes Research
p-ISSN: 2163-1638 e-ISSN: 2163-1646
2012; 1(1): 18-23
doi: 10.5923/j.diabetes.20120101.03
Influential Determinants of Blood Glucose Level of Diabetic Patients in Bangladesh
 Abstract
 Reference
 Full-Text PDF
 Full-Text HTML
Rafiqul Islam , Obaidur Rahman
Department of Population Science and Human Resource Development, Rajshahi University, Bangladesh
Correspondence to: Rafiqul Islam , Department of Population Science and Human Resource Development, Rajshahi University, Bangladesh.
| Email: |  |
Copyright © 2012 Scientific & Academic Publishing. All Rights Reserved.
The aim of this study is to assess the influential determinants of blood glucose level (BGL) of diabetic patients through multiple classification analysis (MCA) using the data extracted from 300 diabetic patients of Rajshahi Diabetes Association, Rajshahi, Bangladesh. Among all diabetic patients, it is found that the BGL is increasing with increasing age of the respondents and illiterate persons have higher mean value of BGL than that of literate person. The mean value of BGL for the respondents who have under weight is higher than that of the other category of body mass index (BMI). Again, the mean value of BGL for the respondents who have more than normal blood pressure is higher than that of the respondents who have normal and less than normal blood pressure. The respondents who are suffering from diabetic <1 year has higher mean value of BGL and BGL is increasing with increasing duration of diabetes (actually after 1-5 years duration). Also, the patients who are sleeping less than and more than normal hours have higher mean value of BGL and the patients whose diabetes increases because of food habit are more conscious and always try to control their diabetes. Again, the patients who are not controlling their diabetes through dieting and exercise have higher mean value of BGL. Also, it is identified that blood pressure, BMI, controlling diabetes through exercise, duration of sleeping, duration of suffering from diabetes, time spending in walking, controlling diabetes through dieting, increasing diabetes because of food habit, age group and educational group are the first, second, third, fourth, fifth, sixth, seventh, eighth, ninth and tenth strongest influential factor for explaining the variation on BGL respectively.
Keywords: Diabetes, Blood Pressure, BMI, Duration of Sleeping, Control of Diabetes, MCA, Bangladesh
Article Outline
1. Introduction
- Diabetes is a chronic non-communicable disease having serious health, economic and social consequence which is characterized by high levels of blood glucose resulting from defects in insulin production, insulin action and both. It is an incurable life-long disease with devastating complications which ends up in severe disability and death (James et al., 2002). According to Meo (2010), it is a major public health care problem with rapidly increasing incidence and long term complications and a leading cause of illness and death across the world. Globally, diabetes is the fourth biggest cause of death affecting countries of all income groups (IDF, 2007). It is estimated that the number of diabetic patients globally will increase from current 171 million to 366 by 2030 (Wild et al., 2004). An estimated 23.6 million (about 7.8% of the total population) people in the United States have diabetes (American Diabetes Association, 2007). In Australia, 7.4% of the adult population has diabetes (Dunstan et al., 2002). Studies in various populations in Bangladesh have reported a prevalence of diabetes from 4% to 13% among adults with some variations by urban and rural settings (Rahim et al., 2007; Sayeed et al., 2004; Rahim et al., 2004). It is estimated that Bangladesh currently has over three million people with diabetes and this number will reach 11 million by the year 2030 (Wild et al., 2004). Also, Wild et al. (2004) reported that diabetes is affecting more people in low income than high income countries. So, diabetes poses a serious threat to developed as well as developing countries like Bangladesh. As a developing country, it does not have the sufficient resource to tackle. So, it is important to identify the risk factors and to prevent of this epidemic. Studies in various populations reported that age, hypertension and BMI were significantly and independently associated with an increase in type 2 diabetes (Sanchez-Viveros et al., 2008; Kim et al., 2006; Bener et al., 2005; Gupta et al., 2003). Also, Kasim et al. (2010) found that the related risk factors were older age, duration of diabetes, poor control of diabetes and hypertension. Besides this, Veghari et al. (2010) identified that diabetes mellitus was influenced by socio-demographic factors such as sex, age, BMI, central obesity, residential area, physical activity, economic status and level of education. Again, Hussain et al. (2007) reported that the risk factors for type 2 diabetes are likely to differ in different population. So, the purpose of the study is to assess the influential determinants of blood glucose level of diabetic patients in Bangladesh and recommend some policy for prevention.
2. Data and Methods
- A total number of 300 diabetic patients (140 for male and 160 for female) at all ages were interviewed by some selected socio-economic, demographic, diabetic disease and health consciousness related question from Rajshahi Diabetes Association, Rajshahi, Bangladesh. The Multiple Classification Analysis (MCA) has been used for this objective. It provides estimates of each category of the predictor variable and at the same time, provides the coefficients for explaining the strength of the relationship. In 1934, Yates invented MCA. It was later expanded and modified by Anderson and Bancraft (1952). The computerized MCA program was made by a group of researchers at the Survey Research Center of the University of Michigan in 1963. MCA requires one dependent variable and two or more independent variable. The dependent variable can be either a continuous or a categorical variable, but all the independent variables must be categorical variables. MCA can equally handle the nominal and ordinal variables and can also deal with linear and non-linear relationships of predictor variables with dependent variable. Mathematically, the model can be addressed by the following equation: Yijk = y + ai + bj + ck + ------------------------- + eijk Where, Yijk is the value or score of an individual who falls in the i-th category of the factor A, j-th category of the factor B and k-th category of the factor C. y is the grand mean of Y. ai is the effect due to i-th category of the factor A, which is equal to the difference between y and the mean of its category of factor A.bj is the effect due to j-th category of the factor B, which is equal to the difference between y and the mean of its category of factor B.ck is the effect due to k-th category of the factor C, which is equal to the difference between y and the mean of its category of factor C.eijk is the error term related with Yijk score of the individuals.The coefficients, which are estimated by solving the normal equation systems, are called the adjusted or net effect of the predictors. These effects measure those of the predictor alone after taking into account the effects of all other predictors. If there is no interrelation among the predictors, the adjusted and unadjusted effects of the predictors will be same. The unadjusted, eta-square (η2) coefficient is a correlation ratio, which explains how well the predictor variable explains the variation in the dependent variable and is usually estimated by solving the normal equations with only one predictor. This unadjusted coefficient indicates the proportion of variance explained by a single predictor alone. Similarly, the beta-square (β2) coefficient indicates the proportion of variation explained by the other predictor variables. The beta coefficient is compared to the partial correlation coefficient in multiple regressions.
3. Variables Considered in the Analysis
- The MCA is used to evaluate the contribution of socio-economic, demographic, diabetic disease and health consciousness related variables named as: respondent’s age group, educational group, body mass index (BMI), blood pressure, time spending in walking, duration of suffering from diabetic, duration of sleeping, increasing diabetes because of food habit, controlling diabetes through dieting and controlling diabetes through exercise on the blood glucose level (BGL). In this section, BGL is taken to be the dependent variable and the remaining socio-economic, demographic, diabetic disease and health consciousness related variables are treated as explanatory variables. All selected explanatory variables are the categorical variables. All of the variables are included in this model and MCA is performed using this data. The analysis of data is made using statistical software SPSS-7.5 version.
4. Results and Discussion
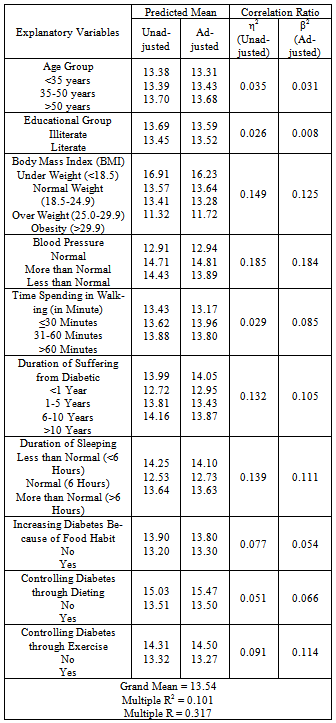
- Different types of socio-economic, demographic, diabetic disease and health consciousness related factors may influence BGL. To investigate the differential patterns of mean value of BGL of diabetic patients, the well known MCA is used. It is revealed from the results that the proportion of variance explained by MCA is R2 = 0.101. Table 1 shows the mean value of BGL both adjusted and unadjusted by various types of socio-economic, demographic, diabetic disease and health consciousness related characteristics for diabetic patients with the mean value of η2 and β2 produced from MCA.From the Table 1, it is observed that the effect of blood pressure has been found to be the first strongest influential factor for explaining the variation on BGL among all other selected variables. The result depicted that respondent’s blood pressure has strong association (η2 = 0.185) with mean value of BGL. It is also revealed that the effects of blood pressure remain low after adjusting for the effect of all other variables in the model (β2 = 0.184) i.e. the proportion of variance explained (adjusted) for this variable by this model is β2 = 0.184. The adjusted mean value of BGL is 12.94, 14.81 and 13.89 for the respondents who have normal, more than normal and less than normal blood pressure respectively. From the results, it is observed that the mean value of BGL for the respondents who have more than normal blood pressure is higher than that of the respondents who have normal and less than normal blood pressure. This result is supported by other studies. Studies in various population also identified that hypertension is an independent risk factors for the abnormalities in glucose tolerance (Ghosh et al., 2010; Kasim et al., 2010; Sanchez-Viveros et al., 2008; Kim et al., 2006; Bener et al., 2005; Habori et al., 2004; Gupta et al., 2003). So, it is important to note that more than normal blood pressure is one of the major causes for increasing BGL.Again, respondent’s BMI has found to be the second strongest influential factor for explaining the variability of BGL among the included variables. The proportion of variance explained for BMI is η2 = 0.149 and β2 = 0.125 respectively. The Table 1 also revealed that the respondents who have under weight, normal weight, over weight and obesity has on average 16.23, 13.64, 13.28 and 11.72 BGL respectively. It implies that the mean value of BGL for the respondents who have under weight is higher than that of the respondents who have normal weight, over weight and obesity. It occurs because most of the under weighted respondents don’t know that they have diabetes and they are not conscious about their health. Various studies demonstrated that BMI is significantly associated with an increase in the prevalence of type 2 diabetes mellitus, coronary artery disease and hypertension (Casanueva et al., 2010; Sanchez- Viveros et al., 2008; Balkau et al., 2007).It is observed from Table 1 that the respondent’s controlling their diabetes through exercise has found to be the third strongest influential factor for explaining the variability of BGL among all other selected variables. The proportion of variance explained for controlling diabetes through exercise is η2 = 0.091 and β2 = 0.114 respectively. The adjusted mean value of BGL for the respondents who are not controlling their diabetes through exercise and who are controlling diabetes through exercise is 14.50 and 13.27 respectively. It is clear that the mean value of BGL for the respondents who are not controlling their diabetes through exercise is higher than that of respondents who are controlling their diabetes through exercise. This result also clarify that poor control of diabetes is another risk factor of diabetes which is similar to another study done by Kasim et al. (2010). Kim et al. (2006) found that diabetes is associated with exercise and Veghari et al. (2010) identified that physical activity influences diabetes. Also, some studies reported that the prevalence of diabetes mellitus in low active people is more than in highly active people (Patrick et al., 2005; Wannamethee and Shaper, 1999). So, it may conclude that exercise plays an important role for controlling diabetes.It is also found from the Table 1, the effect of duration of sleeping is the fourth strongest influential factor for explaining the variation on BGL as well as the proportion of variance explained for duration of sleeping is η2 = 0.139 and β2 = 0.111 respectively. The adjusted mean value of BGL for the respondents whose duration of sleeping is less than normal (<6 hours), normal (6 hours) and more than normal (>6 hours) are 14.10, 12.73 and 13.63 respectively. It is clear that the mean value of BGL for the respondents who are sleeping less than and more than normal hours is higher than that of the respondents who are sleeping normal hours.From Table 1, it is observed that the effect of duration of suffering from diabetic is the fifth strongest influential factor for explaining the variation on BGL as well as the proportion of variance explained for duration of suffering from diabetic is η2 = 0.132 and β2 = 0.105 respectively. The adjusted mean value of BGL for the respondents whose duration of suffering period is <1 year, 1-5 years, 6-10 years and >10 years are 14.05, 12.95, 13.43 and 13.87 respectively. It is clear that the mean value of BGL for the respondents who are suffering from diabetic <1 year is higher than that of the respondents who are suffering from diabetic 1-5 years, 5-10 years and >10 years. Also, it is found that BGL is increasing with increasing duration of diabetes (after 1-5 years duration). It occurs because the respondents who are suffering from diabetic <1 year are not conscious about diabetic as well as the respondents who are suffering from long period of time from diabetes are older aged. Actually, the immune system of the body is decreasing with increasing age which is very harmful for health. This result is supported by the study of Kasim et al. (2010) because they found that duration of diabetes are significantly associated with an increase in diabetes. Also, Ghosh et al. (2010) found that type 1 diabetic patients with metabolic syndrome had longer duration of diabetes.It is also found from the Table 1, the effect of time spending in walking is the sixth strongest influential factor for explaining the variation on BGL as well as the proportion of variance explained for duration of sleeping is η2 = 0.029 and β2 = 0.085 respectively. The adjusted mean value of BGL for the respondents whose spending time in walking is ≤30, 31-60 and >60 minutes are 13.17, 13.96 and 13.80 respectively. Although BGL is increasing with increasing walking time, the main reason is that in Bangladesh, peoples are not conscious about their health. They come to the doctor when their health condition is very serious. In fact, most of them don’t know that they have diabetes. But undiagnosed pre-diabetes and diabetes is a major public health problem (Gossain & Aldasouqi, 2010). Also, ICDDR,B (2009) reported that diabetes and pre-diabetic conditions exist as a significant but hidden public health problem in Matlab. As a result, their BGL is high. For controlling this, patients spend time more at that period.It is observed from Table 1 that controlling diabetes through dieting has found to be the seventh strongest influential factor for explaining the variability of BGL among all other selected variables. The proportion of variance explained for controlling diabetes through dieting by this model is η2 = 0.051 and β2 = 0.066 respectively. The adjusted mean value of BGL for the respondents who are not controlling their diabetes through dieting and who are controlling diabetes through dieting is 15.47 and 13.50 respectively. It is clear that the mean value of BGL for the respondents who are not controlling their diabetes through dieting is higher than that of respondents who are controlling their diabetes through dieting. It implies that poor control of diabetes influences BGL which is similar to another study conducted by Kasim et al. (2010). So, it may conclude that dieting plays an important role for controlling diabetes.
|
5. Conclusions and Recommendation
- Among all diabetic patients, the BGL is increasing with increasing age of the respondents and illiterate persons have higher mean value of BGL than that of literate person. It is found that the mean value of BGL for the respondents who have under weight is higher than that of the respondents who have normal weight, over weight and obesity. It occurs because most of the under weighted respondents don’t know about their diabetic condition and they are not conscious about their health. Again, respondent’s blood pressure has strong association with the mean value of BGL. The mean value of BGL for the respondents who have more than normal blood pressure is higher than that of the respondents who have normal and less than normal blood pressure. Although BGL is increasing with increasing walking time, the main reason is that in Bangladesh, peoples are not conscious about their health. They come to the doctor when their health condition is very serious. Again, the mean value of BGL for the respondents who are suffering from diabetic <1 year is higher than that of the respondents who are suffering from diabetic 1-5 years, 5-10 years and >10 years. Also, it is found that BGL is increasing with increasing duration of diabetes (actually after 1-5 years duration) and the mean value of BGL for the respondents who are sleeping less than and more than normal hours is higher than that of the respondents who are sleeping normal hours. It is also observed that the patients whose diabetes increases because of food habit are more conscious and always try to control their diabetes. Again, the mean value of BGL for the respondents who are not controlling their diabetes through dieting and exercise is higher than that of respondents who are controlling their diabetes through dieting and exercise respectively. Also, it is identified that blood pressure, BMI, controlling diabetes through exercise, duration of sleeping, duration of suffering from diabetes, time spending in walking, controlling diabetes through dieting, increasing diabetes because of food habit, age group and educational group are the first, second, third, fourth, fifth, sixth, seventh, eighth, ninth and tenth strongest influential factor for explaining the variation on BGL respectively.In the light of this study, it would be strongly suggested to reduce the risk of diabetes as well as non-communicable diseases that controlling blood pressure, exercise with increased physical activity, normal sleeping, eating balanced diets with high fiber and avoidance of adult weight gain are needed. Also, development and implementation of public health programs should be taken.