Kamran Yousefpour1, Seyyed Javad Hosseini Molla2, Seyyed Mehdi Hosseini3
1Department of Electrical and Computer Technology, Islamic Azad University, Sari, Iran (MSc degree)
2Department of Electrical and Computer Technology, Noushirvani University of Technology, Babol, Iran (MSc degree)
3Department of Electrical and Computer Technology, Noushirvani University of Technology, Babol, Iran (Assistant Professor)
Correspondence to: Kamran Yousefpour, Department of Electrical and Computer Technology, Islamic Azad University, Sari, Iran (MSc degree).
| Email: |  |
Copyright © 2015 Scientific & Academic Publishing. All Rights Reserved.
Abstract
Minimizing the power system costs, specially the costs associated with network load growth is the final aim of a distribution system plan (DSP). Moreover, distributed generation (DG) is one of the most useful technologies for applying in DSP problems. Thus DGs in a distribution network must be planned in a way that this aim is fulfilled. In this paper, a new model based on DG solution is proposed to solve DSP problem in a power grid. In this model, an optimal power flow (OPF) is implemented to minimize the system expenses including operation and maintenance, and losses costs for handling the increased load. It is a dynamic distribution system planning (DDSP) because the schedule is provided over a whole period and also feeder reinforcement, substation expansion and new DGs installation are considered simultaneously as alternatives to load growth. Modified particle swarm optimization (PSO) algorithm is also used for the first time to obtain optimal topology of DGs. This algorithm is chosen because of its high efficiency in terms of shorter computational time and better convergence compared to other approaches. Performance of this method is evaluated on a sample radial distribution system in two cases. The results are also compared to a static planning method results.
Keywords:
Distribution System Planning, Distributed Generation, Optimal Power Flow, Dynamic Distributed System Planning, Particle Swarm Optimization
Cite this paper: Kamran Yousefpour, Seyyed Javad Hosseini Molla, Seyyed Mehdi Hosseini, A Dynamic Approach for Distribution System Planning Using Particle Swarm Optimization, International Journal of Control Science and Engineering, Vol. 5 No. 1, 2015, pp. 10-17. doi: 10.5923/j.control.20150501.02.
1. Introduction
Distribute generation is defined as any small scale generation unit which aims to generate power as near as possible to load centers. This technology has been introduced as an attractive solution for DSP problems in power networks.DG applications are growing rapidly due to its various advantages for environmental pollution reduction, and technological and economic improvements [1]. Moreover, the power flow in a traditional centralized network is unidirectional while it would be multidirectional by using DGs in a grid. Thus, the increased demand in a traditional DSP program could be supplied by expanding a substation through installing new transformers or building new substations. If this additional equipment and load result in overloaded feeders, investing in reinforcement or construction of feeders may be required. Therefore, traditional DSP methods would not be economical in a case of load variation.DGs can offer important support to the conventional centralized power sources [2-4]. In fact, in a case of a load increase it can be installed quickly and easily almost everywhere due to its small size and low investment cost. Its other advantages include reducing line losses, releasing the line capacity, voltage profile improvement, and increasing the electrical network efficiency.Besides DG benefits, it also has some negative impacts. Indeed, DG operation highly depends on its location and sizing. Improper DG placement may impose some technical and economic deficiencies on the network such as voltage oscillations, increase fault currents [5]. Hence, appropriate computational frameworks and models are needed to efficiently plan DG placement in a grid.Various optimization approaches have been applied previously for finding optimal topology for the DGs in a grid. The first step in these methods is determining the objective function, which mainly contains system expenses. DG capacity constraints also must be considered in the method. In some of these approaches, in addition to DG implementation some other options such as additional transformer installation and power purchase from market have been included to compensate the demand increase. Thus, to install DG units properly, a suitable optimization algorithm must be chosen and the solution characteristics must be tested and investigated in different situations.A large number of papers have been published about distribution system planning based on DG solution. Different approaches have been implemented in these studies for optimal planning of power distribution network. In [6], distribution system planning (DSP) is planned in a planning horizon which is divided into several short periods. Reference [7] studied the impact of DG penetration on system expenses. A new method is proposed in [8] to determine the network's ability for DG units. The relation between DG size maximization and its cost and damage minimization has been investigated in [9], [10]. In the previous studies, PSO algorithm has not been used in DSP problem. Furthermore, planning is static which means that each year planning is independent of another year [11-13].In this paper, a number of DGs are considered within the network during load demand increase. In this model, the objective function is composed of capital costs, cost of operation, maintenance and power losses. In fact, the optimization strategy has been adopted in a way to minimize the function. Technical constraints considered include power amount, voltage drop, and capacity limits of distribution feeders and transformers, and capacity storage. The optimal solution i.e. the best exchange between different investment biddings is obtained by using the Newton-Raphson (NR) dispatch for each planning strategy. Dynamic distribution system planning (DDSP) is proposed here in a specific time interval. Hence, all years are simultaneously studied such that the condition of each year affects on the planning of the other year. Each year of the planning period is discussed and evaluated and the problem is ended by the best timetable for equipment investment. The effectiveness of the method is also illustrated on a sample radial network.The next sections of the paper are organized as follows: proposed model description is presented in section 2. Optimization method is described in the next section. Section 4 contains sample radial network information. Numerical results are shown in section 5. Finally section 6 presents the conclusion.
2. Model Description
Here a mathematical formulation for the proposed model is presented. This model is based on the static model proposed in [12], but a year-dependent decision variable is included here which converts the static model to dynamic model. Objective function and constraints are described in this section.
2.1. Cost Function
The cost function (CF) consists of two parts. The first part is the DG costs and the second part is related to the power purchase cost: | (1) |
Where X includes operation and maintenance (O&M) cost of DGs, losses cost, and DG purchase cost.Y is the sum of power purchase costs, cost of purchasing new 10 MVA transformers and feeder reinforcement expenses (it is required if the power exceeds allowable amount of 12 MVA).The annual investment cost of the equipment ($/MVA) can be expressed as a function of total investment costs (EAC), planning duration (LE) by a reduction rate (d) as in (2).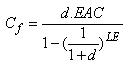 | (2) |
The above equation indicates that the annual investment cost of the equipment reduces as its lifetime increases [14].Considering model in [12] with additional year-dependent variable, X is formulated as follows: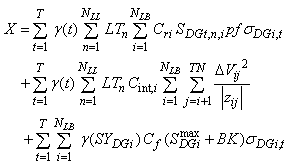 | (3) |
The two variables  and
and  are the decision binary variable (showing the existence of DG in year t) and
  capacity respectively which must be determined through the optimization algorithm.In the first term of (3), DG operating and maintenance (O&M) cost is calculated. It is assumed that supporting units don’t have any O&M costs so that they are just used in the emergency situations. Thus these units are not considered in the calculations. Moreover, each DG unit is assumed to be implemented based on its O&M costs compared to other available resources( alternatives like purchasing from the upstream network or other available DGs) so that with
 is used to calculate the O&M cost over each load-level period (using an OPF). If the total DG operation hour exceeds its operation time limit, it will not be considered as an option for that year and other resources will be applied for the remaining hours of that year. It should be noted that each of the power sources have its own O&M costs and this value is considered equal to zero for the renewable sources [15].In addition,
  is used to convert future costs to present costs [16].
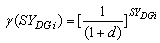 | (4) |
The second term in (3) represents the system damages cost that is calculated for each load level during the planning period. It should be also considered that  which is in terms of hours and the actual amount of load (megawatts), is indirectly considered in the calculation of
  The third term of (3) is the investment cost which can be obtained by adding the investment costs during the whole planning period. This value should be added to the objective function considering the technology that is used [15]. A backup DG unit (for emergency) is also considered to be added at the buses for which a DG is justified. Whatever capacity is justified for a DG, a fixed amount of backup capacity (BK = 2MVA) would be considered at that bus. This unit will be installed in emergency conditions and will be operated only if an unpredictable error occurs in the system. Thus, there will be an amount of reserved power in all points of the network.Considering model in [12], Y formulation is presented as follows.
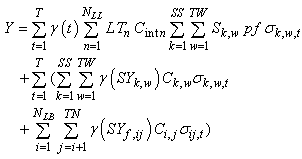 | (5) |
The first term the above equation calculates the amount of electricity purchased from the market. The second term is related to the cost of purchasing transformers with potential capacity of 10MVA. Finally, the third term is the cost of feeder reinforcement and renovation.As it can be seen regarding the elements of the objective function, planning problem is a kind of mixed integer nonlinear programming problem (MINP).
2.2. Constraints
The problem constraints are defined as follows:1) Total power conservation: Considering the power losses in the feeders, the summation of all input and output power of distribution feeders in the network should be equal to the power demand at that bus.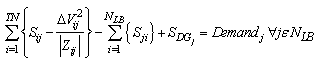 | (6) |
2) The voltage drop rate: The maximum voltage variation in each of the buses should be equal to 
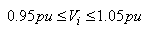 | (7) |
3) Thermal limit of distribution feeders: In a case of a load growth, the maximum power of feeders should not exceed a given level. If the power flow exceeds this value, then it is needed to reinforce the feeders.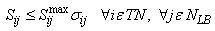 | (8) |
4) DG capacity: The total generated power of DG should be in the capacity range of substation transformers.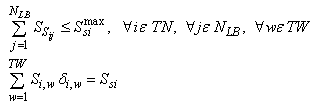 | (9) |
5) DG operation capacity: DGs’ capacities must be in the given and limited interval.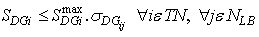 | (10) |
6) Reserve: In a power system in which some unpredictable problems are always possible to occur, the outage of one or more DG units may happen. To partially compensate the outage, beside the installed DG units in each bus, another DG with 2MVA capacity is used as a reserve.7) The time duration of DG operation: The number of hours that each type of DGs can generate energy is limited. Each year, when DG generates energy at specific amount of time, essential repairs are required to generate energy again. Therefore, we try to use the DG at peak hours (due to its low cost of O&M), and its repair time is transferred to lower load levels (low purchasing cost from the power market). When a DG generates the allowable number of hours, this unit will be out of operating model and the other available resources are used to supply energy.8) Maximum penetration of DG: The total capacity that is generated by DGs has a specific constraint and should be less than 35% of the network load.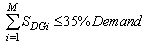 | (11) |
3. Optimization Method
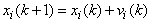
After defining the cost function and problem constraints, the optimization algorithm must be applied to solve the problem. Modified particle swarm optimization (PSO) algorithm has been used to solve the mentioned MINP problem. This algorithm is proved to be efficient in this type of problems. It is more powerful in terms of convergence and speed compared to other optimization approaches. Getting stuck in a local minimum point is a critical problem in optimization algorithms which is eliminated in PSO. In fact convergence is guaranteed using PSO. In this section, the applied optimization procedure (PSO) is described.The PSO algorithm is in 5 steps as follows:Step1: Set  It is assumed that each particle consists of 20 variables. Eight first variables are integer; they indicate the location and installation year of DGs in eight bus-bar. The ninth and tenth variables are binary; these variables indicate the presence or absence of two 10 MVA transformers. Next ten variables are related to the DGs’ capacity and transformers. These variables are chosen randomly.Step 2: When the swarm size is H, initialize a random swarm of H particles as
  Step 3: The fitness of particles is evaluated by the objective function of optimization problem. In fact, for each generation of particles evaluate the objective function for each particle using the cost function of (1). Furthermore, the best previously visited position of particle i is noted as the individual best position
  Global best position is the position of the best individual of whole swarm. The individual best
  and global best
  must be determined in this step.Newton-Raphson (NR) load flow method is also applied on each of the particles to analyze the simulations. In fact, these generated random variables are entering NR and all the existing constraints are applied on them. If the constraints are satisfied, values such as current and voltage of buses, and transferred power are obtained. Next these values are substituted in the objective function (cost function) and a value (the cost that is proportional to that particle) is obtained for each of the particles. In fact, the smallest value among these obtained values is chosen and stored as the best answer of this stage.Step 4: In this stage, each particle velocity
 and the new position would be updated through the following equations.
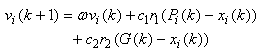 | (12) |
 | (13) |
Where  is the inertia weight,
  and
and  are the random variables in the range of [0 1], and
  and
and  are the constant acceleration coefficients.
  and
and  are also updated velocity and position of each particle.In fact, the new generation of solutions is obtained. These values enter the objective function and again best answer of this stage is stored. A new set of answers for the next iteration is obtained by selecting the minimum value among combination of the best old and new generation. Step 5: In this stage, the number of iterations is checked, if it has reached the maximum number of iterations the algorithm ends and else it goes to stage 3. Indeed, this process is repeated for several iterations and the best solutions are stored in each iteration and at the last iteration execution the problem answer i.e. the random variables corresponding to the minimum cost is obtained.
4. System of Study
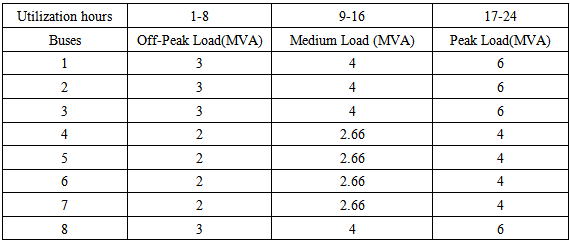
This network has 9 buses as shown in Figure. 1, 8 of which are bus-bar and each of them supply its load according to Table 1. The bus number 9 is the distribution substation by voltage level of 132kv/33kv and capacity of 40MVA; in this bus only the transformers could be installed. It is assumed that the loads of these buses will follow the three-level model with period of the load duration curve (LDC). Each of this model’s levels (Peak, Medium, and Low) has a given growth compared with the previous year. Also in each bus-bar, a 33kv/11kv transformer is available to deliver 11kv voltage to customers. Feeders of this network have maximum capacity of 12MVA; if the power of feeders exceed this value feeders reinforcement (cost of 0.15 M$/km) is needed. The values of choke impedance, ohmic resistance, feeders capacitance, and the length of feeders have previously been reported in [12], [17], [18]. DG units used in this network are turbine type by natural gas fuel. Thus the problem of land shortage for DG placement is resolved.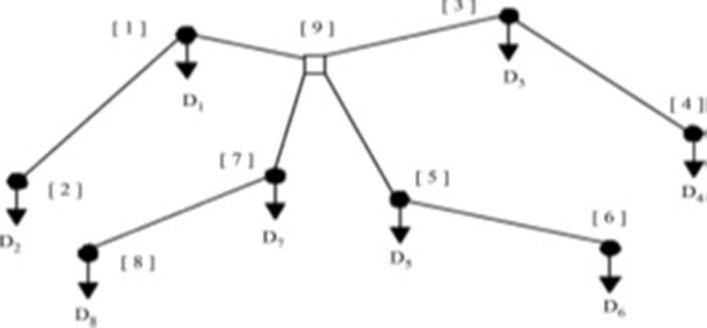 | Figure 1. System of study |
Also it is assumed that there is not any constraint on the fuel amount of DG units and natural gas is readily available. Also distributed generation with 4MVA capacity has 1MVA steps and the cost of each of these units is 0.89 M$/MVA. In addition to DGs that are installed, also there is a DG with 2MVA capacity as a reserve unit; this DG is used in emergency conditions and unpredicted situations. There are two 10MVA transformers to potentially install in the substation. The purchasing cost of each backup DG is 0.2M$. It is assumed that the operation rate is 12.5% and the power factor is 0.9. Moreover, the planning period in this network is considered 4 years. Load data of each level is comprehensively given in Table 1.Table 1. Schedule of utilization hours and load demands
 |
| |
|
5. Simulation Results
Here, the proposed dynamic model has been used to solve a DSP problem on a radial distribution network. This problem has been analysed in two different cases and the results are compared with another work results. Indeed, the superiority of dynamic programming combined with PSO is shown against static programming.
5.1. Case A
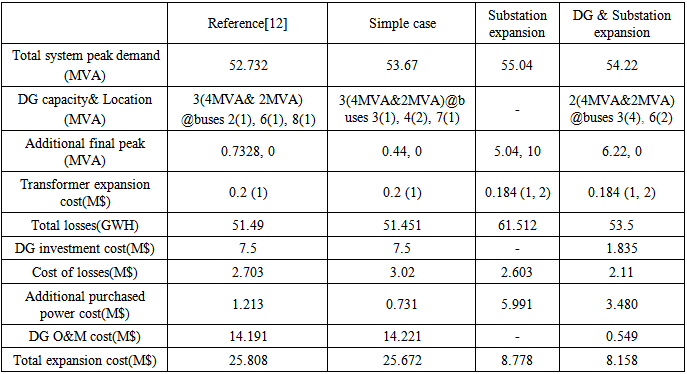
In this case, two options are considered for increased demand compensation. First alternative is the substation expansion alone. Second candidate is considering new DGs installation and substation expansion simultaneously. It is also assumed that there is no thermal constraint on feeders.The proposed dynamic planning combined with PSO is applied in this case and the results of cost value (including O&M costs, investment costs and etc.), location, time (DG installation year), DG capacity, peak load value and potential transformers are shown in Table 2.Table 2. Numerical results; case A
 |
| |
|
For comparison, the results of a static plan (reference [12] solution) with similar conditions in this case are also shown in the second column of Table 2. Using static planning model, two transformers are used in the substation; one works at full capacity and the other at half capacity. Whereas using the dynamic method, a group of DGs are required. This group consists of two DG with 4MVA capacity and a reserve DG with 2MVA capacity. These DGs will be installed at buses 3 and 6 in years 2 and 4. According to the table contents, the obtained results from the proposed approach are very similar to the results reported by El-Khattam et al. [12]. The small differences between the results could be due to the employment of an evolutionary algorithm and inadequate comprehensive data.Comparing the two last columns of the table it is obvious that by considering new DG installation as an option besides substation expansion reduces the total cost by 7% (8.778 to 8.158), and the losses cost by 13%. As shown in Figure. 2, by considering DG and substation expansion together, buses voltages of buses is closer to rated voltage of 33kv compared to the case in which substation expansion is the only alternative. Indeed, considering new DG investment besides substation expansion reduces the amount of voltage drop and losses.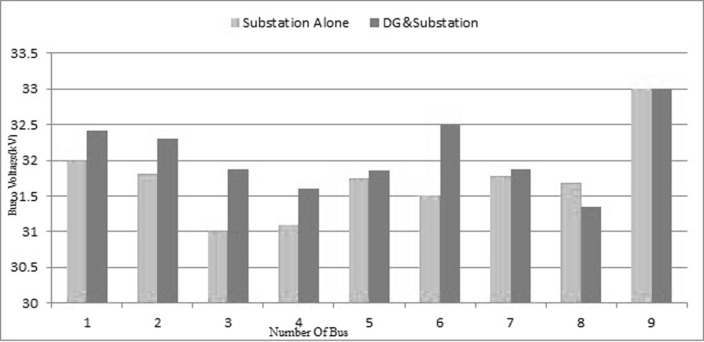 | Figure 2. Feeder voltages, case A |
So in this case, it can be concluded that considering DG and substation expansion simultaneously would be a better alternative compared to substation development alone. The results also shows that dynamic planning performance is better compared to static planning.
5.2. Case B
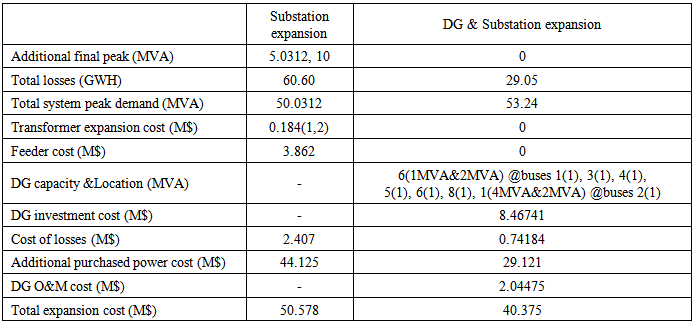
Full model of DDSP is applied in this case, meaning that all the constraints (8 constraints) are considered in the model. As mentioned earlier, network capacity is limited (in accepting new DGs) and installing DGs over capacity limit causes security and stability problems in the network. Also available feeders in the network have a maximum thermal limit of 12MVA. Moreover, the feeder capacitance is negligible in this case just as case A.The results of this test are shown in Table 3. Comparing the columns results it is found that, by considering substation and DG expansion simultaneously, the total development cost is 20% lower than a case in which substation expansion is considered alone. Also, the cost of electricity purchased from the upstream grid and the losses cost is remarkably improved.Table 3. Numerical results, case B
 |
| |
|
6. Conclusions
In this paper a dynamic planning method combined with PSO optimization algorithm is proposed to solve the DSP problem of a distribution network. This model is provided over a whole period. In fact, all years are simultaneously studied such that the condition of each year affects on the planning of the other year. Each year of the planning period is discussed and evaluated and the best time for each equipment installation is determined by comprehensively considering total period.Feeder reinforcement, new substations installation and simultaneous substation and DG expansion are considered as three available options for load growth compensation. Indeed, the final plan could be a combination of these options in a way to impose the least cost to the DISCO.The network costs including new equipment cost, network reinforcement expenses, operation and maintenance, and the losses expenses are modeled in an objective function. PSO algorithm is then applied to minimize this function. It is proved that this optimization algorithm is the best choice for this kind of MINP problem. Actually, using PSO the convergence would be guaranteed in a short computational time. The developed dynamic planning model has not been studied previously. To show the effectiveness of the approach, It has been tested in two different cases. In one case, the effect of two options against demand growth costs is studied. In another case, all the constraints are considered in the model and the system costs are analyzed accordingly. Moreover, the results of this dynamic approach are compared with another static approach on the same network. According to the results, by considering new DG expansion as an option besides substation expansion considerably reduces the overall costs compared with a case in which substation expansion is the only alternative to load growth compensation. Also comparing the results with another work, it can be concluded that dynamic planning is more efficient than static plan so that the overall cost resulted from demand growth is lower by the proposed approach.
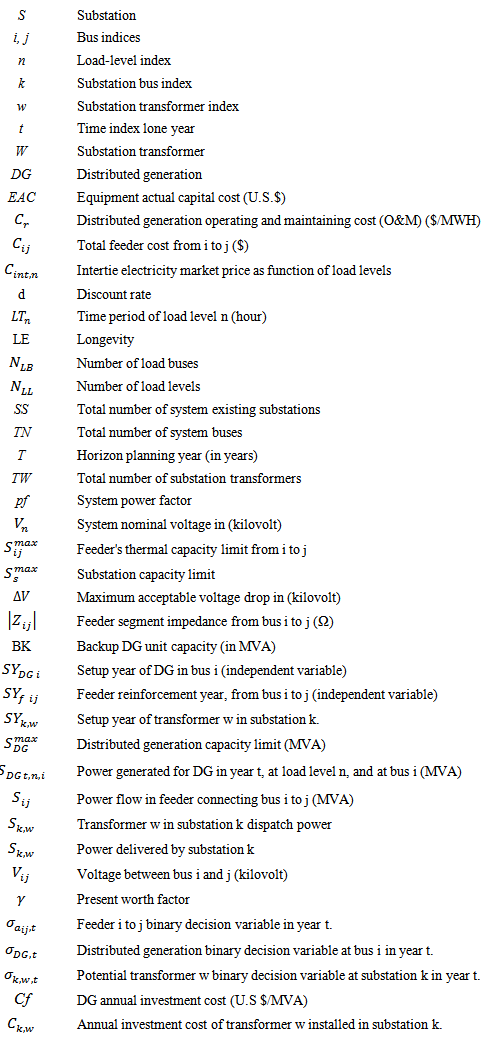
Nomenclature
References
| [1] | R. C. Dugan, T. E. McDermott, and G. J. Ball, “Planning for distributed generation,” IEEE Ind. Appl. Mag., vol. 7, pp. 80–88, Mar.–Apr. 2001. |
| [2] | V. H. Quintana, H. K. Temraz, and K. W. Hipel, “Two-stage power-system-distribution- planning algorithm,” in Proc. Inst. Elect. Eng., Gen., Transm., Distrib., Jan. 1993, vol. 140, pp. 17–29. |
| [3] | G. Pepermans, J. Driesen, D. Haeseldonckx, R. Belmans, and W. D’haeseleer, “Distributed generation: definition, benefits and issues,” Energy Policy, Vol. 33, No. 6, pp. 787-798, April. 2005. |
| [4] | CIGRE, “Impact of increasing contribution of dispersed generation on the power system,”Working group, 37,23,1999. |
| [5] | T. Ackermann , G. Anderson, and L. soder, “Distributed generation :a definition,” Electric Power Syst. Res., Vol. 57, Issue 3, pp. 195-204, April 2001. |
| [6] | G. Celli, E. Ghiani, S. Mocci, and F. Pilo, “A multi-objective evolutionary algorithm for the sizing and sitting of distributed generation,” IEEE Trans. Power System, vol. 20, no. 2, pp. 750–757, May 2008. |
| [7] | H. A. Gil and G. Joos, “Models for quantifying the economic benefits of distributed generation,” IEEE Trans. Power System, vol. 23, no. 2, pp. 327–335, May 2008. |
| [8] | P. Espie, G. W. Ault, G. M. Burt, and J. R. McDonald, “Multiple criteria decision making techniques applied to electricity distribution system planning,” Proc. Inst. Elect. Eng., Gen., Transm. Distrib, vol. 150, no. 5, pp. 327–335, Sep. 2003. |
| [9] | E. Haesen, A. D. Alarcon-Rodriguez, J. Driesen, R. Belmans, and G. Ault, “Opportunities for active DER management in deferral of distribution system reinforcements,” in Proc. Power Syst. Conf. Expo., Washington, D.C., 2009, pp. 1–8. |
| [10] | M. Mardaneh, G. B. Gharehpetian, “Sitting and sizing of DG units using GA and OPF based technique,” in Proc. IEEE Region 10 Conf., vol. 3, pp. 331–334, Nov. 21–24, 2004. |
| [11] | Yongmei Liu, Xiaoli Meng, Zheshen Wang, Wanxing Sheng’’ Distribution Network Planning Considering Distributed Generations Based on Genetic Algorithm’’ IEEE 978-1-4244-9690-7/11/26.00 ©2011. |
| [12] | W. El-Khattam, Y. Hegazy, and M. M. A. Salama, “An integrated distributed generation optimization model for distribution system planning,”IEEE Trans. Power System, vol. 20, no. 2, pp. 1158–1165, May 2005. |
| [13] | S. Haffner, L. F. A. Pereira, L. A. Pereira, and L. S. Barreto, “Multi-stage model for distribution expansion planning with distributed generation- part II: Numerical results,” IEEE Trans. Power Del, vol. 23, no. 2, pp. 924–929, Apr. 2008. |
| [14] | S. Stoft, Power System Economics Designing Markets for Electricity. Piscataway, NJ: EE/Wiley, 2002. |
| [15] | Rastler, D., Economic costs and benefits of distributed energy resources, EPRI. 1011305 (2004). |
| [16] | J. J. Burke, Power Distribution Engineering: Fundamentals and Applications. New York: Taylor & Francis, 1994, vol. 88. |
| [17] | BS 6622, 1991, Cables With Extruded Cross-Linked Polyethilene or Ethylene Propylene Rubber Insulation for Rated Voltages from 3800/6600 V up to 19000/33000 V. |
| [18] | E. G Bungay and D. Meallister, “Electric Cables Handbook”, Second Edition. |
 Abstract
 Reference
 Full-Text PDF
 Full-text HTML