
-
Paper Information
- Paper Submission
-
Journal Information
- About This Journal
- Editorial Board
- Current Issue
- Archive
- Author Guidelines
- Contact Us
Computer Science and Engineering
p-ISSN: 2163-1484 e-ISSN: 2163-1492
2026; 16(2): 49-70
doi:10.5923/j.computer.20261602.02
Received: Oct. 8; Accepted: Oct. 26, 2026; Published: Oct. 31, 2026

An Empirical Evaluation of QLoRA-Fine-Tuned Generative Models for Enterprise-Scale Three-Class Tweet Sentiment Analysis
 Abstract
 Reference
 Full-Text PDF
 Full-text HTML
Md Abdullah Al Mamun1, Md. Shohrab Hossain2
1Masters in Computer Science and Engineering (MCSE), Bangladesh University of Professionals (BUP), Dhaka, 1206, Bangladesh
2Computer Science and Engineering (CSE), Bangladesh University of Engineering and Technology (BUET), Dhaka, 1205, Bangladesh
Correspondence to: Md. Shohrab Hossain, Computer Science and Engineering (CSE), Bangladesh University of Engineering and Technology (BUET), Dhaka, 1205, Bangladesh.
| Email: |  |
Copyright © 2026 The Author(s). Published by Scientific & Academic Publishing.
This work is licensed under the Creative Commons Attribution International License (CC BY).
http://creativecommons.org/licenses/by/4.0/

Sentiment analysis of short, informal social media text is of considerable enterprise value, yet deploying large generative language models for it at scale is constrained by prohibitive computational cost. This study presents a controlled empirical investigation of Quantized Low-Rank Adaptation (QLoRA) for enterprise-scale tweet sentiment analysis, focusing on balancing predictive accuracy against deployment efficiency. Six compact transformer models were fine-tuned under one uniform configuration: 5 decoder-only generative models spanning 5 architecture families, together with a strong encoder-only baseline, DeBERTa-v3-base. The experimental methodology employs 4-bit NormalFloat quantization, an adapter rank of 16, a scaling factor of 32, and the paged 8-bit AdamW optimizer. Sentiment extraction is cast as three-class text-to-text generation and assessed jointly through classification metrics and generation metrics, the latter treated only as secondary generative-fidelity diagnostics rather than measures of classification correctness, alongside efficiency indicators including VRAM, token throughput, latency, and GPU utilization. Holding the configuration constant isolates architecture. Every compact generative model surpassed the discriminative baseline (82.5%), while all models were trained and deployed on a single A100-SXM4-40GB GPU using under 4 GB of allocated memory. Among the evaluated models, Phi-4-mini-instruct achieved the highest agreement with the teacher-generated silver labels, with 92.6% accuracy and a weighted F1-score of 92.38%. These values represent agreement with the automatically generated reference labels rather than independently validated human sentiment accuracy. These findings suggest that QLoRA fine-tuning may render accurate, scalable sentiment analysis feasible on commodity infrastructure.
Keywords: Generative AI, Transformer Model Fine-tuning, Sentiment Analysis, Quantized Low-Rank Adaptation (QLoRA)
Cite this paper: Md Abdullah Al Mamun, Md. Shohrab Hossain, An Empirical Evaluation of QLoRA-Fine-Tuned Generative Models for Enterprise-Scale Three-Class Tweet Sentiment Analysis, Computer Science and Engineering, Vol. 16 No. 2, 2026, pp. 49-70. doi: 10.5923/j.computer.20261602.02.
Article Outline
1. Introduction
- Sentiment analysis, the computational study of opinions, emotions, and attitudes expressed in text, is an indispensable instrument for data-driven decision-making across the modern enterprise [7]. Organizations may increasingly rely upon the automated interpretation of unstructured, usergenerated text to facilitate decision-making [7]. Microblogging platforms, such as Twitter, generate vast and continuous streams of short, opinion-rich text that may offer a real-time barometer of public sentiment [22]. The transformation of this informal language into reliable, structured insight at scale therefore presents a challenge of substantial commercial importance, which may place stringent demands upon both the accuracy and the operational efficiency of the underlying models [7].The methodological foundations of sentiment analysis have advanced rapidly, progressing from early lexicon based and classical machine learning approaches, through transformer encoders such as BERT and RoBERTa, to the generative Large Language Models (LLMs) that now define the state of the art. The present investigation addresses this identified deficiency through a controlled empirical study of Quantized Low-Rank Adaptation (QLoRA) fine tuning for enterprise-scale sentiment analysis. Six compact transformer models are fine-tuned under a single, uniform Parameter-Efficient Fine-Tuning (PEFT) configuration and evaluated on a three-class (negative, neutral, positive) tweet sentiment task: five decoder only(one-to-four-billion-parameter) generative models spanning five distinct architecture families—GPT-Neo-1.3B [5], Gemma-3-1B-it [10], Llama-3.2-3B [11], Phi-4-mini-instruct [23], and Qwen3-1.7B [33]—together with DeBERTa-v3-base [14], a strong encoder-only discriminative baseline that represents the industrystandard classification paradigm. The extraction of sentiment for the generative models is characterized as a text-to-text generation task, and model quality is assessed jointly through classification metrics (accuracy, precision, recall, and weighted F1) and generation metrics (Bilingual Evaluation Understudy (BLEU) and Recall-Oriented Understudy for Gisting Evaluation (ROUGE)), alongside a detailed profile of enterprise-relevant efficiency indicators including Video Random Access Memory (VRAM) consumption, token throughput, inference latency, and Graphics Processing Unit (GPU) utilization. These directly addressing the deployment omission that has characterized prior literature and providing practitioners with concrete guidance on accuracy–cost trade-offs.The objective of this work is to establish whether com-pact, one-to-four-billion-parameter generative transformers, adapted under a QLoRA regime, can deliver enterprise-grade sentiment classification at a computational cost that single-GPU commodity infrastructure can absorb. To this end, a single uniform configuration is held constant across all six models so that architecture and learning paradigm remain the only variables of interest, and predictive quality is reported jointly with the deployment indicators—VRAM, token throughput, inference latency, and GPU utilization—that prior sentiment studies have largely omitted [32]. A second objective is to determine whether the generative framing is warranted at all for a three-class short-text task, by benchmarking it directly against a tuned discriminative encoder on identical data under an identical protocol [14].This paper makes five contributions. It provides a con-trolled six-model comparison—five decoder-only generative architectures and one encoder-only baseline—under one uniform QLoRA configuration (4-bit NF4 quantization, rank r= 16, scaling factor 𝛼 = 32, dropout of 0.05, the paged 8-bit AdamW optimizer, a learning rate of 2×10⁻⁴, and a single training epoch) [9], and it casts sentiment extraction as text-to-text generation assessed jointly through classification and generation metrics, the latter demoted explicitly to generative fidelity diagnostics rather than measures of classification correctness [26]. It further contributes an enterprise-scale efficiency profile spanning VRAM, token throughput, inference latency, and GPU utilization; a direct benchmark of the generative formulation against a tuned DeBERTa-v3-base encoder; and an explicit compact models, with every finding interpreted in light of the dataset’s silver-standard annotation provenance and the risk of pre-training data exposure.The experimental results validate that the five generative models achieved 88.1%–92.6% accuracy against the teacher-generated silver-standard labels, compared with 82.5% for the DeBERTa-v3-base baseline. Phi-4-mini-instruct obtained the highest observed agreement, with 92.6% accuracy and a weighted F1-score of 92.38%. These findings indicate differences in the models’ ability to reproduce the silver-standard labels under the evaluated configuration. However, because the reference labels were generated automatically rather than independently annotated by humans, the results do not establish equivalent levels of human-validated sentiment accuracy. This distinction is important when interpreting the practical significance of the reported performance differences.The remainder of this paper is structured as follows: Section 2 provides a review of the related literature on parameter-efficient fine-tuning, quantization, discriminative versus generative classification, and large language model (LLM)-based sentiment analysis, thereby establishing the research gap that may motivate the study. Section 3 delineates the implementation of the proposed architecture—including the dataset, preprocessing, model configuration, and Quantization with Low-Rank Adaptation (QLoRA) fine-tuning pipeline—and discusses the methodologies for mitigating label noise and potential data contamination. Section 4 presents the experimental results across classification, generation, and system-level efficiency metrics for all six models, which may elucidate their relative performance. Section 5 provides a comparative analysis, which situates the findings against the existing literature and suggests potential avenues for improvement. Finally, Section 6 concludes the paper and outlines directions for future work.
2. Literature Review
- This section provides a survey of the body of research upon which the present study builds, with the aim of situating a controlled, uniform-configuration comparison of six compact transformer models—five generative and one discriminative—within the wider landscape of parameter-efficient fine-tuning and large language model (LLM) sentiment analysis. The review proceeds from the foundational adaptation and quantization methods, through the discriminative encoder paradigm and the application of LLMs to sentiment analysis, to the specific—and notably sparse—literature on QLoRA fine-tuning for sentiment, and finally, to the short-text, data-contamination studies most relevant to enterprise-scale deployment. Accordingly, this review focuses on five interlocking themes:• PEFT and quantization foundations;• The discriminative encoder paradigm for sentiment classification;• The capabilities of LLMs for sentiment analysis;• The specific application of QLoRA and LoRA to sentiment tasks;• The short-text, data-contamination, and evaluation considerations that govern accurate and efficient deployment.
2.1. Parameter-Efficient Fine-Tuning Foundations
- Low-Rank Adaptation (LoRA), introduced by [15], freezes the pretrained weights of a model and injects trainable low rank decomposition matrices into each transformer layer. The implementation of this technique appears to reduce the number of trainable parameters by up to four orders of magnitude and Graphics Processing Unit (GPU) memory by a factor of approximately three relative to full fine tuning of the 175-billion-parameter Generative Pre-trained Transformer 3 (GPT-3) with Adaptive Moment Estimation (Adam), while matching or exceeding full fine-tuning quality on RoBERTa, DeBERTa, GPT-2, and GPT-3. QLoRA [9] extends LoRA with three innovations that are foundational to the present work: 4-bit NormalFloat (NF4) quantization, a data type that appears information theoretically optimal for normally distributed weights; double quantization, which further compresses the quantization constants themselves.
2.2. LLM-Based Sentiment Analysis
- The capabilities of Large Language Models (LLMs) for sentiment analysis have been assessed most authoritatively by [34], whose reality check evaluates 13 tasks across 26 datasets and introduces the Senti-Eval benchmark. They conclude that LLMs perform satisfactorily on simpler tasks but lag behind fine-tuned small language models on more complex tasks, while significantly outperforming them in few-shot settings [34].The accumulation of complementary studies appears to reinforce the practical viability of the Quantized Low-Rank Adaptation (QLoRA) framework. [2], in a series of studies employing a unified 4-bit NF4 QLoRA pipeline, suggest that LLaMA-3 may be the strongest model, reaching 91.2% accuracy and 0.908 F1 on IMDB, 85.6% accuracy and 0.849 F1 on Twitter, all models struggle more with Twitter data owing to its informal and context-poor nature [2]. These constitute the most directly comparable Twitter QLoRA results available; the present study’s headline figure for Phi-4-mini-instruct (92.6% accuracy on a three-class task) is competitive with, and in several same-task comparisons exceeds, them, albeit on a differently annotated dataset.
2.3. Critical Analysis
- A critical appraisal of the surveyed corpus may yield a delineation of both consolidated strengths and persistent limitations. Regarding the identified strengths, the efficiency claims of QLoRA appear robustly and independently replicated—including by [24], who examine the tradeoff between efficiency and memory savings. The PEFT taxonomy itself appears mature and established, as documented by [12].Several weaknesses, inconsistencies, and limitations nonetheless characterize the existing literature, each of which the present study is designed to address.• A pronounced domain skew appears to persist: finance and movie reviews seem to dominate, while clean three-class Twitter sentiment remains comparatively rare.• A model-size skew is evident, in that almost all Quantized Low-Rank Adaptation (QLoRA)-for-sentiment studies employ 7 to 70 billion-parameter backbones, resulting in the limited evaluation of compact 1 to 4 billion-parameter models for this task.• A paradigm blind spot pervades: generative models seldom undergo benchmarking against a tuned dis-criminative encoder on the same data and configuration, which may suggest that the resolution of the practical utility of the generative framing remains pending.• Marked metric inconsistency is observed: some studies report accuracy alone and others F1, while generation metrics such as Bilingual Evaluation Understudy (BLEU) and Recall-Oriented Understudy for Gisting Evaluation (ROUGE) are seldom subjected to application within sentiment analysis, and their classificatory validity is contested.• Validity threats specific to modern web-trained models—label noise from automated annotation and data contamination from pre-training exposure—seldom receive acknowledgment, let alone mitigation.• An efficiency blind spot is pervasive, with Video Random Access Memory (VRAM), latency, through-put, and Graphics Processing Unit (GPU) utilization undergoing profiling in a limited number of sentiment studies—the FinLoRA benchmark [32] being a rare exception, and itself finance-specific, large-model, and a preprint.
2.4. Research Gap
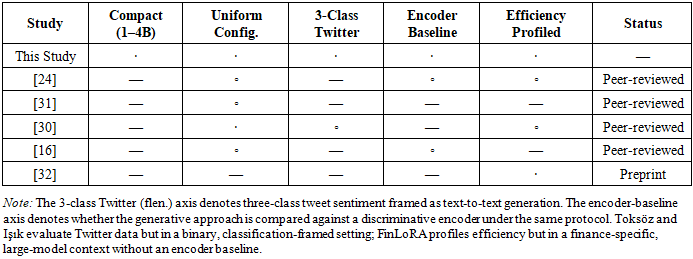
- A synthesis of the foregoing appraisal suggests no peer-reviewed study that simultaneously addresses the five axes central to the present work:• Compact open-source models in the one-to-four-billion-parameter range;• A single uniform parameter-efficient configuration ap-plied across all models;• Three-class short-text or Twitter sentiment framed as a text-to-text generation problem;• A controlled comparison of the generative paradigm against a strong discriminative encoder baseline;• An explicit profile of enterprise-scale deployment efficiency.The nearest multi-model, multi-method benchmark, Fin-LoRA [32], appears domain-specific to finance, utilizes larger models, and omits a discriminative baseline, while remaining in preprint status. Conversely, the nearest hyperparameter study, [24], employs a solitary large-scale model on five-class long-form reviews through a classification head. The specific combination of compact models, three-class Twitter sentiment, a generation-framed formulation, a discriminative encoder baseline, and an efficiency profile under one uniform configuration may therefore be considered absent from the existing literature. The systematic mapping in Table 1 renders this omission explicit by evaluating the most relevant prior studies against these five axes, suggesting that each encompasses at most two or three, and none addresses the full set.
2.5. Novelty
- To address the gap identified above, the proposed study appears to offer five distinct analytical contributions to the extant body of knowledge.• First, it provides a controlled six-model comparison spanning five generative architectures across four families and one discriminative encoder, all under one uniform configuration—comprising, for the QLoRA-adapted generative models, 4-bit NF4 quantization, rank r = 16 and scaling factor 𝛼 = 32, dropout of 0.05, the paged 8-bit AdamW optimizer, a learning rate of 2×10, and a single training epoch—thereby isolating model architecture and learning paradigm as the variables of interest.• Second, it adopts a sentiment-as-generation framing evaluated jointly through classification metrics (accuracy, precision, recall, and weighted F1) and generation metrics (BLEU and ROUGE), the latter explicitly demoted to generative-fidelity diagnostics.• Third, it incorporates enterprise-scale efficiency profiling—covering VRAM, token throughput, inference latency, and GPU utilization—alongside predictive quality.• Fourth, it directly benchmarks the generative formulation against a tuned DeBERTa-v3-base encoder, determining, based on the present data, whether the generative paradigm is warranted.• Fifth, the study provides a comparative evaluation of compact generative transformer models under a common QLoRA configuration, examining the trade-off between predictive performance and computational efficiency.
3. Proposed Methodology
- Taken as a whole, the reviewed literature traces a coherent intellectual arc that motivates and frames the present study. The foundations of parameter efficient fine-tuning and quantization suggest that compact, single-GPU adaptation of large models may be both feasible and near-lossless, while the quantization literature quantifies the accuracy efficiency trade-off and highlights the heightened sensitivity of smaller models to aggressive quantization. The discriminative encoder paradigm supplies the canonical classification base-line, and studies of LLM sentiment capability justify the selection of task-specific fine-tuning over zero-shot prompting for a three-class problem while cautioning that discriminative models remain competitive. The targeted but sparse QLoRA for sentiment literature ([24]; [31]; [30]; [16]; [32]) demonstrates QLoRA’s practicality while leaving the compact model, three-class Twitter, generation framed, and encoder benchmarked setting unexplored. Short text benchmarks, data-contamination analyses [3], and evaluation metric foundations together provide the methodological scaffolding for rigorous experimentation. These disparate threads converge upon an underexplored nexus within the design space, which the present methodology is engineered to characterize systematically through a compact-model, uniform-configuration, and generation-framed analysis.To this end, this section delineates the complete end-to-end pipeline developed to fine-tune transformer models for tweet-level sentiment analysis. Adopting a unified text-to-text formulation in the spirit of the transfer learning paradigm of [25], the system conceptualizes sentiment ex-traction for generative models as a conditional generation task, thereby enabling heterogeneous decoder-only architectures to be trained and evaluated within a single, consistent framework. The pipeline is organized into sequential stages spanning data loading, stratified splitting, tokenization, prompt-based preprocessing, parameter-efficient fine-tuning, evaluation, real-time monitoring, and deployment, jointly optimizing the models for both classification accuracy and operational scalability—a process that may enhance model utility in realistic enterprise settings.The overall architecture is illustrated in Figure 1, the workflow commences with the loading of the tweet-sentiment corpus and its subsequent partitioning into training, test, and validation subsets. The tokenization of each tweet into sub-word units and its preprocessing into a sentiment-aligned prompt then expose the input_ids and attention_mask tensors required by the models. Six transformer-based models are sourced from the Hugging Face Hub for fine-tuning, after which the adapted models proceed through an evaluation stage of iterative performance analysis. Training dynamics and evaluation metrics are tracked continuously through the Weights Biases (WandB) platform, and the resulting models are deployed to the Hugging Face Hub before final testing. All six models are fine-tuned using the Hugging Face Trainer API with mixed-precision optimization, and the operational robustness of each model is validated through comprehensive evaluation metrics and real-time tracking.
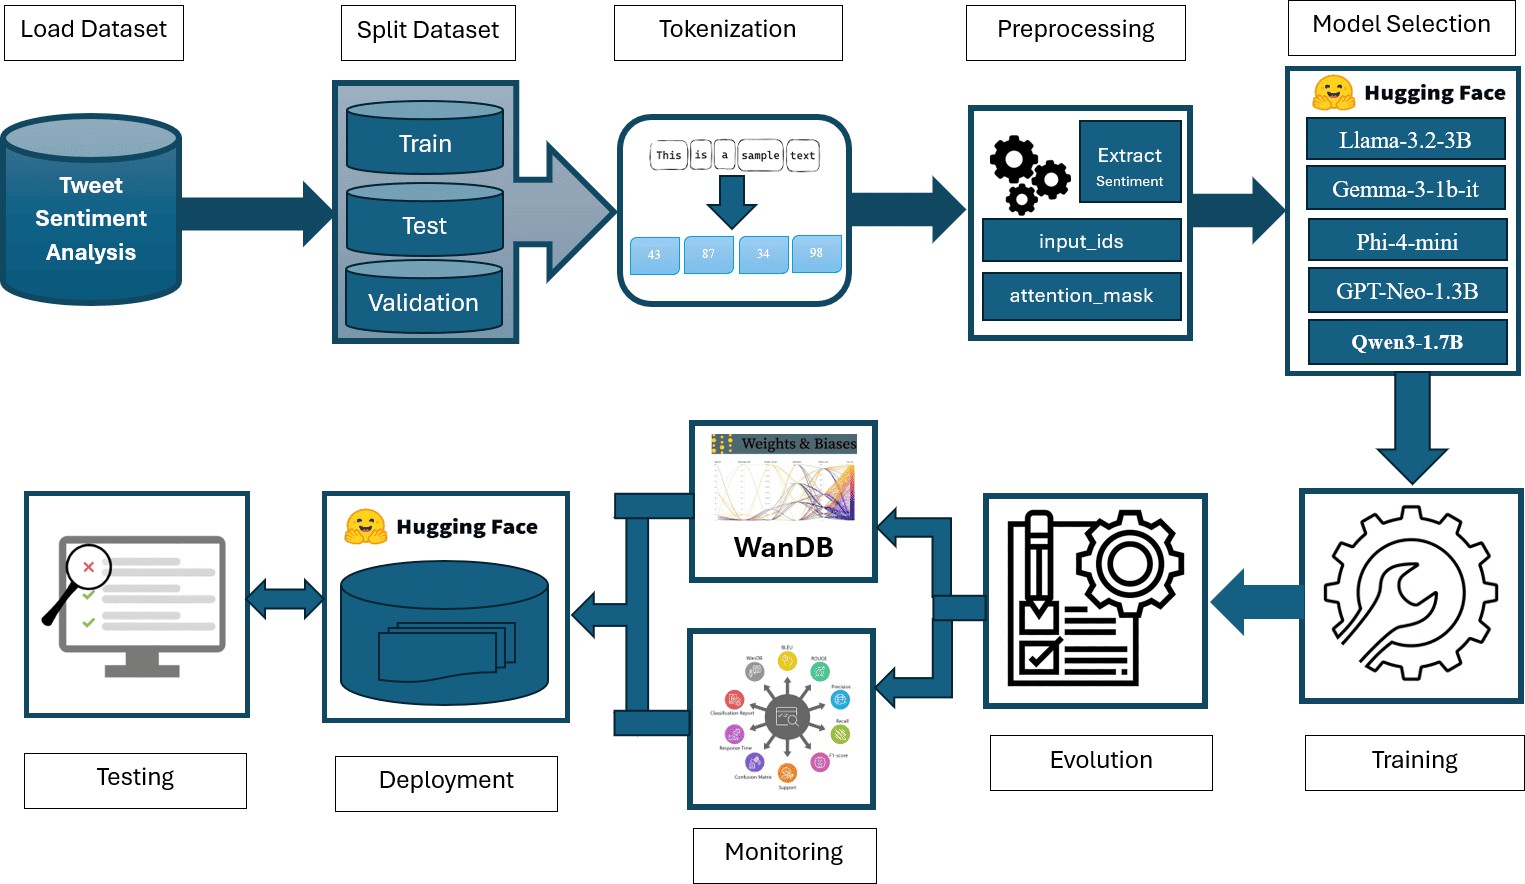 | Figure 1. End-to-end architecture for fine-tuning generative and discriminative transformer models for sentiment analysis using tweet data |
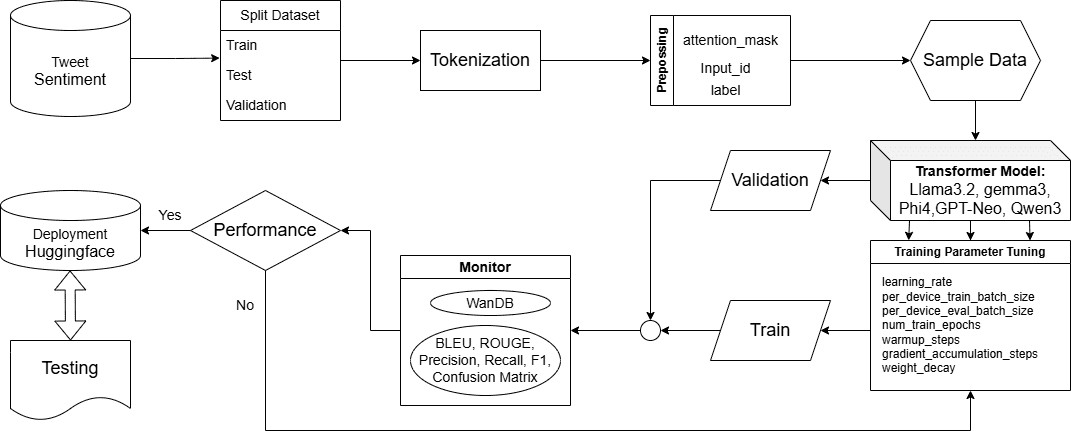 | Figure 2. Experimental framework used to fine-tune and evaluate the six transformer models (five generative and one discriminative |
3.1. Library
- The implementation appears to rely upon a suite of established open-source Python libraries which, when integrated, facilitate model access, data management, metric computation, experiment tracking, and visualization. These principal libraries are summarized in the subsequent enumeration.• Transformers (version 4.51.3) provides a unified interface for the implementation of pretrained transformer models and the utilization of the Trainer Application Programming Interface (API) for the orchestration of fine-tuning protocols.• Datasets enable the loading, preprocessing, and efficient management of the benchmark sentiment corpus sourced from the Hugging Face Hub.• Evaluate computes and log standard natural language processing and machine learning evaluation metrics.• The wandb framework supports real-time experiment tracking, logging, and the detailed visualization of performance metrics [4].• Matplotlib serves to generate visualizations of training loss and evaluation metrics, which may assist in diagnostic analysis.• Seaborn generates statistical graphics, such as confusion matrices and cross-model comparisons.• rouge_score quantifies generated-text quality through the implementation of ROUGE-N, ROUGE-L, and ROUGE-W metrics [20].
3.2. Transformer Models
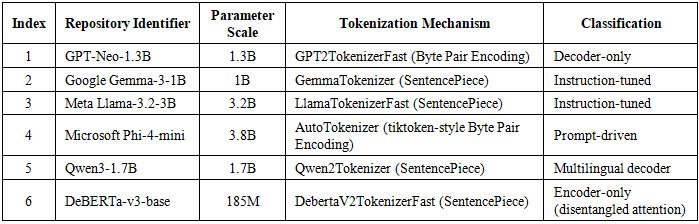
- We selected six transformer-based language models to democratize access to fine-tuned GenAI for sentiment analysis; this selection process provides a framework for contrasting the generative and discriminative paradigms. Five are compact decoder-only generative models that span a range of parameter scales approximately one to four billion as well as tokenizer families and pretraining objectives; the sixth, DeBERTa-v3-base, functions as an encoder-only discriminative model [13], which often serves as an industry-standard classification baseline.The observed capacity to fine-tune all six architectures within a single pipeline suggests that both compact decoder only models and a lightweight encoder may attain strong performance on the sentiment analysis task. The architectural characteristics of each model comprising its Hugging Face identifier, parameter scale, tokenizer family, and preprocessing paradigm—are delineated in Table 2.
|
3.3. Load Dataset
- To evaluate the fine-tuned models for sentiment classification, the bdstar/Tweets-Sentiment-Analysis dataset from the Hugging Face Datasets repository was employed. This benchmark is designed for three-class tweet sentiment classification formulated and appears to align with enterprise-level text-analysis requirements. Accessed through the Hugging Face Datasets library [17], which provides seamless preprocessing, reproducibility, and consistency.Each sample contains a text field holding the original tweet together with the corresponding probabilities of the negative, neutral, and positive classes; the final label, consequently, reflects the sentiment polarity as determined by the maximal class probability. A delineation of each subset’s function is provided hereinafter:• Training set (10,000 samples): This subset provides sufficient coverage to facilitate the fine tuning of transformer models and the acquisition of sentiment-bearing representations.• Test set (10,000 samples): Remaining entirely unseen during training, this partition serves as the primary benchmark for the reporting of final performance via metrics including accuracy, F1-score, BLEU, and ROUGE.• Validation set (1,000 samples): For monitor model performance during training and assess generalization on held-out data. Validation loss, evaluation metrics were recorded to analyze model behavior and convergence, while the predefined training configuration was kept fixed across the experiments.The implementation of this structured, stratified split is a common strategy in empirical natural language processing (NLP) experimentation to promote generalization and simulate realistic deployment scenarios.
3.3.1. Label Provenance, Annotation Noise, and Inter-Annotator Agreement
- The sentiment labels used in this study were generated by the `cardiffnlp/twitter-roberta-base-sentiment-latest` model rather than obtained through independent human annotation. Accordingly, the labels are treated as silver-standard references, and the reported classification metrics quantify agreement between the evaluated models and the teacher-generated labels. These results should not be interpreted as direct estimates of human-validated sentiment accuracy, because the teacher model may introduce systematic errors that are inherited by the generated labels. This limitation is particularly relevant to the neutral sentiment class, where genuine ambiguity may contribute to annotation disagreement. Independent evaluation against human-annotated reference labels is required to establish how well the observed results correspond to human sentiment judgments.
3.4. Tokenizer
- The process of tokenization involves the conversion of raw text into sub-word units, facilitating the processing of diverse linguistic structures by transformer models. Each model employs the tokenizer aligned with its native architecture (see Table 2), ensuring compatibility and faithful input–output mapping. For decoder-only models, the assignment of pad_token_id as the eos_token_id may prevent run-time inconsistencies during fine-tuning. Correct tokenizer configuration appears to underpin robust preprocessing and smooth integration into enterprise scale sentiment pipelines.
3.5. Preprocessing
- Preprocessing facilitates the reformulation of each tweet into a unified prompt template, which may direct the generative models toward the sentiment-extraction objective. Such prompt-based encoding appears to improve task generalization in these systems. Specifically, each sample is systematically cast into the subsequent template:“Extract sentiment text from tweet: tweet_text Sentiment: label”Each model’s tokenizer facilitates the conversion of the prompt into token identifiers; meanwhile, padding, truncation, and attention masks may ensure computational compatibility during both training and inference. For every generative sample, preprocessing typically produces the following tensors.• input_ids: the encoded token identifiers of the input prompt, representing the tweet and its associated sentiment in a form the model can process.• attention_mask: a binary mask indicating which to-kens should be attended to during the forward pass (1 for content tokens, 0 for padding).• labels: the encoded token identifiers of the expected output—the text span expressing the sentiment.
3.5.1. Generated Output Decoding and Sentiment-Label Mapping
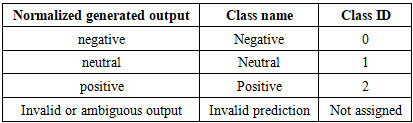
- For the generative transformer models, sentiment classification is formulated as a text-to-text prediction task in which the expected output is exactly one of three canonical class labels: negative, neutral, or positive. Following inference, the generated token sequence is decoded into text, with special tokens excluded where supported by the tokenizer. The decoded output is then subjected to a deterministic normalization and label-mapping procedure. Leading and trailing whitespace and surrounding punctuation are removed, and the remaining text is converted to lowercase. The normalized output is mapped to the corresponding class only when it matches one of the three permitted labels. The class-to-index mapping is defined consistently with the dataset labels and evaluation implementation.
|
3.6. Training
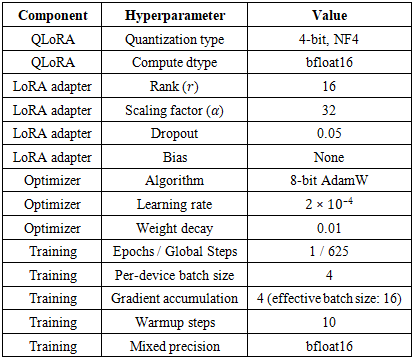
- The researchers orchestrated fine-tuning using the TrainingArguments class, a component of the Hugging Face Transformers library. To adapt the large pretrained back-bones efficiently, the study adopted QLoRA, which backpropagates gradients through a frozen, 4-bit quantized model into trainable low-rank adapters [9]; The key training fixed hyperparameters are summarized below,• Parameter-efficient fine-tuning (PEFT): The implementation utilized QLoRA with 4-bit NormalFloat (NF4) quantization, double quantization, and adapters of rank r = 16, a scaling factor = 32, and a dropout of 0.05.• Learning rate: The value was set to 2 × 10, a configuration that appears to facilitate stable yet rapid convergence.• Epochs: The training duration was fixed at 1, an allocation that may provide sufficient adaptation while mitigating the risk of overfitting.• Batch size: The capacity was set to 4 per device (with gradient accumulation of 4 steps, yielding an effective batch size of 16) to balance training.• Weight decay: The parameter was applied at a value of 0.01, which may penalize large weight magnitudes and curb the potential for overfitting.• Optimizer: The selected mechanism was the paged 8-bit AdamW optimizer.• Mixed-precision training: Enabled bfloat16, potentially reducing memory consumption and accelerating training without degradation in accuracy.Because hyperparameter selection exerts a substantial influence on convergence speed and generalization in transformer-based models, these settings were treated as tunable quantities within the experimental loop of Table 2 rather than fixed constants; such an approach suggests that hyperparameter optimization may be necessary for robust model convergence. Training was driven by the Trainer API, which abstracts gradient updates, logging, and checkpointing.
3.7. Evaluation
- Evaluation mirrored the training configuration but operated in inference mode by enabling do_eval=True. Evaluating at regular intervals (eval_steps=100) provided fine-grained monitoring of model behavior throughout the training epoch. The Trainer.evaluate() method computed the validation loss and the predefined metrics, which were logged and visualized automatically through the Weights & Biases platform. For the generative models, evaluation was performed on the canonical sentiment labels obtained through the predefined output-decoding and label-mapping procedure described in Subsection 3.5.1. Each valid generated label was compared with the corresponding teacher-generated reference label using the same class definitions. Invalid or ambiguous outputs were handled according to the documented evaluation policy. This procedure ensures that classification metrics are calculated from discrete sentiment predictions rather than directly from BLEU or ROUGE scores.Following the initial fine-tuning phase, the pipeline enters an evolution stage dedicated to the systematic analysis and refinement of model performance; this stage entails the activities delineated below.• Performance metric review: F1-score, precision, recall, and confusion matrices facilitate the identification of specific sentiment classes (positive, neutral, negative) that a model may struggle to classify.• Training and Performance Monitoring: Training loss, validation metrics, and confusion matrices were analyzed to assess model convergence, evaluate predictive performance, and identify class-specific classification errors.
3.8. Monitoring
- Monitoring spans experiment tracking, real-time metric visualization, model evaluation, and system performance analysis, all of which are essential to ensure reproducible and transparent experimentation.
3.8.1. Weights & Biases (WandB)
- Weights & Biases (WandB) was used to track experiments, visualize metrics, and maintain version control for models and datasets, offering real-time logging of training runs, hyperparameters, and artifacts. By making every aspect of training observable in real time, WandB imposes structure and visibility on the otherwise opaque process of large-scale experimentation [4]. The monitored quantities include the following.• Accuracy: the proportion of correct predictions relative to the total, the tracking of which may elucidate learning progress across sequential iterations.• Loss: the cross-entropy objective directing learning, the trajectory of which may suggest the degree of model convergence.• Evaluation: the comparative assessment of predictions against ground truth, which may utilize metrics such as precision, recall, F1-score, BLEU, and ROUGE.• Training: the systematic observation of steps per epoch, learning rate behavior, optimizer updates, and gradient norms, which may facilitate the monitoring of optimization progress.• System: the comprehensive tracking of computational resources, including central processing unit (CPU) and graphics processing unit (GPU) utilization, memory usage, disk operations, and network throughput, which may support efficient resource management.
3.8.2. BLEU Score
- The Bilingual Evaluation Understudy (BLEU) score facilitates a comparison between generated sentiment spans and reference annotations. Higher BLEU values may denote stronger n-gram overlap, which appears to reflect lexical precision. As discussed in Subsection 5.2, BLEU is treated here strictly as a generative-fidelity diagnostic rather than a measure of classification correctness; it remains one of the most widely adopted automatic metrics for comparing machine-generated text with human references [26].
3.8.3. ROUGE Score
- The ROUGE (Recall-Oriented Understudy for Gisting Evaluation) score estimates the overlap of words and phrases between model outputs and reference spans. Higher ROUGE values may indicate stronger recall of sentiment-expressive text. ROUGE-L, which relies on the calculation of the longest common subsequence, appears particularly recall-oriented and well-suited to the evaluation of generative outputs [20]; as with BLEU, its inclusion here serves merely as a supporting diagnostic.
3.9. Performance Matrix
- The confusion matrix constitutes a performance-evaluation instrument that facilitates the visualization of model prediction accuracy and assists in the interpretation of classification error taxonomy, a process which is especially valuable for multi-class sentiment tasks [27]. Within multi-class environments, such as sentiment analysis (positive, neutral, negative), the matrix consists of a square array wherein rows denote the actual classes and columns characterize the predicted classes.A high degree of precision suggests a low false-positive rate, a factor that may prove critical when misclassification carries substantial costs—for instance, the erroneous labeling of a negative review as positive. For each class c {positive, neutral, negative}, the calculation of precision proceeds as follows:
 | (1) |
 | (2) |
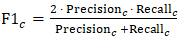 | (3) |
3.9.1. Response Time
- Inference latency and throughput were measured using a predefined evaluation procedure. Average inference latency was calculated as the mean elapsed time per request, and throughput was calculated from the number of processed examples over the measured duration. The average response time (ART) over N requests is defined as follows:
 | (4) |
 = start time of the 𝑖𝑡ℎ request•
 = completion time of the 𝑖𝑡ℎ request
3.10. Deployment (Hugging Face)
- Following training and evaluation, the fine-tuned models were deployed to the Hugging Face Hub to enable public access, reproducibility, and enterprise-ready API integration. The Hub functions as a centralized infrastructure for hosting transformer-based models, facilitating cloud-based inference, model sharing, and integration into production pipelines via Representational State Transfer (REST) interfaces and software development kits.
4. Experimental Result
- The present section delineates the empirical outcomes obtained from fine-tuning six transformer models—GPT-Neo-1.3B, Google Gemma-3-1B, Meta Llama-3.2-3B, Microsoft Phi-4-mini-instruct, Qwen3-1.7B, and the discriminative DeBERTa-v3-base baseline—for tweet-level sentiment analysis under a unified parameter efficient training protocol. Model performance was assessed using a complementary battery of established natural language processing metrics, comprising training and evaluation loss, BLEU and ROUGE scores, per-class and aggregate precision, recall, and F1-score, confusion matrix analysis, and average response time, together with system-level indicators of GPU memory, disk utilization, process memory, token throughput, and VRAM allocation. All quantities were logged in real time through the Weights & Biases (WandB) platform during training, evaluation, and inference.
4.1. Training
- The six models underwent fine-tuning under a single deliberately uniform hyperparameter schedule; The adaptation protocol employed 4-bit NormalFloat (NF4) quantization with double quantization and a bfloat16-compute data type, in accordance with the QLoRA recipe of [8]; concurrently, the utilization of low-rank adapters necessitated a decomposition rank of r = 16, a scaling factor of 𝛼 = 32, and a LoRA dropout of 0.05. Optimization used the paged 8-bit AdamW optimizer with a learning rate of 2 × 10⁻⁴; a per-device batch size of 4; gradient accumulation of 4 steps (effective batch size 16); gradient checkpointing; a weight decay of 0.01; and a single training epoch corresponding to 625 global steps. The training loss was logged every 100 steps to monitor convergence stability. The shared configuration is summarized in Table 3.
|
4.1.1. Training Duration
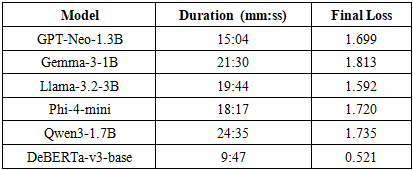
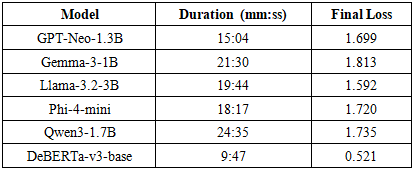
- Table 4 delineates the wall-clock training duration and the final training loss for each model. Among the generative models, the proportion of trainable parameters remained below 1.1%, with attention-mechanism-specific adapter placement for Generative Pre-trained Transformer (GPT)-Neo, Gemma, and Large Language Model Meta AI (Llama), and comprehensive linear-layer parameter integration for Phi-4-mini and Qwen3; the Decoding enhanced BERT with disentangled attention (DeBERTa)-v3-base baseline, being an encoder fine-tuned with a classification head, arguably exhibited the most rapid convergence.
|
4.1.2. Training Loss
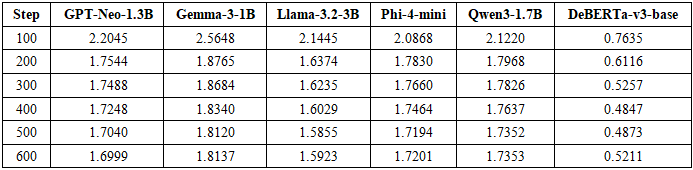
- To facilitate the characterization of convergence behavior, the training loss was recorded at 100-step intervals throughout the single training epoch. Table 5 lists the logged loss values across the six checkpoints, and Figure 3 visualizes the corresponding trajectories for all six models.
|
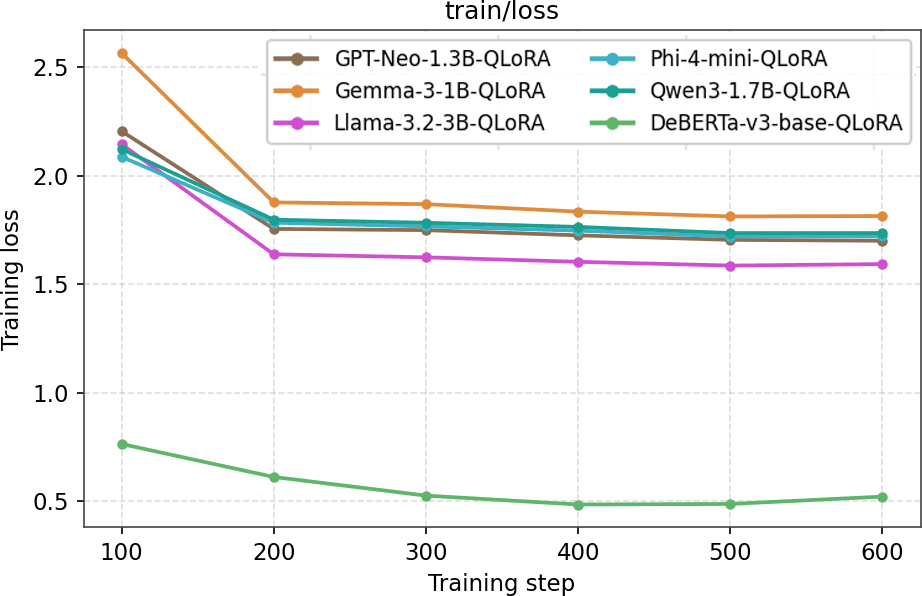 | Figure 3. Training loss versus optimization steps for the six fine-tuned models |
4.2. Evaluation
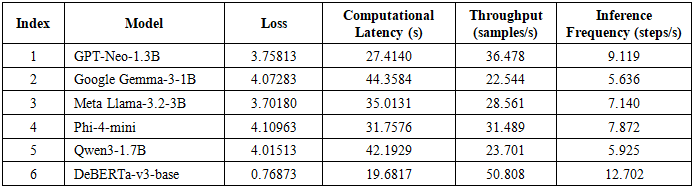
- Following training, each architecture underwent evaluation in inference mode on the held-out validation partition, with assessment occurring at regular intervals (every 100 steps) to facilitate fine-grained monitoring. Table 6 summarizes the evaluation-stage metrics, reporting validation loss alongside key throughput indicators: runtime, samples processed per second, and optimization steps per second.
|
4.2.1. Evaluation Steps per Second
- Figure 4 presents a comparative analysis of the optimization steps processed per second during the evaluation phase. DeBERTa-v3-base led all models at 12.702 steps per second, followed by the generative GPT-Neo-1.3B at 9.119. Among the remaining generative models, Microsoft Phi-4-mini followed at 7.872 steps per second, while Gemma-3-1B was the least efficient at 5.636 steps per second. The observed ranking suggests that parameter count, learning paradigm, and tokenizer efficiency—rather than nominal model size alone—may jointly determine evaluation-time step throughput.
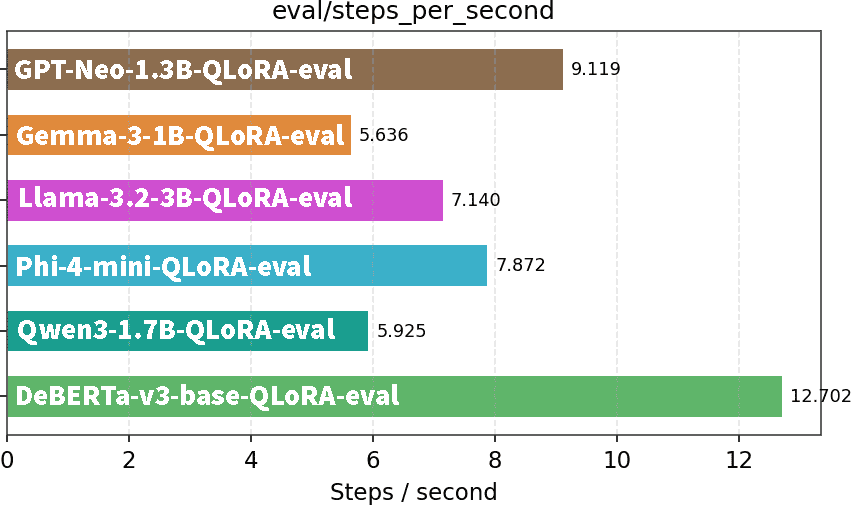 | Figure 4. Evaluation steps per second across models |
4.2.2. Evaluation Samples per Second
- Figure 5 delineates the per-second sample-processing rate, which serves as a critical indicator of inference throughput for high-volume enterprise pipelines [1]. While DeBERTa-v3-base manifested the highest overall throughput (50.808 samples per second), the generative variants exhibited significant variance: GPT-Neo-1.3B led (36.478), followed by Phi-4-mini (31.489) and Llama-3.2-3B (28.561). Gemma-3-1B and Qwen3-1.7B trailed at 22.544 and 23.701 samples per second, respectively. The robust sample throughput of the encoder, GPT-Neo, and Phi-4-mini may suggest that these architectures are particularly well-suited for latency-sensitive batch-scoring workloads.
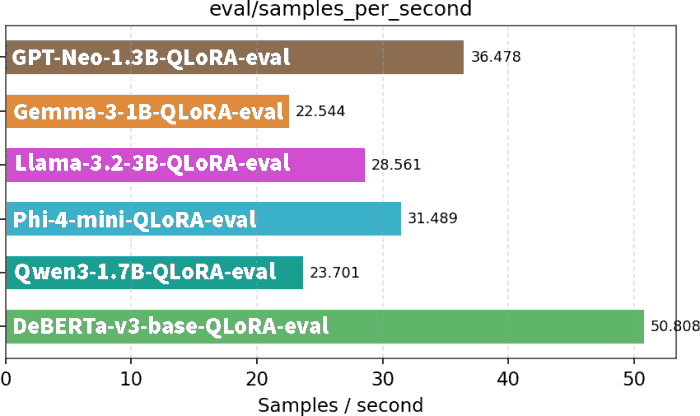 | Figure 5. Evaluation samples per second across models |
4.2.3. Evaluation Runtime
- Figure 6 depicts the total wall-clock time required to complete the evaluation pass. Consistent with the throughput observations, DeBERTa-v3-base demonstrated the shortest evaluation duration (19.68 s), and GPT-Neo-1.3B emerged as the most efficient generative model (27.41 s); conversely, Gemma-3-1B necessitated the most substantial temporal expenditure (44.36 s). This inverse runtime ordering appears to reinforce the purported efficiency advantages of the smaller architectures within the unified pipeline.
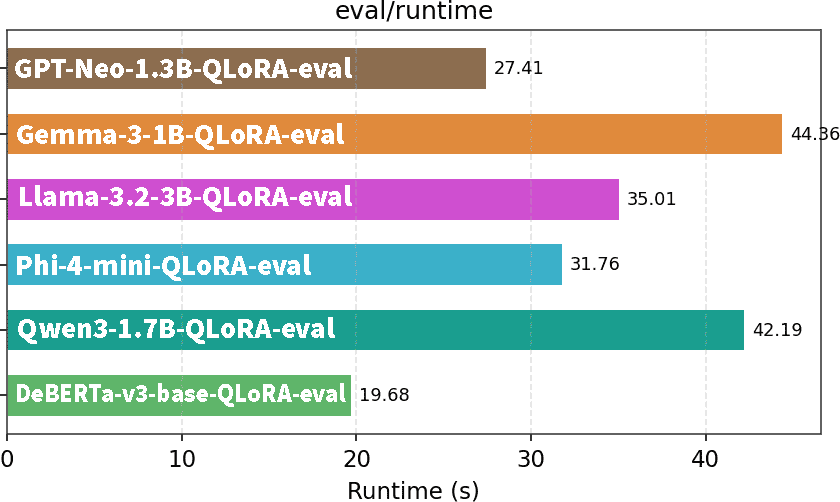 | Figure 6. Evaluation runtime (seconds) across models |
4.2.4. Evaluation Loss
- Figure 7 contrasts the final validation loss of the six models. DeBERTa-v3-base exhibited the lowest loss owing to its discriminative objective; among the generative models, Meta Llama-3.2-3B exhibited the lowest evaluation loss, suggesting the best generalization, while Microsoft Phi-4-mini and Qwen3-1.7B registered the highest values. The observation that lower evaluation loss might not necessarily translate directly into superior downstream classification performance warrants attention: as demonstrated within Subsection 4.5, Phi-4-mini achieved the high-est weighted F1-score among all models despite its higher validation loss, and DeBERTa—despite the lowest loss of all—demonstrated the lowest accuracy.
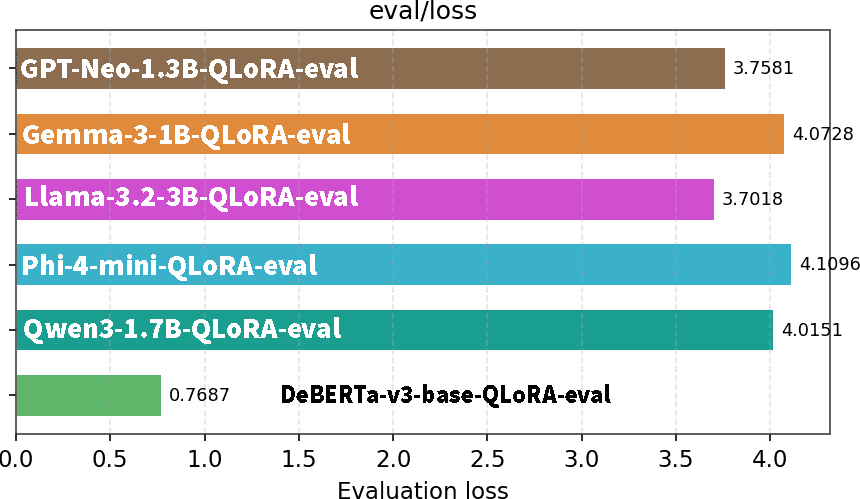 | Figure 7. Evaluation loss across models |
4.3. BLEU Score
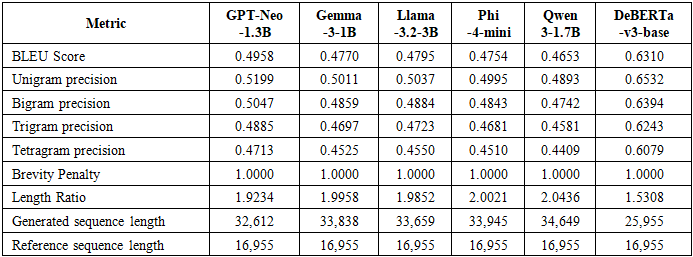
- Table 7 reports the composite BLEU score together with its constituent one- to four-gram precisions, the brevity penalty, length ratio, and translation and reference lengths for each model. Consistent with Subsection 5.2, BLEU is reported here as a generative-fidelity diagnostic and not as a measure of classification correctness; for the discriminative DeBERTa-v3-base, whose generated span is simply the predicted class token, the BLEU and Recall-Oriented Understudy for Gisting Evaluation (ROUGE) figures are included for completeness only and possess no utility regarding classification assessment.
|
4.4. ROUGE Score
- The ROUGE results, as presented in Table 8, appear to corroborate the previously observed findings from the Bilingual Evaluation Understudy (BLEU). Among the generative models, GPT-Neo-1.3B again led across all four ROUGE variants (ROUGE-L = 0.6481), with Llama-3.2-3B following in second position (ROUGE-L = 0.6427). The consistently high ROUGE-L and ROUGE-Lsum values—exceeding 0.61 for every generative model—may indicate strong recall of the longest common subsequences be-tween generated and reference spans. Qwen3-1.7B recorded the lowest generative ROUGE scores (ROUGE-L = 0.6130). As with BLEU, the encoder’s higher ROUGE values may reflect short, fixed-token outputs rather than more substantive generation.
|

4.5. Confusion Matrix
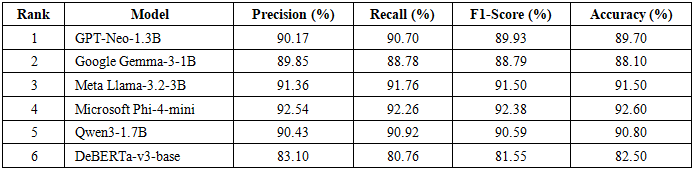
- Beyond generative overlap metrics, the sentiment-classification quality of each model was assessed through confusion matrix analysis over the three target classes—negative, neutral, and positive—on a balanced test set of 1,000 samples. The confusion matrix serves to elucidate the type and source of misclassification, providing essential diagnostic utility for multi-class classification tasks. Table 9 presents the weighted-average precision, recall, F1-score, and overall accuracy for all six models, after which per-model classification reports and confusion matrices are examined in turn. Both weighted-average and macro-average figures are reported in the per-model tables so that minority-class (neutral) behavior is not obscured.
|
4.5.1. Confusion Matrix — Meta Llama-3.2-3B
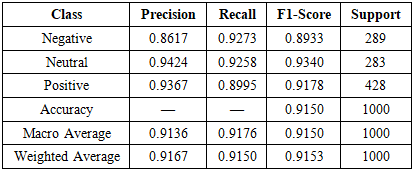
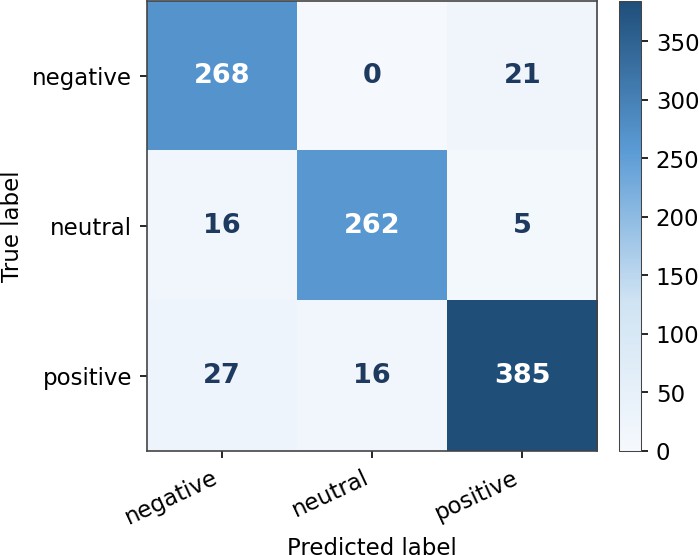
- As delineated in Table 10 and Figure 8, the categorization of the three sentiment classes by Llama-3.2-3B appears to exhibit high and well-balanced reliability, as evidenced by a uniform 0.915 macro- and weighted-average F1-score. Although the model demonstrated proficiency regarding the neutral class (F1 = 0.934), the primary source of classification error may be attributed to a modest confusion between the negative and positive classes, evidenced by the observation that 21 negative samples were misclassified as positive.
|
 | Figure 8. Confusion matrix for Meta Llama-3.2-3B |
4.5.2. Confusion Matrix — Google Gemma-3-1B-IT
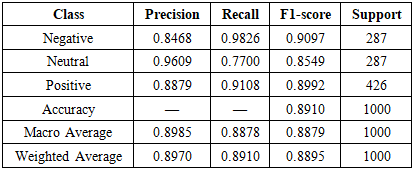
- An evaluation of the performance metrics suggests that the classification model’s utility appears robust; nevertheless, the results pertaining to the neutral class may necessitate subsequent analytical validation.Table 11 and Figure 9 suggest that Gemma-3-1b-it, the smallest generative model in the study, attained near-perfect recall on the negative class (0.98) and high precision on the neutral class (0.96), but at the cost of substantially reduced neutral recall (0.77): The misclassification of 47 neutral samples as positive may indicate a tendency to over-predict the positive class at the expense of neutral instances—a manifestation of the neutral-class ambiguity discussed. Despite this, the model maintained a creditable 0.89 weighted F1-score, suggesting that even a 1-billion-parameter instruction-tuned model can deliver strong sentiment-classification performance under Quantized Low-Rank Adaptation (QLoRA) fine-tuning, albeit with a less uniform per-class balance than the larger models.
|
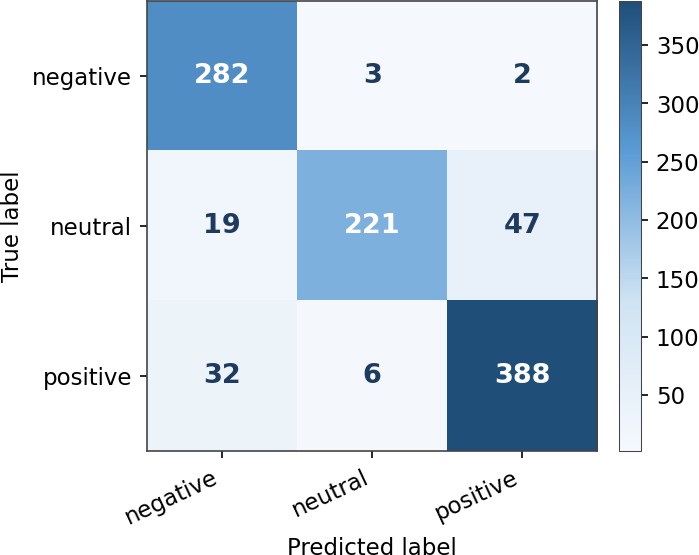 | Figure 9. Confusion matrix for Google Gemma-3-1b-it |
4.5.3. Confusion Matrix — Microsoft Phi-4-mini-instruct
- Data presented in Table 12 and Figure 10 suggest that the Microsoft Phi-4-mini-instruct architecture facilitated the most balanced and accurate classification among all six models, achieving a uniform 0.926 across precision, recall, and weighted F1-score, and tightly clustered per-class F1-scores (0.91–0.94). The pattern of misclassifications appears minimal and comparatively symmetric, with 21 negative samples predicted as positive and 32 neutral samples spread across the polarity classes. This consistently high performance across all polarity classes—and its clear margin over the discriminative baseline—suggests the suitability of Phi-4-mini-instruct as the recommended model for enterprise sentiment analysis deployments in which uniform reliability is paramount.
|
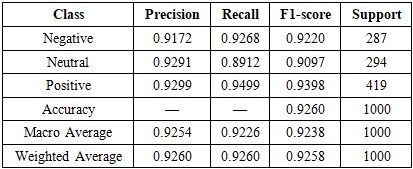
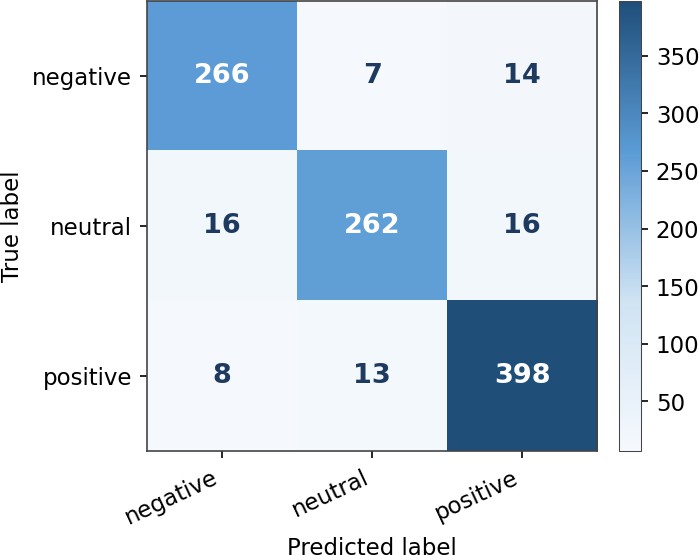 | Figure 10. Confusion matrix for Microsoft Phi-4-mini-instruct |
4.5.4. Confusion Matrix — GPT-Neo-1.3B
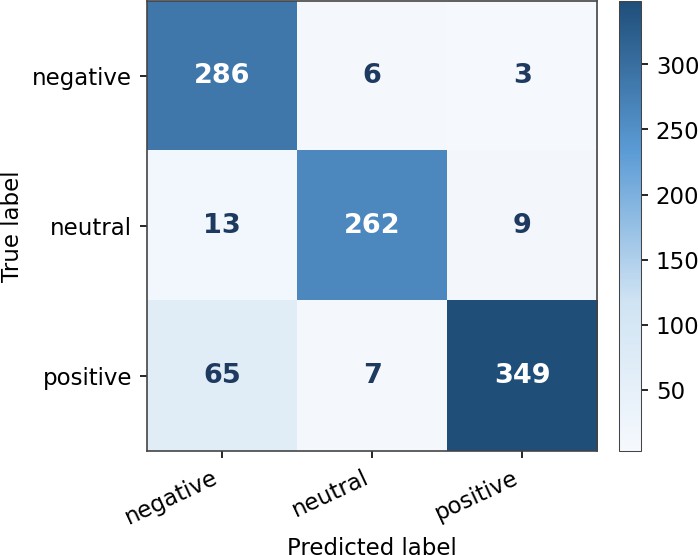
- Classification performance metrics suggest that while the categorization of neutral instances achieves optimal precision, the identification of negative and positive classes may necessitate further adjustment to achieve a more robust balance between precision and recall.As indicated in Table 13 and Figure 11, the Generative Pre-trained Transformer (GPT)-Neo-1.3B—notwithstanding the attainment of the highest Bilingual Evaluation Under-study (BLEU) and Recall-Oriented Understudy for Gisting Evaluation (ROUGE) scores among the generative mod-els—exhibited a lack of balance in the classification profile of the decoder-only group. The model appeared to attain high recall on the negative class (0.97) and high precision on the neutral and positive classes; however, the negative class precision fell to 0.79 as a substantial number of positive samples (65) were misclassified as negative, an error that appears to depress the positive recall to 0.83. The resultant F1-score of 0.868 on the negative class may illustrate a systematic bias toward the negative label.
|
 | Figure 11. Confusion matrix for GPT-Neo-1.3B |
4.5.5. Confusion Matrix — Qwen3-1.7B
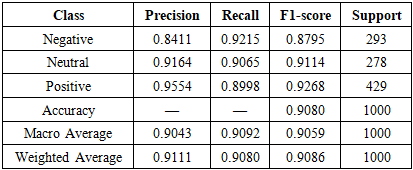
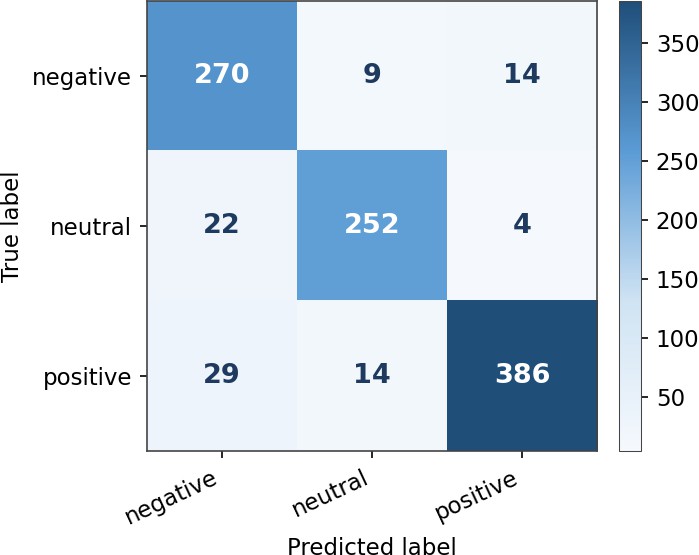
- While the performance metrics appear to indicate robust predictive capacity, the macro-averaged outcomes may suggest a certain degree of variance when evaluating the model across disparate classification categories.Figure 12 The confusion matrix, which elucidates the classification output of the Qwen3-1.7B model, highlights variations in predictive accuracy.
|
 | Figure 12. Classification report for Qwen3-1.7B |
4.5.6. Confusion Matrix — DeBERTa-v3-base
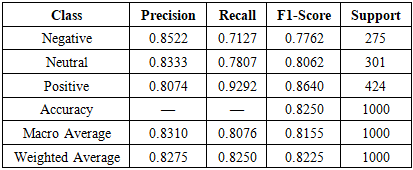
- Table 15 and Figure 13 report the discriminative DeBERTa-v3-base baseline, the least robust classification architecture.
|
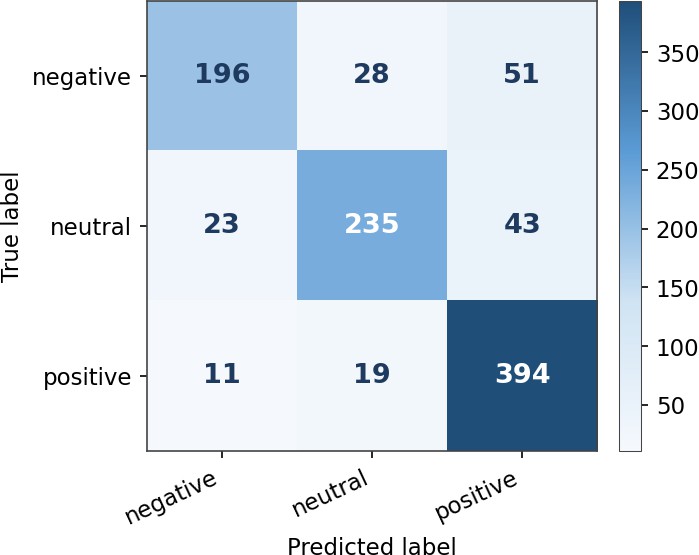 | Figure 13. Confusion matrix for DeBERTa-v3-base |
4.6. Response Time
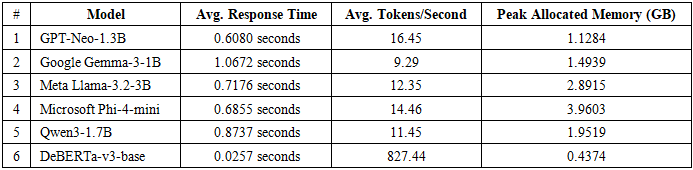
- For enterprise applications, the average response time—the mean wall-clock delay per inference request—was therefore measured for each model under identical conditions. Table 16 elucidates these values, while Figure 14 visualizes the comparison. For the Table 16, Avg. token/second column value taken from the Table 17 and Peak allocation memory (GB) column value taken from during training matric.
|
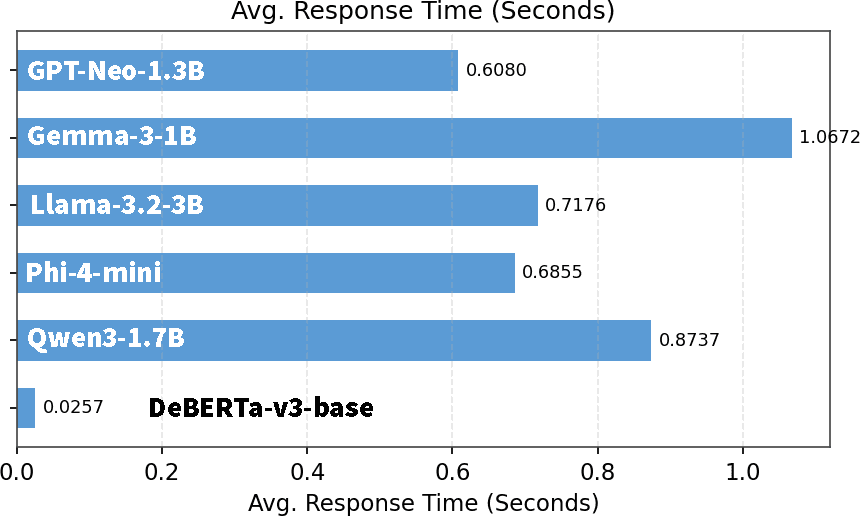 | Figure 14. Average response time comparison across models |
4.7. System Performance
- To profile the computational footprint of each fine-tuning run, system-level resources were monitored continuously through the Weights & Biases platform. The generative models were fine-tuned on an NVIDIA A100-SXM4-40GB GPU, as recorded in Table 18, supported by 167.1 GB of system RAM and 235.7 GB of available disk storage. Monitored indicators—including GPU memory allocation, disk utilization, process memory consumption, token throughput, and VRAM allocation—provide a detailed assessment of resource efficiency during large-scale fine-tuning.
4.7.1. GPU Memory Allocated
- Figure 15 delineates the GPU memory allocation through-out the training process. All six models maintained remarkably low and stable GPU memory utilization—below approximately 20% throughout—directly attributable to the 4-bit NF4 quantization and adapter-only updates of the QLoRA scheme [9]. While the largest model, Phi-4-mini, exhibited the highest allocation plateau, GPT-Neo-1.3B and the lightweight DeBERTa-v3-base occupied the lowest bands. Allocated memory represents the memory occupied by active PyTorch tensors, whereas reserved memory represents the memory managed by PyTorch's caching allocator. The physical memory capacity of the GPU was recorded independently, and any memory-utilization percentage was calculated and labelled according to its stated denominator.
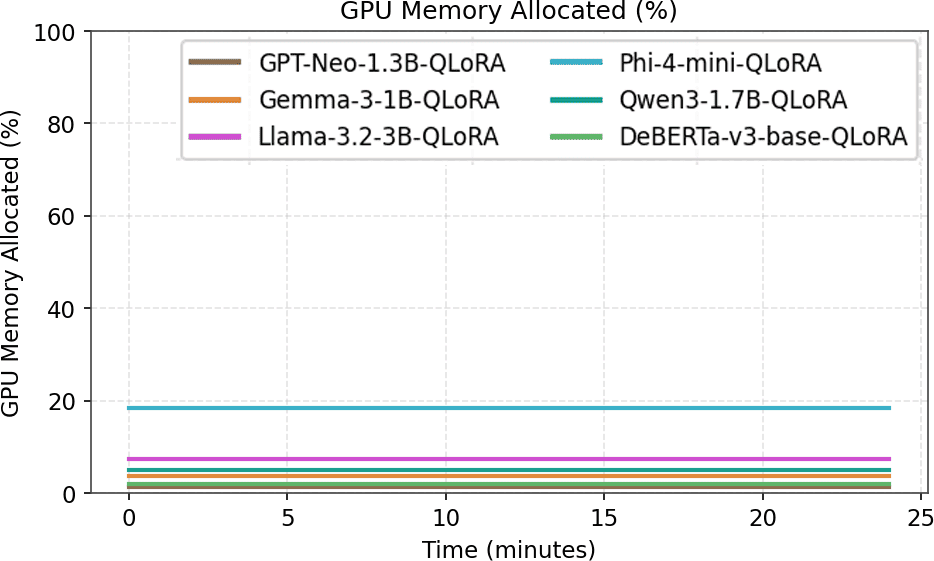 | Figure 15. GPU memory allocated (%) during fine-tuning |
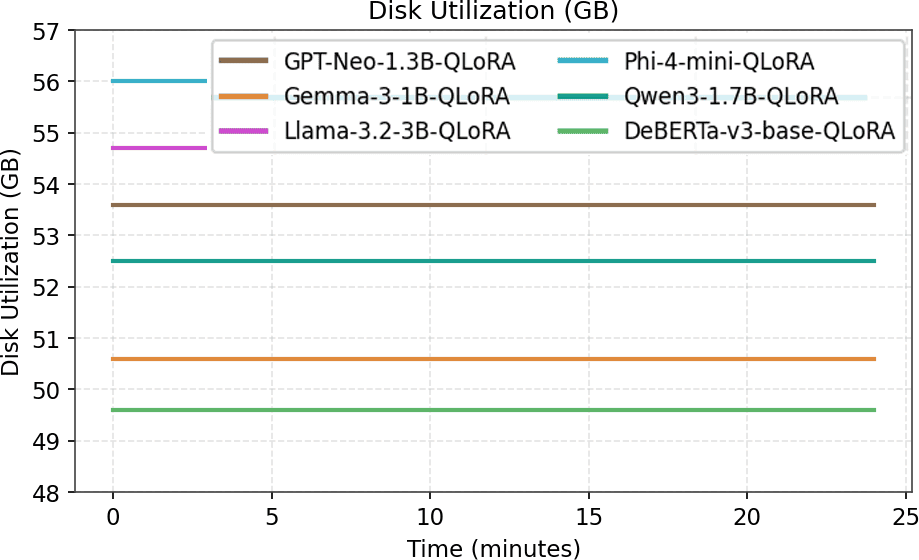
4.7.2. Disk Utilization
- Figure 16 delineates disk utilization in gigabytes throughout the training process. Disk consumption remained stable within a narrow band (approximately 50–56 GB) across all models, which reflects the lightweight checkpointing footprint of the LoRA adapters; specifically, only the small adapter weights, rather than the full quantized backbone, require persistence. Phi-4-mini exhibited the highest disk utilization, whereas the encoder baseline recorded the low-est; this variance appears consistent with their respective adapter and checkpoint magnitudes. The minimal storage overhead appears to constitute a further practical advantage of the approach for enterprise environments, where model versioning and checkpoint retention costs may accumulate across numerous fine-tuning iterations.
 | Figure 16. Disk utilization (GB) during fine-tuning |
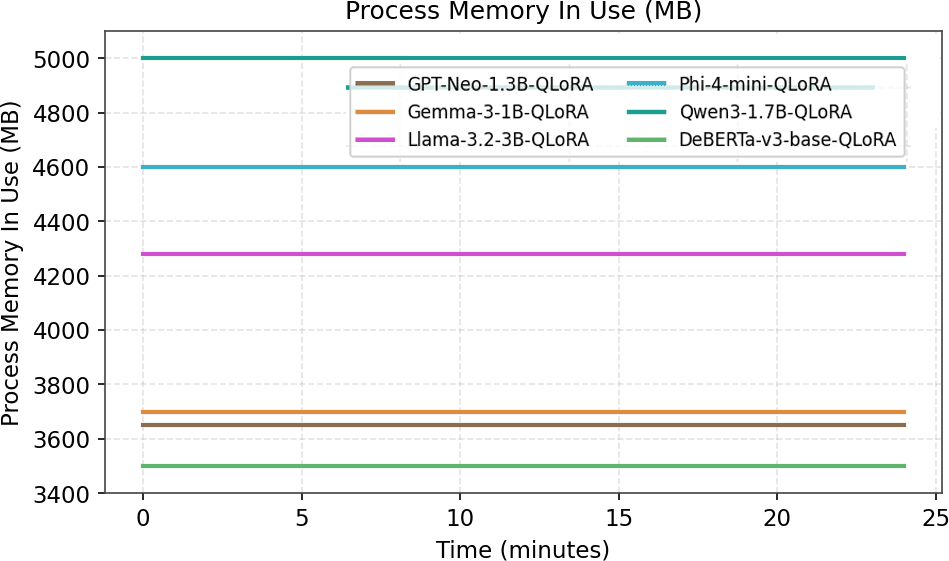
4.7.3. Process Memory in Use
- Figure 17 delineates host-side process memory consumption. While Qwen3-1.7B appears to sustain the highest process memory footprint (approximately 5,000 MB), followed by Phi-4-mini and Llama-3.2-3B, the GPT-Neo-1.3B, Gemma-3-1B, and DeBERTa-v3-base variants maintain lower memory consumption below 3,800 MB. This observed stratification may be attributed to inherent variations in model-specific tokenizer architectures, vocabulary constraints, and distinct adapter configurations. Across all models, process memory remained well within the avail-able 167.1 GB of system RAM, suggesting that substantial headroom remains for concurrent workloads in a production setting.
 | Figure 17. Process memory in use (MB) during fine-tuning |
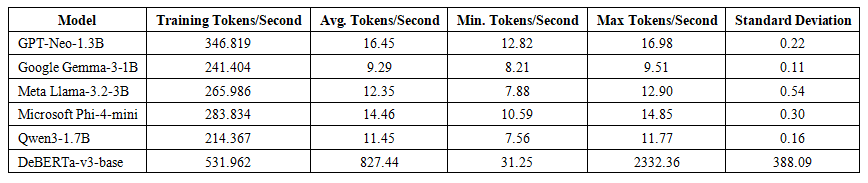
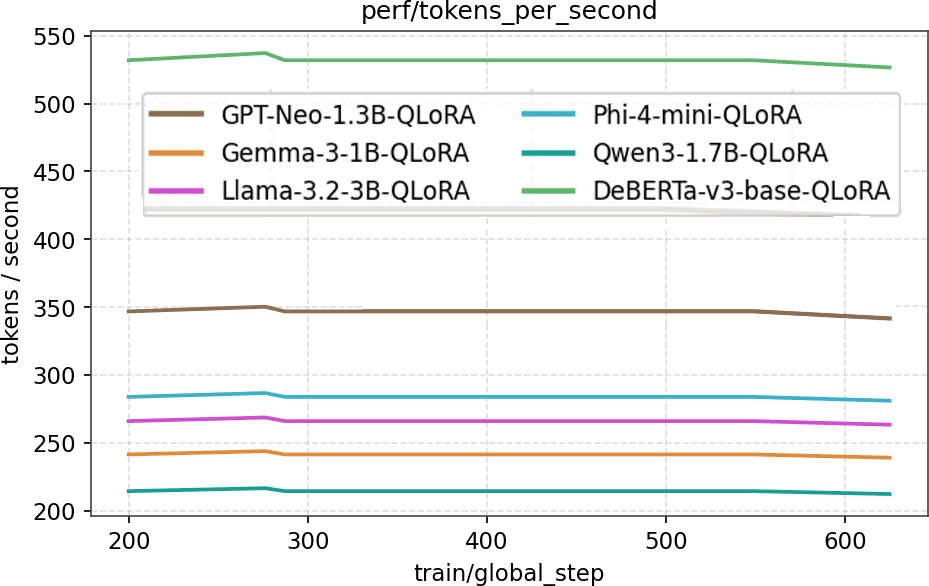
4.7.4. Token Utilization
- Figure 18 and Table 17 appear to facilitate the quantification of token throughput during training and inference. During the training phase, GPT-Neo-1.3B appears to have demonstrated what may be the highest token-processing rate among the generative models, reaching 346.82 tokens per second; conversely, Qwen3-1.7B exhibited the lowest rate at 214.37 tokens per second, a performance differentiation that largely mirrors the training-duration hierarchy presented in Table 4. In contrast, during inference, GPT-Neo-1.3B once more demonstrated the highest throughput within the generative cohort, averaging 16.45 tokens per second, with Phi-4-mini following at 14.46 tokens per second; Gemma-3-1B, in contrast, registered the lowest performance at 9.29 tokens per second. The discriminative DeBERTa-v3-base operated within a distinct regime. Given its emission of a singular classification token, as opposed to an autoregressive span, its effective tokens-per-second metric (averaging 827 with substantial variance, standard deviation [SD] of 388) cannot be directly compared with those of the generative decoders.
 | Table 17. Token throughput by model (training throughput and inference-time tokens-per-second statistics) |
 | Figure 18. Token throughput (tokens per second) during training |
4.7.5. VRAM Allocation
- Figure 19 and Table 18 detail VRAM allocation during training. Owing to the implementation of 4-bit quantization, the VRAM allocation remained exceptionally constrained for every model, ranging from 0.44 GB for the lightweight DeBERTa-v3-base through 1.13 GB for GPT-Neo-1.3B to 3.96 GB for Phi-4-mini. Even when accounting for reserved memory, the peak GPU utilization does not exceed approximately 10% on the 40 GB A100 devices. The flat VRAM curves in Figure 19 suggest a constant, predictable memory footprint throughout training. These measurements elucidate the capacity of the parameter-efficient regime to reduce VRAM requirements to a small fraction of device capacity—enabling all models, including the 3.8-billion-parameter Phi-4-mini, to be fine-tuned on a single mid-range GPU. This dramatic compression of the hardware requirement, achieved without degrading classification accuracy, constitutes the central enabler of cost-effective, enterprise-scale sentiment-analysis fine-tuning and aligns with the efficiency gains reported for QLoRA on substantially larger models [9]. Actual feasibility depends on the GPU architecture, available VRAM, model-loading requirements, sequence lengths, batch size, numerical precision, and inference or training workload.
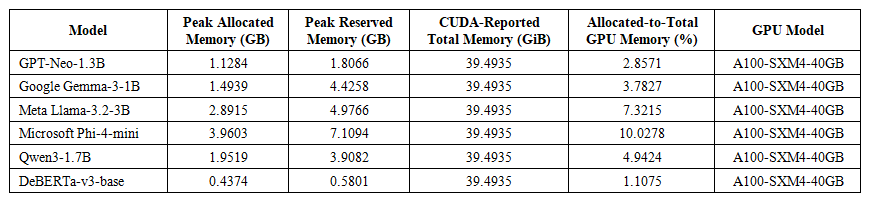 | Table 18. Peak allocated and peak reserved GPU memory during fine-tuning, together with CUDA-reported device memory capacity and the corresponding GPU model |
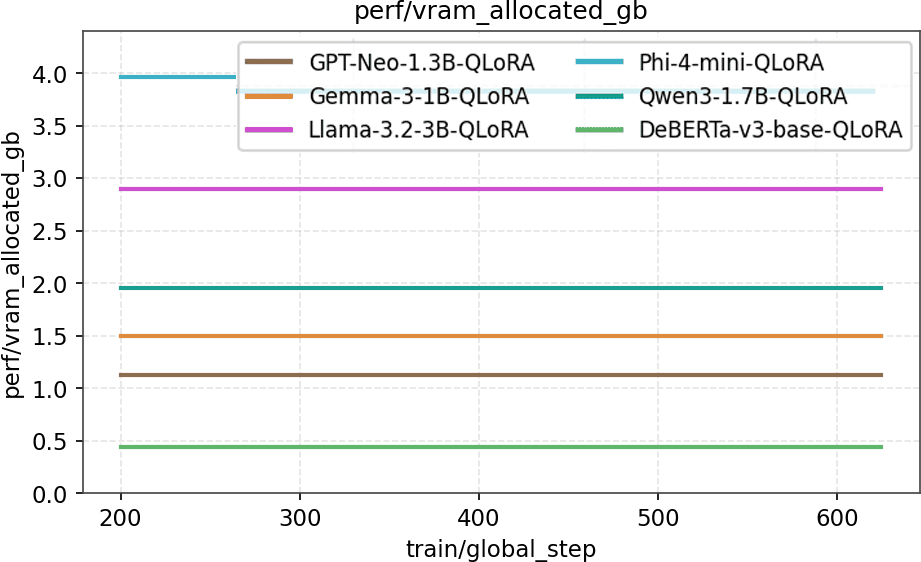 | Figure 19. VRAM allocation (GB) during training |
5. Experimental Analysis
- This section presents an integrative analysis of the experimental outcomes detailed in Section 4; it delineates the quantitative evidence across classification quality, generative fidelity, inference efficiency, and computational foot-print to ascertain which of the six fine-tuned models might be most suitable for enterprise-scale sentiment analysis under varying operating conditions. The analysis proceeds in four parts: a cross-model performance comparison grounded in Tables 6–9 and 16–18; a discussion of the principal challenges that bound classification accuracy, and an examination of concrete avenues for further improvement.
5.1. Performance Comparison
- The comparative assessment of the six models draws together four complementary dimensions of evidence: classification quality (Table 9), generative-overlap fidelity (Table 7 and Table 8), evaluation-stage throughput and loss (Table 6), and deployment-oriented efficiency. The latter category comprises response time (Table 16), token throughput (Table 17), and memory footprint (Table 18). The joint consideration of these dimensions appears to mitigate the well-documented pitfall of optimizing a single metric in isolation; this synthesis may yield a nuanced ranking, wherein the optimal model selection might be contingent upon whether the deployment priority entails predictive accuracy, latency, or hardware cost.Classification quality. Table 9 delineates the weighted-average precision, recall, and F1-score, in addition to over-all accuracy. Microsoft Phi-4-mini-instruct delivered the strongest and most balanced classification performance, attaining 92.6% accuracy and 92.38% weighted F1. Meta Llama-3.2-3B and Qwen3-1.7B followed at 91.5% and 90.8% accuracy, while GPT-Neo-1.3B and Google Gemma-3-1B recorded 89.7% and 88.1%. The observed performance advantage of Phi-4-mini appears consistent with its instruction-optimized pretraining and its all-linear adapter placement, which together afford greater representational flexibility for the classification objective; the extant literature suggests that the selection of the foundational model may represent a key determinant of downstream sentiment classification accuracy [2].Generative fidelity. Because the generative models per-form sentiment extraction as a text-to-text generation task, the BLEU and ROUGE scores in Table 7 and Table 8 quantify the lexical fidelity of the generated label spans relative to the reference annotations. Here, the ranking diverges from the classification ordering: GPT-Neo-1.3B achieved the highest BLEU score (0.4958) and the highest generative ROUGE-L (0.6481), with the other generative models clustering narrowly. BLEU and ROUGE are n-gram-overlap metrics originally designed for machine translation and summarization, respectively [21], and they measure surface lexical agreement rather than classification correctness. Evaluation efficiency and validation loss. Table 6 delineates evaluation-stage behavior. The discriminative encoder obtained the lowest validation loss (0.7687) and highest throughput by construction; among the generative models, Meta Llama-3.2-3B obtained the lowest validation loss (3.7018), marginally ahead of GPT-Neo-1.3B (3.7581), whereas Microsoft Phi-4-mini recorded the highest (4.1096). The observation that Phi-4-mini attained the best classification accuracy of all six models despite a relatively high generative validation loss—and that De-BERTa, with the lowest loss of all, recorded the lowest accuracy—reinforces the preceding point: the token-level cross-entropy and discriminative objectives may be only loosely aligned with the discrete classification objective, so validation loss alone is an unreliable proxy for downstream accuracy. In throughput terms, the lightweight GPT-Neo-1.3B was the most efficient generative model at evaluation (36.478 samples per second), while Gemma-3-1B was the slowest (22.544).In summary, Microsoft Phi-4-mini-instruct appears to be the recommended model for accuracy critical enterprise sentiment analysis, combining the highest classification quality (92.6% accuracy and weighted F1) with near-best generative inference latency (0.686 s). Where the deployment priority shifts toward minimal latency and hardware cost, and a lower accuracy is acceptable, the discriminative DeBERTa-v3-base appears to constitute a viable alternative—offering an order-of-magnitude faster inference (0.026 s) and the smallest VRAM footprint (0.44 GB)—while GPT-Neo-1.3B offers the fastest generative inference with the highest generative overlap scores, though its less balanced per-class behavior tempers its suitability. Meta Llama-3.2-3B and Qwen3-1.7B appear to occupy a favorable middle ground at 91.5% and 90.8% accuracy, with Qwen3-1.7B additionally providing multilingual robustness valuable for globally distributed enterprises.
5.2. Challenges
- Although all five generative models achieved high aggregate accuracy, several systematic factors constrain further gains toward perfect classification. The identification of these challenges appears essential both for interpreting the present results.Label noise, silver-standard supervision: As detailed, the automatic generation of dataset labels by the cardiffnlp/twitter-roberta-base-sentiment-latest teacher model, rather than by human annotators, implies that the reported accuracies assess the degree of concordance with that teacher; these figures primarily reflect teacher agreement rather than human gold-standard alignment. A further limitation is the absence of an independently human-annotated evaluation set. Although the existing results provide a comparative assessment of agreement with teacher-generated labels, they do not independently establish the models’ alignment with human sentiment judgments.Neutral-class confusion and class imbalance. The per-class classification reports in Section 4.5 suggest that the neutral class constitutes the primary source of error across models [18]. For Gemma-3-1B, neutral recall fell to 0.77 as 47 neutral tweets were misclassified as positive, and several models exhibited asymmetric negative–positive confusion. This pattern appears characteristic of short-text sentiment analysis, wherein the neutral category is intrinsically ambiguous and frequently overlaps with the polarity classes; the same neutral-class weakness has been reported in QLoRA-fine-tuned LLaMA-3 on three-class product reviews, where the neutral F1-score (0.81) trailed the negative (0.87) and positive (0.90) scores [18]. Class imbalance compounds this difficulty: because aggregate accuracy and weighted F1 can be dominated by majority classes, the provision of macro-averaged F1 in every per-model table of Section 5.1 serves to expose minority-class behavior, in line with recommended practice for imbalanced sentiment data.
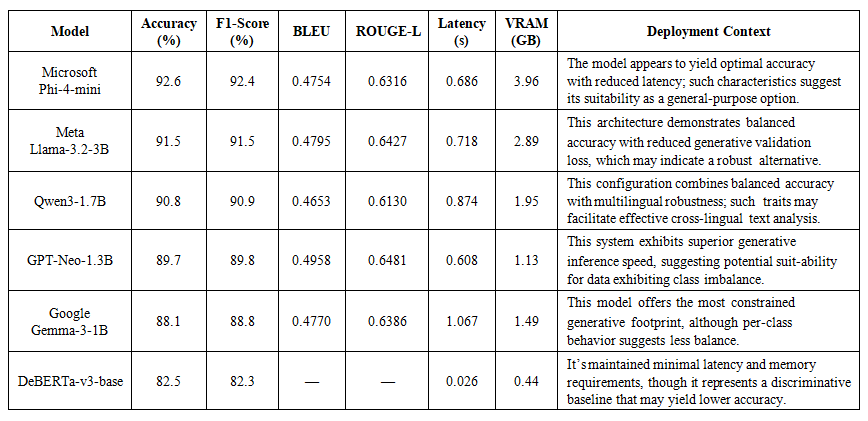 | Table 19. Consolidated cross-model comparison across classification quality, generative fidelity, inference efficiency, and memory footprint, with the recommended deployment scenario for each model. Values are drawn from Table 6–Table 9 and Table 16–Table 18 |
5.3. Comparison with Existing Works
- To contextualize the present findings within the broader scholarly discourse, Table 20 delineates the accuracy and F1 scores observed herein alongside those documented in recent peer-reviewed and preprint investigations regarding the implementation of QLoRA and LoRA for LLMs in sentiment analysis.
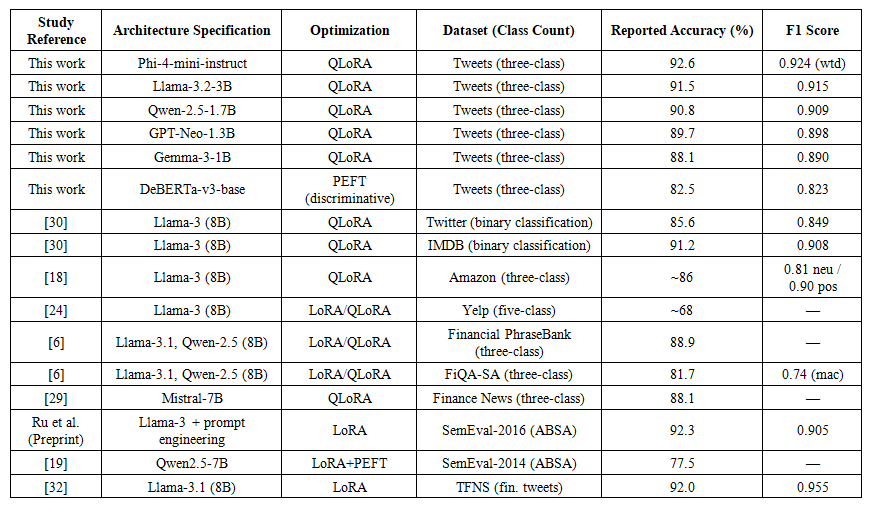 | Table 20. Comparison of the present results with recent Quantized Low-Rank Adaptation (QLoRA) and Low-Rank Adaptation (LoRA) sentiment analysis studies on comparable model families. Preprints are marked [P]; all other entries are peer-reviewed. Accuracy and F1 are reported as stated in each source for the indicated dataset and label scheme |
6. Conclusions
- This study presented an empirical analysis of QLoRA-based fine-tuning of generative transformer models for enterprise-scale sentiment analysis in balancing accuracy against efficiency and benchmarking the generative paradigm against a discriminative baseline. Six compact models were adapted within a unified, parameter-efficient pipeline and evaluated on a three-class tweet task. Results indicate that 4-bit QLoRA fine-tuning enables one-to-four-billion-parameter generative transformers to achieve enterprise-grade performance. Weighted accuracy ranged from 88% to 92.6%, with Phi-4-mini-instruct strongest at 92.6% accuracy and 92.38% weighted F1. Notably, every generative model outperformed the DeBERTa-v3-base baseline (82.5%) by roughly 7–10 points, suggesting base-model quality and learning paradigm, rather than the tuning method, dominate downstream accuracy. Each model, including the 3.8-billion-parameter Phi-4-mini, was run on a single A100-SXM4-40GB GPU, with allocated VRAM of 0.44–3.96 GB and peak utilization below 10% of a 40-GB device, consistent with foundational QLoRA findings [9]. The evaluated generative models achieved 88.1%–92.6% accuracy against the teacher-generated silver-standard labels, with Phi-4-mini-instruct achieving the highest observed agreement. Although these results provide useful evidence for comparing the evaluated models under a common QLoRA configuration, they should not be interpreted as equivalent to human-validated sentiment accuracy. The absence of an independently human-annotated evaluation set limits the conclusions that can be drawn regarding alignment with human sentiment judgments.Future work should evaluate the models on lower-memory GPUs and assess performance across representative batch sizes, input lengths, concurrent requests, and workload volumes. Also, should validate the findings against human-annotated data and examine whether the observed model rankings persist under independent evaluation.
References
| [1] | Aminabadi, R.Y., Rajbhandari, S., Awan, A.A., et al., 2022. Deepspeed- inference: Enabling efficient inference of transformer models at unprecedented scale, 1–15URL: https://doi.org/10.1109/sc41404.2022.00051, doi:10.1109/sc41404.2022.00051. |
| [2] | BAYAT, S., Işık, G., 2026. Benchmarking qlora-fine-tuned llama and deepseek models for sentiment analysis on movie reviews and twitter data. Computational Systems and Artificial Intelligence 2, 33–37. URL: https://doi.org/10.69882/adba.csai.2026015, doi:10. 69882/adba.csai.2026015. |
| [3] | Biderman, D., Portes, J., Ortiz, J.G., et al., 2024. Lora learns less and forgets less. URL: http://arxiv.org/abs/2405.09673, doi:10.48550/ arxiv.2405.09673. |
| [4] | Biewald, L., 2023. Experiment tracking with weights and biases. URL: wandb.com. |
| [5] | Black, S., Gao, L., Wang, P., Leahy, C., Biderman, S., 2021. Gpt-neo: Large scale autoregressive language modeling with mesh-tensorflow. Zenodo (CERN European Organization for Nuclear Research) URL: https://zenodo.org/record/5297715, doi:10.5281/zenodo.5297715. |
| [6] | Cheng, X., 2025. Financial sentiment analysis with large language models. Finance & Economics 1. URL: https://doi.org/10.61173/ gvntfv56, doi:10.61173/gvntfv56. |
| [7] | Cui, J., Wang, Z., Ho, S.B., Cambria, E., 2023. Survey on senti-ment analysis: evolution of research methods and topics. Artificial Intelligence Review 56, 8469–8510. URL: https://doi.org/10.1007/s10462-022-10386-z, doi:10.1007/s10462-022-10386-z. |
| [8] | Dettmers, T., Lewis, M., Belkada, Y., Zettlemoyer, L., 2022. Llm.int8(): 8-bit matrix multiplication for transformers at scale. URL: http://arxiv.org/abs/2208.07339, doi:10.48550/arxiv.2208.07339. |
| [9] | Dettmers, T., Pagnoni, A., Holtzman, A., Zettlemoyer, L., 2023. Qlora: Efficient finetuning of quantized llms. URL: http://arxiv. org/abs/2305.14314, doi:10.48550/arxiv.2305.14314. |
| [10] | Gemma Team, Kamath, A., Ferret, J., et al., 2025. Gemma 3 technical report. URL: https://doi.org/10.48550/arxiv.2503.19786, doi:10.48550/arxiv.2503.19786. |
| [11] | Grattafiori, A., Dubey, A., Jauhri, A., et al., 2025. The llama 3 herd of models. URL: https://hal.science/hal-05414211. |
| [12] | Han, Z., Gao, C., Liu, J., Zhang, J., 2024. Parameter-efficient fine-tuning for large models: A comprehensive survey. URL: http:// arxiv.org/abs/2403.14608, doi:10.48550/arxiv.2403.14608. |
| [13] | He, P., Gao, J., Chen, W., 2021a. Debertav3: Improving deberta using electra-style pre-training with gradient-disentangled embedding sharing. URL: http://arxiv.org/abs/2111.09543, doi:10.48550/arxiv. 2111.09543. |
| [14] | He, P., Liu, X., Gao, J., Chen, W., 2021b. Deberta: Decoding-enhanced bert with disentangled attention. URL: https://openreview.net/pdf?id=XPZIaotutsD. |
| [15] | Hu, J.E., Shen, Y., Wallis, P., et al., 2021. Lora: Low-rank adaptation of large language models. URL: http://arxiv.org/abs/2106.09685, doi:10.48550/arxiv.2106.09685. |
| [16] | Konstantinidis, T., Iacovides, G., Xu, M., Constantinides, T.G., Mandic, D., 2024. Finllama: Financial sentiment classification for algorithmic trading applications, in: Proceedings of the 5th ACM International Conference on AI in Finance (ICAIF ’24), Association for Computing Machinery (ACM). URL: https://doi.org/10.1145/ 3677052.3698696, doi:10.1145/3677052.3698696. |
| [17] | Lhoest, Q., del Moral, A.V., Jernite, Y., et al., 2021. Datasets: A community library for natural language processing. URL: https://doi.org/10.18653/v1/2021.emnlp-demo.21, doi:10.18653/v1/2021.emnlp-demo.21. |
| [18] | Li, T., Li, H., Zhou, Y., 2025. E-commerce sentiment analysis using fine-tuned llama3 models: A qlora - based approach. Journal of Technology Innovation and Engineering 1. URL: https://doi.org/10.63887/jtie.2025.1.4.13, doi:10.63887/jtie.2025.1.4.13. |
| [19] | Lim, P.Y., Ho, C.F., Tan, C.W., 2026. Parameter-efficient adaptation of qwen2.5 for aspect-based sentiment analysis using low-rank adap-tation and parameter-efficient fine-tuning. Engineering Proceedings 128, 15. URL: https://doi.org/10.3390/engproc2026128015, doi:10.3390/engproc2026128015. presented at the 2025 IEEE International Conference on Computation, Big-Data and Engineering (ICCBE), Penang, Malaysia, 27–29 June 2025. |
| [20] | Lin, C.Y., 2004. Rouge: A package for automatic evaluation of sum-maries, 74–81. URL: http://citeseerx.ist.psu.edu/viewdoc/summary? doi=10.1.1.111.9426. |
| [21] | Lin, H., Ng, V., 2019. Abstractive summarization: A survey of the state of the art, Association for the Advancement of Artificial Intelligence. pp. 9815–9822. URL: https://doi.org/10.1609/aaai.v33i01.33019815, doi:10.1609/aaai.v33i01.33019815. |
| [22] | Maruf, A.A., Ziyad, Z.M., Haque, M.M., Khanam, F., 2022. Emotion detection from text and sentiment analysis of ukraine russia war using machine learning technique. International Journal of Advanced Computer Science and Applications 13. URL: https://doi.org/10.14569/ijacsa.2022.01312101, doi:10.14569/ijacsa.2022.01312101. |
| [23] | Microsoft, Abouelenin, A., Ashfaq, A., et al., 2025. Phi-4-mini technical report: Compact yet powerful multimodal language models via mixture-of-loras. URL: http://arxiv.org/abs/2503.01743, doi:10.48550/arxiv.2503.01743. |
| [24] | Patil, R., Khot, P., Gudivada, V.N., 2025. Analyzing llama3 per-formance on classification task using lora and qlora techniques. Applied Sciences 15, 3087–3087. URL: https://doi.org/10.3390/app15063087, doi:10.3390/app15063087. |
| [25] | Raffel, C., Shazeer, N., Roberts, A., et al., 2019. Exploring the limits of transfer learning with a unified text-to-text transformer. URL: http://arxiv.org/abs/1910.10683, doi:10.48550/arxiv.1910.10683. |
| [26] | Reiter, E., 2018. A structured review of the validity of bleu. Com-putational Linguistics 44, 393–401. URL: https://doi.org/10.1162/coli_a_00322, doi:10.1162/coli\_a\_00322. |
| [27] | Tanha, J., Abdi, Y., Samadi, N., Razzaghi, N., Asadpour, M., 2020. Boosting methods for multi-class imbalanced data classification: an experimental review. Journal Of Big Data 7. URL: https://doi.org/10.1186/s40537-020-00349-y, doi:10.1186/s40537-020-00349-y. |
| [28] | Terven, J., Córdova-Esparza, D., Romero-González, J.A., Ramírez-Pedraza, A., Chávez-Urbiola, E.A., 2025. A comprehensive survey of loss functions and metrics in deep learning. Artificial Intelligence Re-view 58. URL: https://doi.org/10.1007/s10462-025-11198-7, doi:10.1007/s10462-025-11198-7. |
| [29] | Toksöz, S.B., Işık, G., 2025. Efficient adaptation of large language models for sentiment analysis: A fine-tuning approach. Journal of the Institute of Science and Technology 15, 1149–1164. URL: https://doi.org/10.21597/jist.1648466, doi:10.21597/jist.1648466. |
| [30] | Toksöz, S.B., Işık, G., 2026. Benchmarking qlora-fine-tuned llama and deepseek models for sentiment analysis on movie reviews and twitter data. Computational Systems and Artificial Intelligence 2, 33–37. URL: https://doi.org/10.69882/adba.csai.2026015, doi:10.69882/adba.csai.2026015. |
| [31] | Topal, M.B., Ferworn, A., Cevik, M., 2024. Sentiment analysis with large language models: evaluating qlora fine-tuning, instruction strategies, and prompt sensitivity, IEEE. |
| [32] | Wang, D., Patel, J., Zha, D., Yang, S.Y., Liu, X.Y., 2025. Fin-lora: Benchmarking lora methods for fine-tuning llms on finan-cial datasets. URL: http://arxiv.org/abs/2505.19819, doi:10.48550/ arxiv.2505.19819. |
| [33] | Yang, A., Li, A., Yang, B., et al., 2025. Qwen3 technical report. URL: http://arxiv.org/abs/2505.09388, doi:10.48550/arxiv.2505.09388. |
| [34] | Zhang, W., Deng, Y., Liu, B., Pan, S.J., Bing, L., 2024. Sentiment analysis in the era of large language models: A reality check, 3881–3906URL: https://doi.org/10.18653/v1/2024.findings-naacl.246, doi:10.18653/v1/2024.findings-naacl.246. |