-
Paper Information
- Paper Submission
-
Journal Information
- About This Journal
- Editorial Board
- Current Issue
- Archive
- Author Guidelines
- Contact Us
Computer Science and Engineering
p-ISSN: 2163-1484 e-ISSN: 2163-1492
2024; 14(6): 169-174
doi:10.5923/j.computer.20241406.07
Received: Oct. 21, 2024; Accepted: Nov. 8, 2024; Published: Nov. 12, 2024

Artificial Intelligence, Campaign Effectiveness Model
 Abstract
 Reference
 Full-Text PDF
 Full-text HTML
Ravi Kumar1, Dinesh Kumar2, Ahmad Saeed3, Chandra Jaiswal4
1Cloud Data & AI/ML, Dollar General Corporation, Charlotte, NC, USA
2Communication Network-SIG Resource, Oracle America, Inc, Austin, TX, USA
3Stock Plan Services, Fidelity Investments, Durham, NC, USA
4Computational Data Science and Engineering, North Carolina Agricultural and Technical University, Greensboro, NC, USA
Correspondence to: Ravi Kumar, Cloud Data & AI/ML, Dollar General Corporation, Charlotte, NC, USA.
| Email: |  |
Copyright © 2024 The Author(s). Published by Scientific & Academic Publishing.
This work is licensed under the Creative Commons Attribution International License (CC BY).
http://creativecommons.org/licenses/by/4.0/

The intended objective is to develop a robust supervised machine learning model to predict the conversion rate of marketing campaigns including advertisement, promotions and offers. This entails leveraging a diverse set of features that encapsulate various aspects of the campaign. By employing historical data which has customer transactions and preferences, the model aims to discern patterns and relationships, ultimately providing a predictive score that can assess the likelihood of successful conversions for different marketing initiatives. The end goal is to enhance strategic decision-making by offering insights into the factors that significantly influence campaign success or failure, thereby optimizing future marketing efforts for improved conversion outcomes. Overall, this paper aims to serve as a reference point for both academia and industry professionals to implement and evaluate marketing strategy campaigns, particularly from the technical point of view. We will build a machine learning model that predicts the conversion rate/score of marketing campaigns based on various features. Leveraging a diverse set of features like campaign type, duration, budget, audience, audience, and age group, the model aimed to offer insights into the factors which can influence the campaign success score.
Keywords: Data Science, Deep learning, Artificial intelligence, Data science, Data-driven decision-making, Predictive analytics, Intelligent applications
Cite this paper: Ravi Kumar, Dinesh Kumar, Ahmad Saeed, Chandra Jaiswal, Artificial Intelligence, Campaign Effectiveness Model, Computer Science and Engineering, Vol. 14 No. 6, 2024, pp. 169-174. doi: 10.5923/j.computer.20241406.07.
Article Outline
1. Introduction
- As mentioned in the abstract, our aim from this paper is to serve as a reference point for professionals from across the industries (finance/media/telecom/retail) to implement and evaluate marketing strategy campaigns. We will build a machine learning model that predicts the conversion rate/score of marketing campaigns based on various features. Leveraging a diverse set of features like campaign type, duration, budget, audience, audience, and age group, the model aimed to offer insights into the factors which can influence the campaign success score. Usually Marketing campaigns may have different goals, such as working on brand awareness, increasing sales or increasing event participation. But all campaigns require specific resources, whether that’s money from the marketing budget or employees’ time and expertise. When resources are on the line and management has invested work and money in the product, leadership would want to know that the ways they’re spending are worthwhile.However, determining the effectiveness of a marketing campaign can become challenging if we don’t have a way to measure. While stating your overall goal is a good start, objectives must be specific enough to tie back to data you can collect and analyze. Whether that feedback consists of numbers or consumers’ perceptions, linking it to campaigns can help determine whether we are using your resources efficiently. We will try both with a traditional regression model as well as with the Tensorflow Keras algorithm with Neural Networks.
2. Metrics, Measure Marketing Campaign
- Establishing and measuring the success of a marketing campaign involves using key performance metrics (KPIs) which can give us numbers and stats to measure the effectiveness of a campaign. There are number of KPIs which we can include in our measurements, some are listed below:Return of Investment: ROI is a common metric that professionals in industry use to measure the investment amount we have spent on marketing versus how much we have earned back. For example, if a retail media marketing campaign for soft drink costs $1,000 and brings in $10,000 worth of sales, the ROI is $9,000 or 9 times of investment. The higher your ROI, the more successful the investment.Customer lifetime value (CLTV): This is again a very common metric to measure the lifetime value of a customer by calculating the customer's average sale amount by how many times they buy each year by the average amount of years they remain a customer. For example, if a customer spends $100 on average per sale and buys four times per year with the expectancy of staying a customer for next 1 year. Their customer lifetime value would be $400. It’s a powerful base metric to build upon to retain customers, increase revenue from less valuable customers, and improve the customer experience overall.Conversion rate: This metric measures how many visitors to your website/app joined the subscriptions/services or bought products during a specific time frame of a campaign. For example, if 100 people visit your website during one month of a marketing campaign and generate 10 leads, that calculates to a 10% conversion rate.Churn rate: Marketing campaign churn rate is the ratio of customers/users who stop using market subscriptions with a marketing campaign for a specific time period. The customer lifetime and churn rate must be in the same timeframe, such as months or yearsCustomer Lifetime Value (CLV) is calculated using a formula that includes churn rate, and the churn rate is a factor in the calculation of customer lifetime.
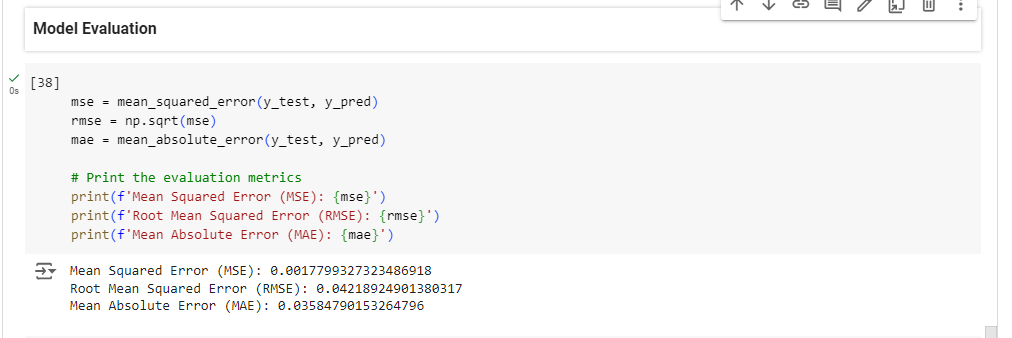
3. Evaluation
- We have tried to evaluate campaign effectiveness models with Random Forest Regression and similar implementation with deep learning ANN algorithms. There are many more models we could potentially use to develop regressors, which could yield even better predictions. However, the focus of this paper is rather to explain some of the core principles of such regression in a — for the most part — intuitive and interpretable way than to produce the most accurate predictions. By using Python language and Google Colab editor, we can easily build these models and at the same store data in Pandas Dataframes, which are highly efficient for data analysis and mass data manipulation. The use of Python offers several benefits, including being open source, scalable and easy to code, having in-memory processing capabilities, and having a rich set of open-source libraries for complex tasks, as well as having machine learning and AI capabilities. This allows for the efficient and cost-effective development and consumption of integration APIs. Furthermore, the approach discussed in the article can be applied to all cloud providers, making it a versatile and cloud agnostic solution. In summary, the use of Python to develop this solution offers a cost-effective and versatile solution, and the methodology outlined in the article provides a clear and detailed guide for successful cloud integration.
4. Marketing Campaign Dataset
- Dataset Description:The Marketing Campaign Dataset provides valuable insights into the effectiveness of various marketing campaigns. This dataset captures the performance metrics, target audience, duration, channels used, and other essential factors that contribute to the success of marketing initiatives. With 2,00,000 unique rows of data spanning two years, this dataset offers a comprehensive view of campaign performance across diverse companies and customer segments.Columns:Company: The company responsible for the campaign.Campaign_Type: The type of campaign employed, including email, social media.Target_Audience: Targeted by the campaign, such as women aged 25-34, men aged 18-24, or all age groups.Duration: The duration of the campaign, expressed in days.Channels_Used: Channels utilized to campaign, like email, social media platforms.Conversion_Rate: The percentage of leads or impressions that are converted.Acquisition_Cost: The cost incurred by the company to acquire customers.ROI: Return on Investment, representing the profitability and success of the campaign.Location: The geographical location where the campaign was conducted.Language: Language used in the campaign communication, including English, Spanish.Clicks: No. of licks generated by the campaign, indicating user engagement.Impressions: No. of times the campaign displayed/viewed by the target audience.Engagement_Score: Level of engagement generated by the campaign, score range 1 to 10.Customer_Segment: The specific customer segment or audience category.Date: The date on which the campaign occurred.Scope:By leveraging this dataset, ML professionals can uncover valuable metrics regarding campaign performance, audience preferences, channel effectiveness, and ROI. This dataset serves as a valuable resource for market research, campaign optimization to refine their marketing strategies and drive targeted growth.
5. Exploratory Data Analysis
- Let's perform some exploratory data analysis (EDA) and create visualizations for the given dataset. Exploratory Data Analysis (EDA) is an important step in data science projects. It involves analyzing and visualizing data to understand its key characteristics, uncover patterns, and provide authentic insight about relationships between variables refers to the method of studying and exploring record sets to apprehend their traits, discover patterns, locate outliers, and identify relationships between variables.The Box plot below [Figure-1] shows the distribution of conversion rates by campaign type:
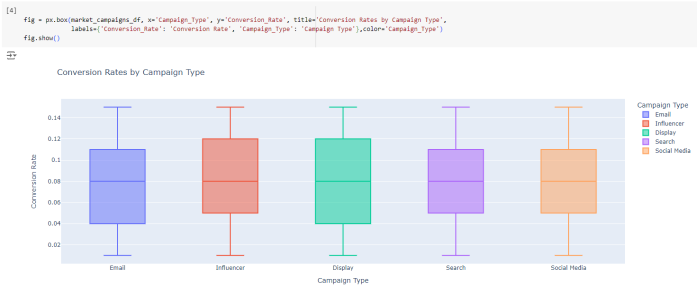 | Figure 1 |
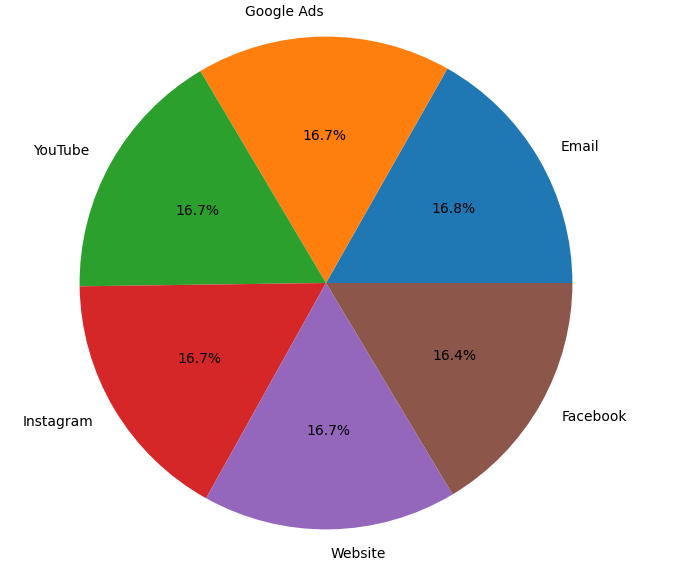 | Figure 2 |
6. ML Model
- In this section, we will use the RandomForestRegressor model. Random Forest Regression in machine learning is an ensemble technique with which we can perform both regression and classification tasks with the use of multiple decision trees. The basic idea behind this model is to combine multiple decision trees and determine the final output.The random forest regressor is built almost exactly like the decision tree. We only need to add the number of trees, here called estimators, as a parameter. Since we do not know the optimal number, we will add another element to the grid search to determine the best regressor.Hyperparameter Tuning [Figure-3]: Grid searching is a method to find the best possible combination of hyper-parameters at which the model achieves the highest accuracy. Before applying Grid Searching on any algorithm, Data is divided into training and validation sets, a validation set is used to validate the models. A model with all possible combinations of hyperparameters is tested on the validation set to choose the best combination.Implementation:Grid Searching can be applied to any hyperparameters algorithm whose performance can be improved by tuning hyperparameters. For example, we can apply grid searching on K-Nearest Neighbors by validating its performance on a set of values of K in it.
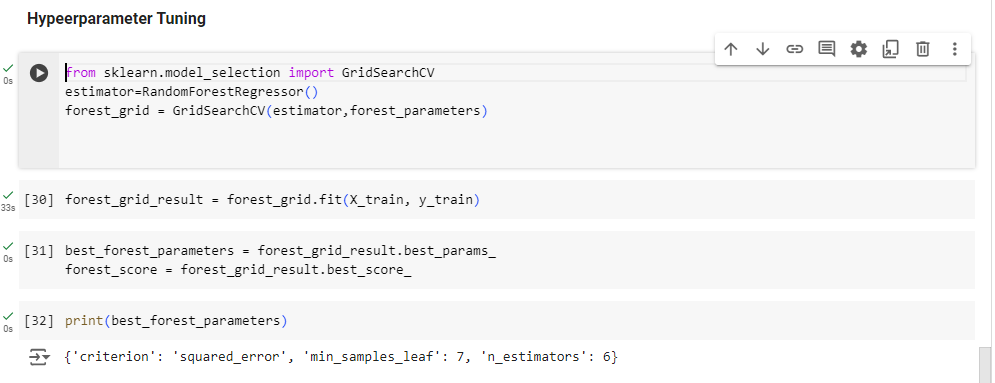 | Figure 3 |
 | Figure 4 |
7. Using Deep Learning- Artificial Neural Networks (ANN) for Regression
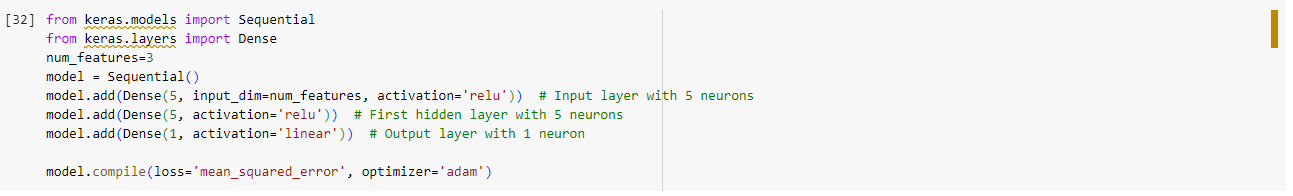
- There are many more models we could potentially use to develop regressors, e.g. artificial neural networks, which might yield even better predictors. Here I am trying to implement a Deep Learning ANN for a Regression use case.In image [figure-5], I will have two hidden layers with five neurons each and one output layer with one neuron. Can you change these numbers? Yes, we can change the number of hidden layers and the number of neurons in each layer. The “Sequential” module from the TensorFlow Keras library is used to create a sequence of ANN layers stacked one after the other. Each layer is defined using the “Dense” module of Keras where we specify how many neurons would be there, and which technique would be used to initialize the weights in the network. what will be the activation function for each neuron in that layer etc.
 | Figure 5 |
8. Predicting Customer Churn
- One more concept which I want to highlight in this paper is CHURN rate. Churn rate and campaign effectiveness are closely intertwined in the realm of retail marketing and customer retention analysis. Effective campaigns can play a crucial role in mitigating churn and improving customer retention. One important application of predictive behavior modeling is in the area of customer churn. Customer churn occurs when customers or subscribers stop doing business with a company or service and leave the company or product.Given a large amount of customer data like demographic data, customer purchase history, service usage, billing data, etc. a neural network (ANN) that is trained on this data can perform a classification of customers into various categories of risk in terms of future churn. A high churn rate, which indicates a significant number of customers canceling their subscriptions or services, can have a detrimental impact on a business's profitability predictions. The network trained on this data would be able to classify a brand-new customer into one of the categories of risk for future churn and can also assign a churn score. Buy Till you Die (BTYD) models are the ones which are widely used in the retail industry and are based on Pareto/NBD to predict churn rate/score trained on historical data which contains purchase records and transactions of a customer data. These are really good models in terms of accuracy of prediction, plus we can get not only churn predictions, but also CLV predictions from these models. Also known as customer attrition, customer churn is a critical metric because it is much less expensive to retain existing customers than it is to acquire new customers. By tracking churn, you can determine which campaigns are successful and which ones need improvement.
9. Conclusions
- We were able to build and train regressors that allow us to predict the number of impressions (and other performance metrics in an analogue fashion) for future marketing campaigns from historical campaign data.The highest prediction accuracy has been achieved with a random forest model. We can now use these predictions to evaluate a new marketing campaign even before its start. Also, this allows us to determine the best parameters including e.g. timeline and budget size for our campaigns since we can calculate the predictions with different values for those features. We have also been able to go through the relationship of Campaign effectiveness models with CHURN rate, and see how interlinked they are with each other.As I explained in the previous section, customer attrition, customer churn is a critical metric because it is much less expensive to retain existing customers than it is to acquire new customers. By tracking churn, you can determine which campaigns are successful and which ones need improvement.
ACKNOWLEDGEMENTS
- We would like to acknowledge Dollar General Corporation and University of North Carolina, Charlotte for providing guidance and help in this research work. We appreciate the continuous encouragement and provided lab work environment to complete this research.We also want to acknowledge the help from our team and department lab for allowing us to conduct fair model training and implementation. Models are acknowledged and unbiased, have been tested with complete scrutiny and process.