-
Paper Information
- Paper Submission
-
Journal Information
- About This Journal
- Editorial Board
- Current Issue
- Archive
- Author Guidelines
- Contact Us
Computer Science and Engineering
p-ISSN: 2163-1484 e-ISSN: 2163-1492
2022; 12(1): 15-29
doi:10.5923/j.computer.20221201.02
Received: Feb. 22, 2022; Accepted: Mar. 7, 2022; Published: Mar. 15, 2022

Cyberphysical Security Analysis of Digital Control Systems in Hydro Electric Power Grids
 Abstract
 Reference
 Full-Text PDF
 Full-text HTML
Lukumba Phiri, Simon Tembo
Department of Electrical and Electronic Engineering, School of Engineering, University of Zambia, Lusaka, Zambia
Correspondence to: Lukumba Phiri, Department of Electrical and Electronic Engineering, School of Engineering, University of Zambia, Lusaka, Zambia.
| Email: |  |
Copyright © 2022 The Author(s). Published by Scientific & Academic Publishing.
This work is licensed under the Creative Commons Attribution International License (CC BY).
http://creativecommons.org/licenses/by/4.0/

The use of hydro energy to generate electric power is crucial to meet the increasing energy demand of a modern economy and maintains the stability of power supply for unstable sources of power like solar, and wind. In newly constructed hydropower plants (HPPs), the trend among control systems is to adopt contemporary digital and cyber-based systems at the expense of obsolete analog hard-wired systems. Therefore, cyber-physical security is a critical issue in reliability-constrained HPPs. In this paper, we present different levels/layers of protection to manage cyber security. We adopt generalized stochastic Petri nets to quantitatively evaluate the intrusion probability. We then propose a new cyber framework and show that the proposed framework conforms to NIST cybersecurity regulations. Finally, we discuss dependability through three metrics, i.e., reliability, maintainability, and availability. A case study is presented to demonstrate that the proposed cyber framework is highly dependable through analyzing steady-state probabilities.
Keywords: Control networks, Control systems, Cyber-physical security, Dependability analysis, Generalized stochastic Petri nets (GSPNs), Hydropower plants, National Institute of Standards and Technology (NIST)
Cite this paper: Lukumba Phiri, Simon Tembo, Cyberphysical Security Analysis of Digital Control Systems in Hydro Electric Power Grids, Computer Science and Engineering, Vol. 12 No. 1, 2022, pp. 15-29. doi: 10.5923/j.computer.20221201.02.
Article Outline
1. Introduction
- Hydropower is the main renewable resource in Africa with over 37GW of installed capacity. The African continent also has the highest untapped hydropower potential in the world, with only 11% utilized. Hydropower amounts to 17% of electricity generation in Africa, with this share potentially increasing to more than 23% by 2040, as part of many African countries' ambitious proposals for creating a lower-carbon energy system, and universal energy access in Africa. Hydropower provides a free and clean fuel source - water, renewed by rainfall. It can supply large amounts of electricity and, when combined with storage (a reservoir), can be despatched to provide baseload power or to smooth out the intermittency of other renewables in an energy system - meaning it is one of the most flexible and reliable forms of renewable energy [1,2].In Zambia, energy sources include renewable sources such as water, solar, wind, and biomass; as well as fossil fuels such as petroleum. Given the substantial unexploited reserves of renewable sources, Zambia has the potential to be self-sufficient in energy, except for petroleum that is wholly imported into the country. Despite the diversity of these energy sources, however, water remains the main energy source in Zambia. It is estimated that Zambia possesses 40 percent of the water resources in the SADC region and has a hydropower potential above 6,000MW out of which about 2,354MW has been developed. The national installed capacity of electricity stood at 2,981.23 MW as of 30th June 2020. With regards to the installed capacity by technology, hydro generation accounted for 80.5 percent followed by coal at 10.1 percent. Further Heavy Fuel Oil (HFO) generation was at 3.7 percent, while Diesel and Solar were at 2.8 percent and 3.0 percent, respectively. The large hydropower projects under feasibility studies are over 2,800MW situated on the major rivers of Zambia. For this reason, it would be advisable to formulate optimal generation plans that are centered around hydropower [3,4,5].
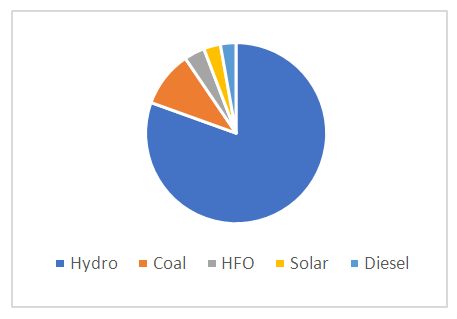 | Figure 1. Power Generation Summary |
2. Security of Digital Control Systems in HPPS
2.1 Overview of Main Control and Automation System in Hydroelectric Power
- The main control and automation system in a hydroelectric power plant are associated with the start and stop sequence for the unit and optimum running control of power (real and reactive), voltage, and frequency. Data acquisition and retrieval are used to cover such operations as relaying plant operating status, instantaneous system efficiency, or monthly plant factor, to the operators and managers. The type of control equipment and levels of control to be applied to a hydro plant are affected by such factors as the number, size, and type of turbine and generator. The control and monitoring equipment for a hydropower plant includes control circuits/logic, control devices, indication, instrumentation, protection, and annunciation at the main control board and the unit control board for generation, conversion, and transmission operation, grid interconnected operation of hydro stations including small hydro stations. These features are necessary to provide operators with the facilities required for the control and supervision of the station’s major and auxiliary equipment. In the design of these features, consideration must be given to the size and importance of the station to other stations in the power system, location of the main control room to the pieces of equipment to be controlled, and all other station features which influence the control system. The control system of a power station plays an important role in the station’s rendering of reliable service; this function should be kept in mind in the design of all control features. Basic control functions in a modern hydroelectric station require all equipment (generating unit, auxiliaries, switchyard equipment, and hydraulic control e.g. spillway gates, etc.) to be connected to the plant control system by electrically actuated element for automatic control, protection, and monitoring.
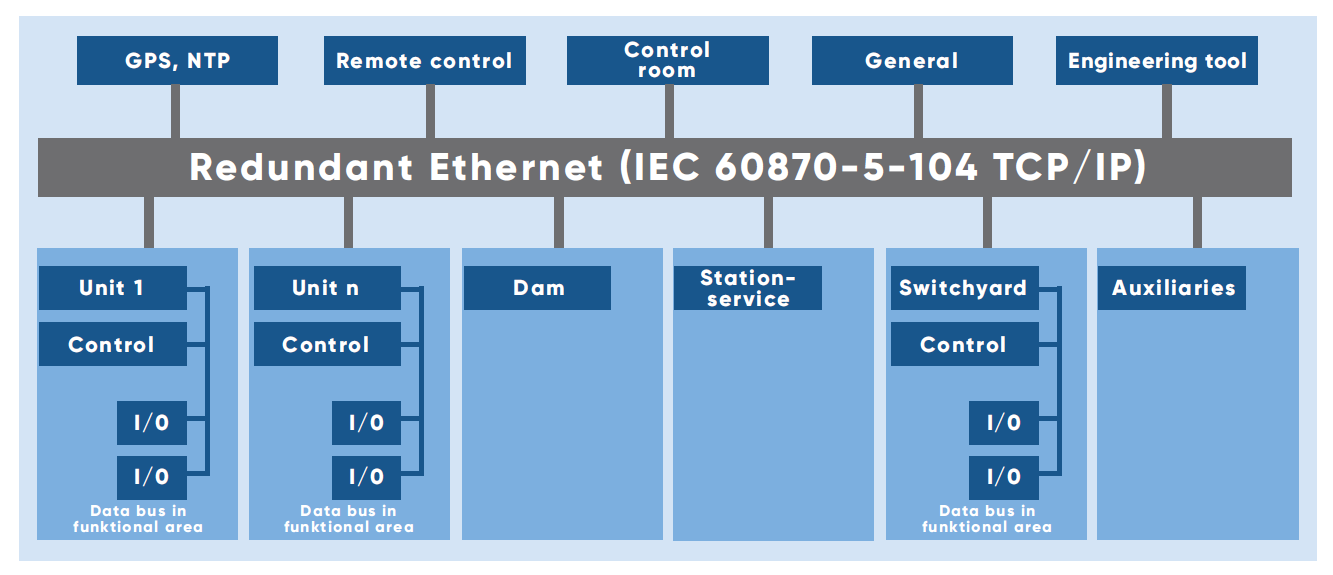 | Figure 2. Architecture for Digital Control Systems |
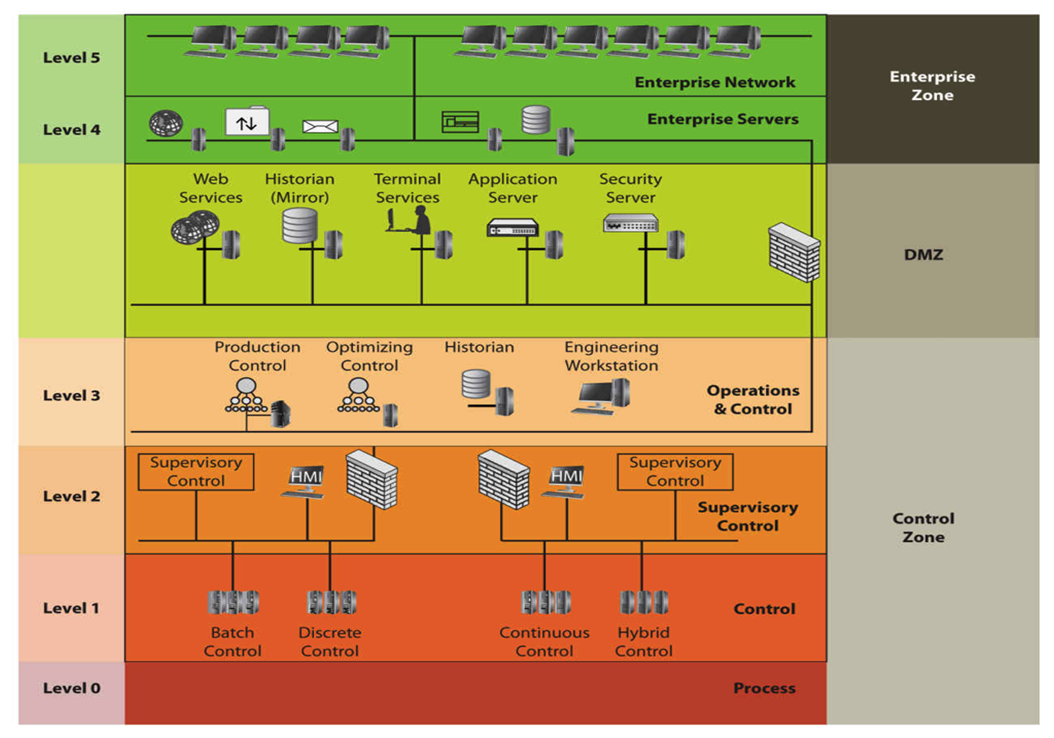 | Figure 3. Purdue Enterprise Reference Architecture |
2.2. Cyberphysical Security Accidents in HPPs
- The European Network of Transmission System Operators for Electricity (ENTSO-E) became the latest power sector organization to have fallen victim to a cyberattack [26].ENTSO-E – which represents 42 European transmission system operators in 35 countries – said on 9 March 2020 it had recently “found evidence of a successful cyber intrusion into its office network”, and was introducing contingency plans to avoid further attacks. According to French think-tank Institut Français des relations internationals (IFRI) [27], the power sector has become a prime target for cyber-criminals in the last decade, with cyberattacks surging by 380% between 2014 and 2015. Motives include geopolitics, sabotage, and financial reasons. The US Department of Energy (DoE) [28] reported 150 successful attacks between 2010 and 2014 that targeted systems holding information regarding electricity grids. In June 2019, the New York Times [29] reported that the US launched cyberattacks into the Russian power grid [30]. According to the newspaper, US military hackers used American computer code to target the grid as a response to the Kremlin’s disinformation campaign, hacking attempts during the 2018 midterm elections, and suspicions of Russia hacking the energy sector. The story was condemned by President Trump, who said it was fake news, and experts, while the Kremlin said it was a possibility. According to the 2018 National Defence Authorisation Act, government hackers are permitted to carry out “clandestine military activities” to protect the country and its interests [31]. Saudi Aramco became the target of cyberattacks in 2017 when hackers targeted the safety system in one of the company’s petrochemical plants. Experts believe that, despite the plant shutting down, an incident could have taken place. According to a report by the Independent [32], a plant official said that the attack aimed not only to shut down the plant or wipe out data but also sent a political message. Experts traced the attack to a Russian Government-owned laboratory. The 2016 cyberattack on Ukraine was the second in less than a year. Hackers left customers in parts of Kyiv without electricity for an hour, after disabling an electricity substation. The BBC [33] said that the loss of electricity amounted to a fifth of Kyiv’s power consumption for that night. The attack was attributed to Russian hackers, with some experts suggesting that the attack aimed to physically damage the power grid. Hackers got into the system of a western Ukrainian power company, cutting power to 225,000 households. A US report into the blackout concluded that a virus was delivered via email through spear-phishing – a technique that sends key employees detailed messages, using information gathered from social media. The report did not name any perpetrators but experts suggested it was linked to a group of Russian hackers. South Korean nuclear and hydroelectric company Korea Hydro and Nuclear Power (KHNP) was hacked at the end of 2014 [34]. Hackers stole and posted online the plans and manuals for two nuclear reactors, as well as the data of 10,000 employees. The US pinned the attack on North Korea but South Korean authorities traced the IP addresses to Shenyang, a city in northeast China.
2.3. Digital Control Systems (SCADA-specific) Communication Protocols
- The communication protocols are regulations for the data depiction and exchange over a communication link. [18]. SCADA communication protocols play a pivotal role in MTU-RTU interactions. At first, instruments and protective relays permitted remote communications using local RS232 associations or using a dial-up modem interface. But due to scalability issues, they have moved to more advanced protocols [19].As the SCADA system is a composition of many components, if each component uses a vendor-specific protocol, it will not be able to communicate with other components. Each vendor-specific SCADA protocol has its own rules and procedures of communication which can vary from data presentation and conversion, assignment of addresses to command generation, and status information. Therefore, to support interoperability and cost efficiency, some open standards were presented. To encourage open protocols, the Open System Interconnection (OSI) model was introduced in 1984 [20]. The OSI model shows the data communications process composed of seven independent layers, and each of the layers describes how the data is handled in the different stages of transmission. Open protocols increase the availability of the device, interoperability, vendors independence, optimized cost, easy technical support, etc.A study of various communication protocols is done below.A. Modbus: The Modbus transmission protocol, an application layer messaging protocol was developed by Gould Modicon for their Modicon programmable controller [21]. It is the most commonly used protocol for connecting electronic devices due to being openly published and easy to use. Moreover, it is used for the interactions between MTU and RTUs. A typical Modbus network supports one master and a maximum of two hundred forty-seven slaves. RTUs only reply to messages targeted to them but avoid responding to the broadcasts [22]. It uses four types of communication messages to request/respond to messages to/from MTU, acknowledgment messages for the successful delivery of the message at the MTU and RTUs. MTU can send messages to the slaves and also assign an address to each of the slaves which varies from 1 to 247. Modbus/TCP, an enhanced variation of Modbus is also available which focuses on reliable communication over the Internet and Intranet. It follows TCP/IP’s error detection methods to detect the errors. Modbus plus protocol is proposed to overcome the master terminal vulnerability issues. It is a token-based protocol. Modbus protocol assembles the request message transmitted from the remote terminal to the master terminal into PDU which is an amalgam of the data request and a function code. PDU changes over into an application information unit by including function code fields at the OSI layer. Similarly master terminal will send a reply to the remote terminal. However, due to extra cable and other communication issues, it is not preferred for real-time communication.B. DNP3: Distributed Network Protocol (DNP) protocol is based on the Enhanced Performance Architecture (EPA) model. EPA is a streamlined type of OSI layer architecture. It was developed by Harris, Distributed Automation Products [35]. The motive for DNP3 protocol development was to obtain open and standards-based interoperability between RTUs, MTU, and Programmable Logic Controller (PLC). Datalink layer convention, transport functions, application conventions, and data link library are the core components of the DNP3 protocol. A user layer is appended to the EPA architecture which is responsible for multiplexing, data fragmentation, prioritization and error checking, etc. In the layered architecture of the DNP3 protocol, the application layer details the packet design, services, and procedure for the application layer. This message is then forwarded to the pseudo-transport layer which forwards the segmented data unit to the data link layer [37]. It further forwards the message to the physical layer [41]. It supports multiple-slave, peer-to-peer (P2P), and multiple-master communication.C. IEC 60870-5 Protocol: The International Electro-Technical Commission (IEC) 60870-5 protocol also follows the EPA model. The application layer is included as an additional top layer of EPA architecture which indicates the functions related to the telemetry-control framework. Telecontrol framework-based variations e.g. T101, T102, T103, T104 characterize diverse particulars, data objects, and function codes at the application convention level [42]. For efficient transmission, the DNP3 layer stack adds a pseudo-transport layer, but it is not used in IEC 60870-5.D. Foundation Fieldbus Protocol: This protocol was presented by FieldComm Group [43]. The user, application, data link, and physical, the four-layer stack is used in Foundation Fieldbus. The architecture of Foundation Fieldbus follows the OSI layer model in which the user layer is added as an additional top layer of the application layer. The user layer acts as a gateway between software programs and field devices. Easy process integration, multifunctional devices, open standard, decrease massive wire cost features superior it from other protocols.E. Profibus Protocol: Process Field Bus (Profibus) protocol was promoted by BMBF (Germany). The communication of data between MTU and RTUs is a cyclic process. MTU reads RTUs input data and writes RTUs output data. Field Bus Message Specification (FMS), Distributed Peripheral (DP), and Profibus Variations (PA) are the three versions of the Process Field Bus (Profibus) protocol. Profibus is most popularly used in discrete manufacturing and process control [35].F. IEC 61850 Protocol: The International Electro-Technical Commission (IEC) 61850 protocol was developed by the IEC Technical Committee 57 [44]. A group of manufacturers (ABB, Alstom, Schneider, SEL, Siemens, Toshiba, etc.) proposed this protocol to improve the interoperability of equipment [45]. This protocol differs from other OSI reference models in the sense that it also describes how data is executed and stored apart from how it is sent and received. The source and destination addresses are 48 bits each [46]. IEC 61850 is generally used in electrical substations for communication among intelligent electronic devices [44]. Moreover, IEC 61850 abstract data models can be mapped to many other protocols, e.g. MMS, GOOSE, and SMV [47].SCADA communication conventions have advanced from restrictive to business/open-source conventions. SCADA framework’s unwavering quality relies on its correspondence conventions. A brief and comparative analysis of communication protocols available for SCADA is in Table 1. Since DNP3, IEC 60870-5-101, and Foundation Fieldbus are open Standards [30]. These protocols are more widely used. DNP3 and IEC 60870-5-101 focus on providing the first-level solutions of Data Acquisition Interoperability. These are required to communicate outside the substation [23]. DNP3 allows SCADA systems to poll at different frequencies while IEC 60870-5-101 poll at the same frequency which helps it is a case of limited bandwidth. The packet size in DNP is larger than IEC 60870-5-101. Hence for long-distance DNP3 protocol is favored. Modbus is, for the most part, utilized for applications where the volume of information exchange is low [19]. It is a quick and safe convention, and a ton of data is loaded in one message [18].
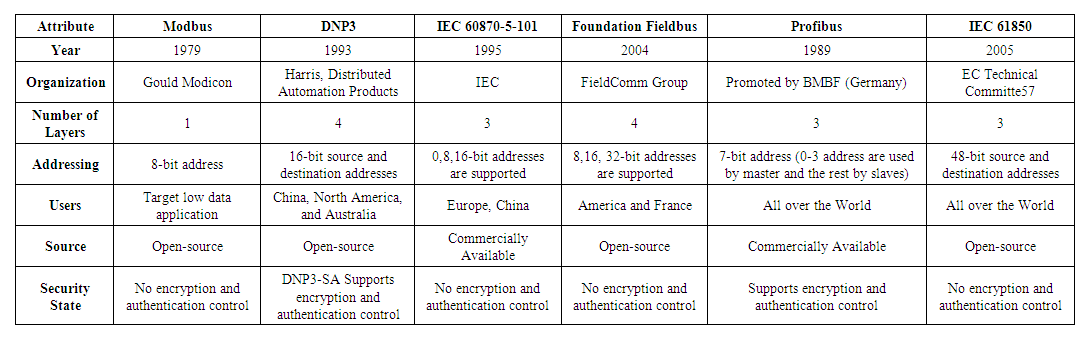 | Table 1. ICS Communication Protocols |
3. Intrusions into the Control Networks
- In this paper, we discuss and model cyber intrusions into the control networks launched from outside the network as shown in Fig. 4.State-space-based approaches, i.e., Markov chains and PNs, are powerful to quantitatively model security as well as dependability measures.However, the state space grows exponentially as the number of components increases, which makes it difficult to compute the steady-state probability. This paper is focused on steady-state analysis using the state-space-based modeling tool, i.e., GSPNs. Before discussing intrusions into the control networks, we will briefly introduce PNs and their extension, GSPNs, which will be used throughout this paper. Detailed explanations can be found in [21], [52], and [53].
3.1. Petri Nets and GSPNs
- A PN also called a place transition net, is a pictorial mathematical model of information flow named after its developer, Petri [54]. A PN comprises a set of places drawn by circles, a set of transitions drawn by bars, and a set of directed arcs. Places and transitions are connected by arcs from places to transitions and from transitions to places. Places may contain tokens, which are drawn as black dots residing in the circles. A transition is enabled if all of its input places contain at least one token. An enabled transition fires by removing one token in each input place and generating one token in each output place. The execution of a PN is controlled by the movement of tokens, while the distribution of tokens over places is denoted by a marking corresponding to the notion of a state in a Markov chain. A PN is defined as follows [52].Definition 1: A PN is a four-tuple (P, T, A, and M0), where:1) P = {P1, P2, . . ., Pn} is a set of places;2) T = {t1, t2, . . ., tm} is a set of transitions;3) A ⊆ {P × T} ∪ {T × P} is an arc set;4) M0 = (m01,m02, . . .,m0n) is the initial marking.A GSPN defines two different classes of transitions: 1) immediate transitions (drawn as boxes) and 2) timed transitions (drawn as bars). In a GSPN, an enabled immediate transition fires immediately, whereas an enabled timed transition fires after an exponentially distributed firing time. The state space is then divided into two subsets, one containing vanishing states (markings), which enable at least one immediate transition, and the other containing tangible states (markings), which enable only timed transitions. A GSPN is said to be k-bounded if for any marking, the maximum number of tokens in any place is less than or equal to k. Therefore, a k-bounded GSPN is isomorphic to the continuous-time Markov chain and the quantitative analysis of GSPNs can be transferred to that of Markov models [53]. The definition of a GSPN is given as follows.Definition 2: A GSPN is a four-tuple (PN, T1, T2, and λ), where:1) PN = (P, T, A, M0) is the underlying place transition net;2) T1 ⊆ T is a set of timed transitions;3) T2 ⊂ T is a set of immediate transitions;4) T1 ∩ T2 = φ, T1 ∪ T2 = T;5) λ = (λ1, λ2, . . ., λk) is a set of nonnegative real numbers:a) λi denotes a firing rate if ti ∈ T1;b) λi denotes a firing weight if ti ∈ T2.PNs and GSPNs are versatile and hence, find them been applicable in a variety of systems engineering.
3.2. Modeling Intrusions into the Control Networks
- Motivated by the cryptography and FW protection against cyberintrusions proposed in our earlier work [8] and the password/FW models proposed in [54], in this paper, scenarios to model intrusions into the digital control networks in HPPs: the cyberattacks launched from the level 4 and the level 5 are modeled. As described in Section II, the cybersecurity level of the ICS architecture is five. The application workstation in level 3 can connect the terminal server (TS) residing in the plant's main control room through the remote desktop connection. However, if the malicious attacker intrudes into the supervisory control from the internet or external network and successfully logs into the TS, i.e., cracks the correct password, he can immediately penetrate the plant control networks and do severe damage. The intrusion scenario is thus illustrated in Fig. 4 by using a GSPN. The attacker from the Internet can intrude into the corporate WAN through the DMZ, if the attacker guesses the correct password then the attacker penetrates the corporate WAN successfully. Communications between WAN and LAN as well as between LAN and Control networks are protected by FWs. The attacker can penetrate the FWs if the malicious packets match the FW access control rules. Therefore, once the FWs are penetrated, the site LAN and the control network are intruded as well. The attacker then penetrates the plant control networks by logging into the TS as described in the scenario [8]. We depict the intrusion scenario by using a GSPN with 2 units of plant control networks, as shown in Fig. 4.
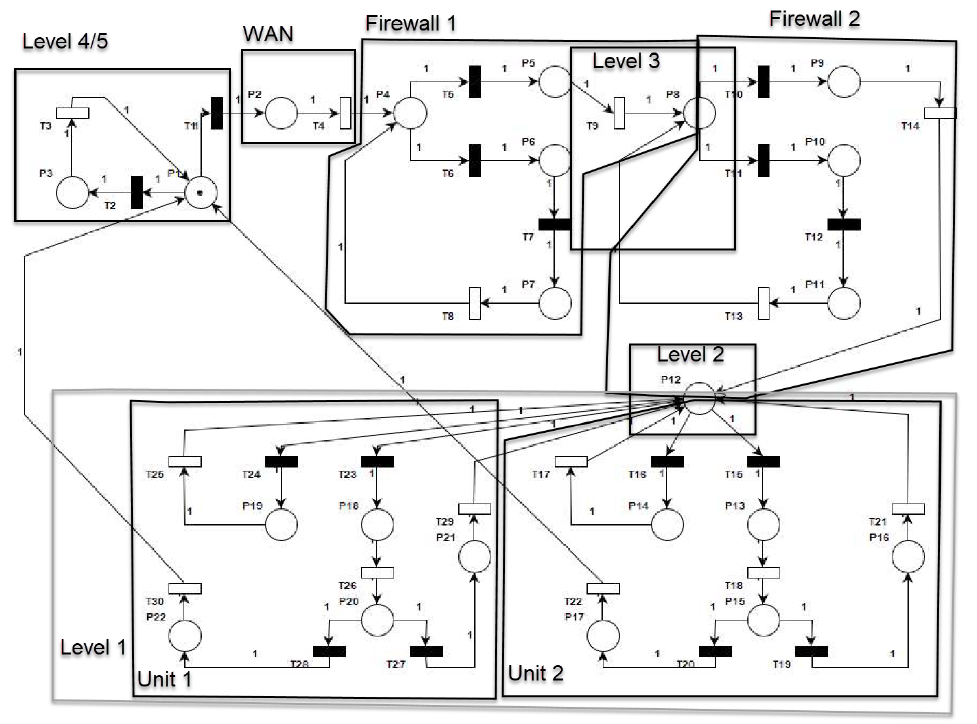 | Figure 4. GSPN Model for ICS Architecture |
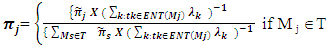
3.2.1. Quantitative Analysis of Scenario
- To quantitatively evaluate the intrusion probability of control networks launched from the enterprise network, we need to define the GSPN:
 | (1) |
 and the set of tangible markings (T) or transient states
  for immediate and timed transitions respectively.
|
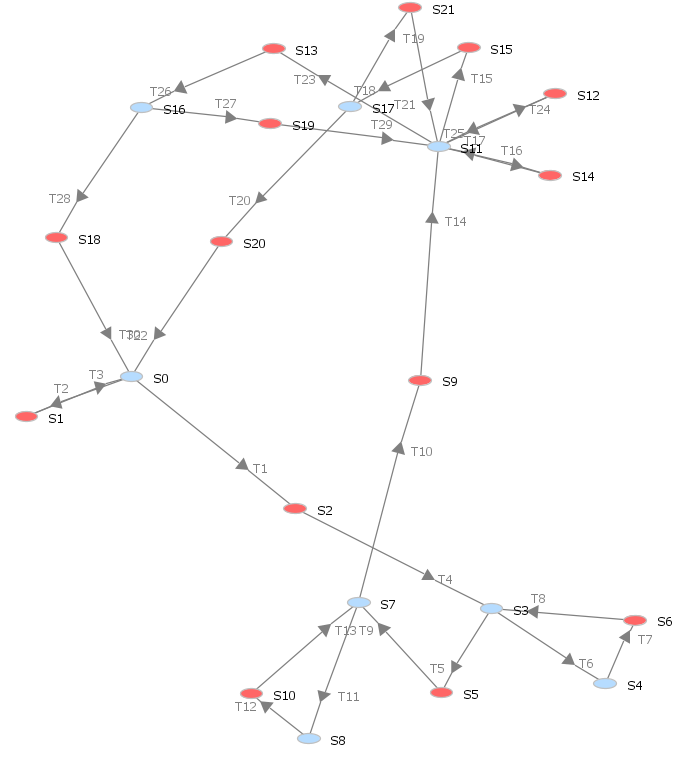 | Figure 5. Reachability graph of modeling intrusions launched from Enterprise Network |
 absorbing states occur first and writing the transition probability matrix P as
 | (2) |
 = 1,
= 1,  E is the
  matrix describing the movement from the transient to the absorbing states, and F is the
  matrix describing the movement amongst transient states. Since it is not possible to move from the absorbing to the transient states, D is the
  zero matrix.By using the values described in Table 2 above, the transition matrix P formed is a 22 x 22 matrix. The dimensions of C, D, E, and F are 8 × 8, 8 x 14, 14 × 8, and 14×14, respectively.The steady-state distribution
  of the embedded Markov chain (EMC) is given by [52]
 | (3) |
 | (4) |
 | (5) |
 | (6) |
 for the tangible markings after solving equations (5) and (6) is as follows:
 = ( π1 = 0.00998, π2 =0.00181, π5 = 0.00544, π6 = 0.19958, π9 = 0.23587, π10 = 0.00544, π12 = 0.02109, π13 = 0.02207, π14 = 0.02207, π15 = 0.02339, π18 = 0.01055, π19 = 0.21092, π20 = 0.01104, π21 = 0.22075.
4. Cybersecurity Standards and the Enhanced Cyberphysical Frameworks
- There are many high-level risk assessment methods (or frameworks) that an organization can use to support the implementation of a cybersecurity risk assessment for the smart grid. Whilst these risk assessment methods are useful, they do not provide specific guidelines for the peculiarities of the smart grid. For example, in the smart grid, cyber-attacks can have physical impacts on the quality of energy supply or cause damage to power equipment. Furthermore, attacks could result in safety-related incidents happening, resulting in injury or loss of life. In this context, it would be helpful to provide specific guidance on how to assess these aspects.
4.1. IEC 62443 (ISA 99)
- Represents a set of security standards for IACS prepared by the IEC technical committee. The goal of these standards is to provide a flexible framework that can address vulnerabilities in IACS and to apply required mitigations systematically. The concrete standard that was analyzed is IEC 62443-3-3:2013 System security requirements and security levels [55] that defines the security requirements for control systems related to the seven requirements defined in IEC 62443-1-1 and assigns system security levels to the system that is being constructed. The IEC 62443-3-3:2013 was selected since it represents the system level standard that can add diversity to the analysis.
4.2. ISO/IEC 27001 and 27002—ISO 27001
- Represents one of the best-known IT security standards that is recognized all around the world. The official title of the standard is ISO/IEC 27001:2013; Information technology—Security techniques—Information security management systems—Requirements [56]. Its supplementary standard is ISO 27002 [57] focuses on the information security controls that organizations might choose to implement and these controls are also listed in Annex A of ISO 27001. Although compliance with ISO 27001 standard alone would not be enough for securing the ICS ecosystem, this standard was selected as one general-purpose security standard that has the requirements that can be applied to different sectors.
4.3. NIST SP 800-53
- Represents the guideline that is published by NIST with the official title: Special Publication (SP) 800-53 Recommended Security Controls for Federal Information Systems and Organizations (Revision 5). It is intended to be used as a toolbox containing a collection of safeguards, countermeasures, techniques, and processes to respond to security and privacy risks [58]. This guideline is versatile enough to be applied for the IT systems as well as ICS systems and even if originally aimed at systems that reside in the US, it is well recognized and applied worldwide. This publication is selected as a guideline representative.
4.4. NERC CIP
- Represents the set of regulations that define how the bulk electric systems (BES) prepare for cyber and physical threats that can affect the reliability of the system. Policies are required for defining, monitoring, and changing the configuration of critical assets, as well as governing access to those assets. NERC is subject to oversight by the US Federal Energy Regulatory Commission (FERC) and governmental authorities in Canada [59]. All North American bulk power system owners, operators, and users must comply with NERC CIP standards. NERC CIP was selected as one of the most respected representatives of the regulatory type of documents and the publication with the most occurrences during the literature review.
4.5. Proposed Enhanced Cyberphysical Frameworks
- The coupling of the power infrastructure with complex computer networks substantially expands the current cyber-attack surface area and will require significant advances in cyber security capabilities. Strong security metrics are necessary to ensure security-based decisions accurately reflect a realistic understanding of cyber risk. NIST [58] specifically addresses this requirement and recommends research in tools and techniques that provide quantitative notions of risks, that is, threats, vulnerabilities, and attack consequences for current and emerging power grid systems.The main goal of the framework is to depict all possible attack paths in the digital control network (smart grid architectures), evaluate the security level of the smart grid through security metrics, and assess the effectiveness of defense strategies. The proposed framework is shown in Figure 6 can be deployed in layer 3.5 of the Purdue architecture. There are five steps in the framework: i) preprocessing, ii) security model generation, iii) visualization and storage, iv) security analysis, and v) changes and updates.
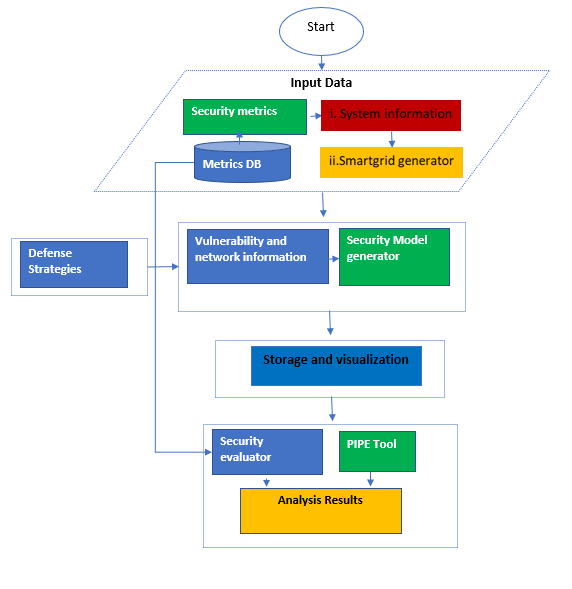 | Figure 6. Proposed Framework |
5. Analysis
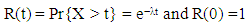
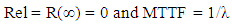
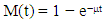
- In this section, we present the dependability analysis method to evaluate industrial control systems with the proposed SPN model. We define three metrics of dependability and provide a detailed method to calculate them. We address the issue of state-space explosion in computing as well. A. MetricsIn this paper, we consider three dependability metrics, i.e. reliability, availability, and maintainability for digital control networks in smart grid. Reliability is used to evaluate the capability to continuously provide services without failures [61]. In detail, it can be defined as the probability that the digital control networks work correctly during the period [0, t], i.e.,
 | (7) |
 | (8) |
 | (9) |
 | (10) |
 | (11) |
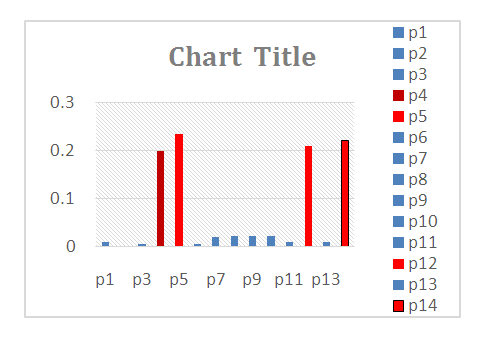 | Figure 7. Steady state probability |
 Solving equation (11), assuming that the initial state (M0) is reliable and not susceptible to any intrusion, then:Ava = 1 – (0.00181 + 0.00544 + 0.19958 + 0.23587 + 0.00544 + 0.02109 + 0.02207 + 0.02207+ 0.02339 + 0.01055 + 0.21092+0.01104+0.22075)
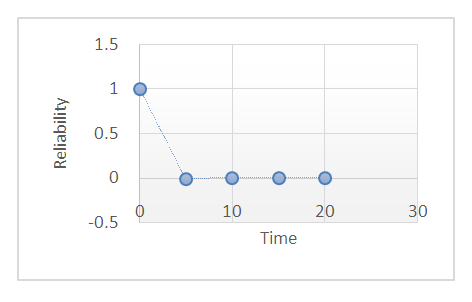 | Figure 8. Steady state availability |
6. Conclusions and Future Works
- In this paper, we discuss the cyber-physical security and dependability issues of digital control systems in safety-HPPs.We also discuss and compare cybersecurity standards, We use GSPNs to model intrusions into digital control networks of HPPs. We then, propose the cyber framework, that conforms to the NIST framework. We also use GSPNs to evaluate the steady-state availability and show that the proposed framework is highly dependable. To reduce the computation complexity, a technique is employed by partitioning the set of transitions into timed and immediate transitions. The results show that mitigation measures are required in the DMZ, level 2, and local area networks in digital control networks of smart grids to enhance resilience to cyber attacks. In future work, we will use the datasets such as failure rates, repair rates, failed login attempts, and firewall rates from a working power plant in Zambia to model resiliency and propose mitigation to improve the RAM metrics. Furthermore, we shall propose an enhanced framework based on GSPNs and Bayesian Nets and compare the results with our current work.
ACKNOWLEDGEMENTS
- I am grateful to the Lord God Almighty for the gift of life and His amazing grace. My family at large especially my little boy Salifyanji, thanks for accepting my absence to achieve this challenging mission. I also wish to acknowledge the guidance of my supervisor Dr. Simon Tembo, the University of Zambia School of Engineering, and all the contributors for making this lonely journey awesome.