-
Paper Information
- Paper Submission
-
Journal Information
- About This Journal
- Editorial Board
- Current Issue
- Archive
- Author Guidelines
- Contact Us
Computer Science and Engineering
p-ISSN: 2163-1484 e-ISSN: 2163-1492
2019; 9(1): 12-19
doi:10.5923/j.computer.20190901.03

Barcode Detection of Video Images by Using MATLAB SIMULINK
 Abstract
 Reference
 Full-Text PDF
 Full-text HTML
Md. Yousuf Ali1, Xuan-De Zhang2, Md. Harun-Ar-Rashid3, Md. Rakibul Islam4
1Department of Computer Science and Technology, Shaanxi University of Science and Technology, Xian, China
2Prof. in the Department of Computer Science and Technology, Shaanxi University of Science and Technology, Xian, China
3Department of Computer Science and Engineering, Mawlana Bhashani Science and Technology University, Tangail, Bangladesh
4Department of Computer Science and Engineering, Daffodil International University, Bangladesh
Correspondence to: Md. Harun-Ar-Rashid, Department of Computer Science and Engineering, Mawlana Bhashani Science and Technology University, Tangail, Bangladesh.
| Email: |  |
Copyright © 2019 The Author(s). Published by Scientific & Academic Publishing.
This work is licensed under the Creative Commons Attribution International License (CC BY).
http://creativecommons.org/licenses/by/4.0/

This paper introduces a strategy for smoothly barcode detection of low-quality video images by using MATLAB SIMULINK. The barcode scheme is used as one of the most useful tools for recognizing information about each product. The system can read barcodes via a video and the system can also record the video with a Simulink. Barcode technology is essential for self-acting identification and is used in a variety of real-time requests. There are different types of code and applications pose available in our daily life. Barcode detection is a constant need for solutions for improving performance. This simulation execution stage is the best required for reducing noise level system. Our intention is to detect the barcode position automatically, smoothly, confidently and strictly with the help of extracted image functions. We have the results and the project has been developed smoothly and perfectly. Our paper focuses on the real-time barcode detection from a low-quality video image with the help of MATLAB SIMULINK.
Keywords: Barcode Detection, Gtin-13 Or Ean-13, UPC, MATLAB, Simulink
Cite this paper: Md. Yousuf Ali, Xuan-De Zhang, Md. Harun-Ar-Rashid, Md. Rakibul Islam, Barcode Detection of Video Images by Using MATLAB SIMULINK, Computer Science and Engineering, Vol. 9 No. 1, 2019, pp. 12-19. doi: 10.5923/j.computer.20190901.03.
Article Outline
1. Introduction
- Since the barcodes were first used commercially in 1966, there should be some sort of industry standard to make the system acceptable to the entire industry. In 1970, Logion Inc. developed the Universal Food Identification Code (UGPIC). The first company to manufacture barcode devices for retail (UGPIC) was an American company. After that, barcodes were first introduced by Tippecanoe Systems, Inc. in 1991. Since then, barcodes have become one of the most popular barcode software applications that allow small businesses to adopt barcode coding with minimal effort. Barcode recognition is required in a variety of real-world applications. All barcodes are a visual, machine-readable data transfer that usually describes some data about the object that carries the barcode. We know that barcodes were originally scanned only by special optical scanners called barcode readers, even though we discovered a barcode without a barcode reader. Later, application software was available for devices that could read images, such as smartphones with cameras. The barcode recognition system that uses image processing has now been developed. For the practical control of the production, storage and distribution of goods, while this is necessary to provide each item with purified information, to accurately identify and store this information in a computer. We believe that the application of barcode system can be used to consider goods as data that helps execute various processes, including storage, sorting, production and distribution. This system which is sensitive to the mechanical recognition of each barcode is needed in large production facilities or large distribution centers where large quantities of products are stirred. Now they are used in several other tasks that are alluded to as automatic identification and data collection (AIDC). The singing ability, catalectic and affordable barcodes make it more convenient and efficient. Barcodes capture huge amounts of data. Although today widely used in healthcare and hospitals for patient identification to drug management. Also, for applications such as tracking, separating and cataloging documents in tracking the organization of species in biology, tracking objects and people, tracking of rental cars, flight luggage, nuclear waste, packages.This paper thus comes with a barcode recognition system that records barcode videos as input and creates an effective and convenient barcode recognition system with the help of image processing and MATLAB SIMULINK. There are different types of barcodes which are used today. These include code 128, code 39, EAN 13, UPC, etc. Although we used these EAN-13 barcodes and also used MATLAB R2016a as software. We deserve the nomination barcode recognition system to have strong capabilities and better performance at poor noise levels [1-2].
2. Different Types of Barcode System
- We know that a barcode is a machine-readable representation of data. It contains information about the object it is associated with. The vast majority of goods sold today have a barcode on them. Although it uses many types of barcode systems in different countries, consumer goods usually use GTIN-13 or EAN-13. Barcode symbolic refers to the technical details of a particular barcode type, such as the width of the bars, character set, coding method, checksum specifications, and so on [Fig 1.1-1.4].
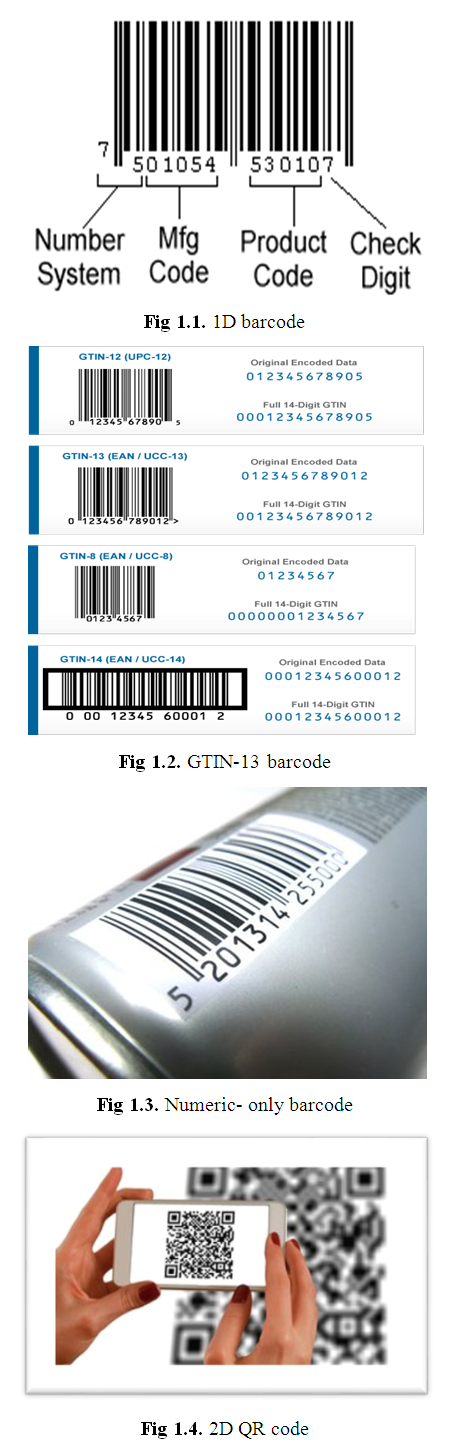 | Figure 1. Several short of barcodes 1D, EAN-13, GTIN-13, Numeric-only barcode, 2D QR code |
3. Algorithm
- The barcode detection example performs a search for selected rows of the input image, called scan lines. Before detection, each pixel of the scan line is preprocessed by converting it to a feature value. The feature value of a pixel is set to 1 if the pixel is considered black, -1 if it is considered white and a value between -1 and 1 otherwise. Once all pixels are transformed, the scanline sequences are analyzed. The example identifies the order and position of the protection patterns and symbols [1]. The symbols are sampled and compared to the codebook to determine the appropriate code.To compensate for different barcode recognition orientations, the example analyzes from left to right and right to left and selects the better match. If the checksum is correct and a corresponding score is higher than a specified threshold compared to the codebook, the code is considered valid and displayed.We can change the number and position of the scan lines by changing the value of the "Line Positions of Scanlines" parameter [5-6].
4. Simulation Diagram
- A simulation platform is a powerful tool for the development and validation of various controllers. Although we have become accustomed to the Computer Vision System Toolbox to create a barcode recognition system that can recognize and interpret a GT1N-13 barcode. The advantages of EAN-13 are that it is not necessary to mark all items with the price and it is also fast and safe because there is no way to make a mistake.The proposed method first converts the RGB values of the input barcode video to intensity values [Fig: 2]. These intensity values are given to the feature calculation block. Feature calculation converts pixel values to features. This is done by assigning values to each pixel. Scan lines can be used to scan barcodes and calculate pixel values from barcode intensity on a given line to a vector. Some lines of the input image are selected and it acts as scan lines. The number and position of the scan lines can be changed. In this paper uses three scan lines. The feature calculation level sets black pixels to 1 and white pixels to -1. Barcode recognition block comes after that [Fig: 2]. This block consists mainly of three modules. They are bar detect, barcode recognition and barcode comparison block. The bar detection block detects black and white bars from the barcode feature signal. It also calculates the bar width specified as input for the next block, i.e. the barcode recognition block. The barcode recognition module calculates all possible barcode values. These values are compared to the codebook generated in the barcode comparison block. Then comes the barcode validation block, which checks whether the barcode is valid or not. The display block displays the valid barcodes and recognizes them. Before displaying the intensity, values are converted back to RGB. The output will be a barcode video that identifies all barcodes [6-8].
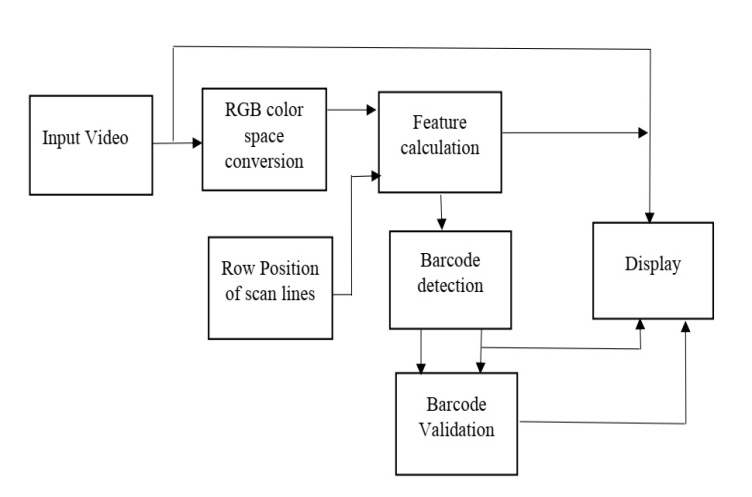 | Figure 2. Barcode detection block diagram by using image processing tools |
5. Simulation Implementations
5.1. Image or Video from File
- The video image is used to import an image from a supported image file. If the image is an M-by-N table, the block creates a binary or intensity image, where M and N are the number of lines and columns in the image. If the image is an M-by-N-by-P table, the block creates a color image, where M and N are the number of lines and columns in each color plane, P. For blocks of blocks of blocks of video processing blocks and images to display video data correctly, the floating-point pixel values must be between 0 and 1 with an accuracy. Using the Image Signal setting to specify how does the block generate a color video signal [7,10].
5.2. Color Space Conversion
- The Color extents transformation block in metamorphose color instruction between color positions. Using the transformation parameter to particularize the color extents between the converting images. The options are R'G'B' to Y'CbCr, Y'CbCr to R'G'B', R'G'B' to Intensity, R'G'B' to HSV, HSV to R'G'B', sR'G'B' to XYZ, XYZ to sR'G'B', sR'G'B' to L*a*b*, and L*a*b* to sR'B'B*.• If the input is uint8, YCBCR is uint8, where Y is in the range (16 -235) and Cb and Cr are in the range (16- 240). • If the input is double, Y is in the range (16/255- 235/255) and Cb and Cr are in the range (16/255- 240/255) [7,10].
5.3. RGB-space
- RGB color space, individually color is recount as an integration of 3 main colors which are red, green and blue. This color space can be represented as a 3D matrix with the main colors on the axis [Fig. 3]. The values for the main colors range from 0 to 1 in RGB color space model. Each color is encoded with three values red, blue, and green. In this color space, an imported image on a computer is converted to 3 matrices with values per pixel for representing main color [7,10].
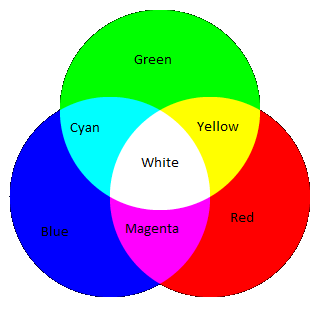 | Figure 3. RGB color mixing space |
5.4. Feature Calculation
- The function block calculates the mean values and the standard deviation for the pixels in the barcode range. The feature function converts pixels on a specific line into a feature vector parameter. We calculated the feature vector for all pixels in the scan lines. We estimated the range of pixel intensity values in the barcode range. A pixel is classified as black if its value is f-low or less. Black pixels are set to 1. Another pixel is classified as white if its value is f-high or greater. White pixels are set to -1. Values greater than f-high and values less than f-low are saturated. Such as f_high = f_mean + f_std * RATIO_STD;f_low = f_mean - f_std * RATIO_STD;The remaining pixels are set proportionally to values between -1 and 1. Next to h is a Gaussian filter. It is used to smooth the image history that identifies the barcode area [7-10].
5.5. Barcodes Detection
5.5.1. Bar Detection
- This function is "BAR" detection and bar of barcode feature signal. Firstly, tries to find a black bar. If the black bars do not exist, then it will be zero. Then a contiguous sequence of pixels with zero or positive feature value is considered a black bar. Secondly, we found a white bar. Similarly, a contiguous sequence of pixels with a negative feature value is considered a white bar [7,10].
5.5.2. Detection
- Actually, the detection method gives the sequence of indexes to barcode protection bar parameters. And also checks the maximum number of protective pattern separators and the maximum number of sequences of protection patterns of constant values. Such as,• Count of both black and white bars.• Calculate sequence and its length.• Skip the first bar if it is invalid.• Find out all possible separators.
5.5.3. Codebook Generator
- The CODEBOOK function generates the codebooks for the GTIN-13/EAN-13 or UPC-A. According to the codebook for the first digit encoded in the L/G patterns and for the other 12 digits 0 to 1. Then convert the codebook of symbols to digits [7,10].
5.5.4. Barcode Recognition
- The barcode recognition block picks up the barcodes and attempts to match the barcode with the number of pixels generated from bar detection. Egotistic scanline orders from left to right to detect digits 8 to 13. Similarly, from right to left, detects scanline order from digits 8 through 13. Then the block used the scanline direction (left to right or right to left) to find the potential match for digits 2 through 7, although there 1 and 2 is I/O port numbers, 1 is F and 2 is threshold for bar width variance in [Fig.4]. Finally, the block recognizes the strings, digits and bars, then it could be recognized a complete barcode [7,10].
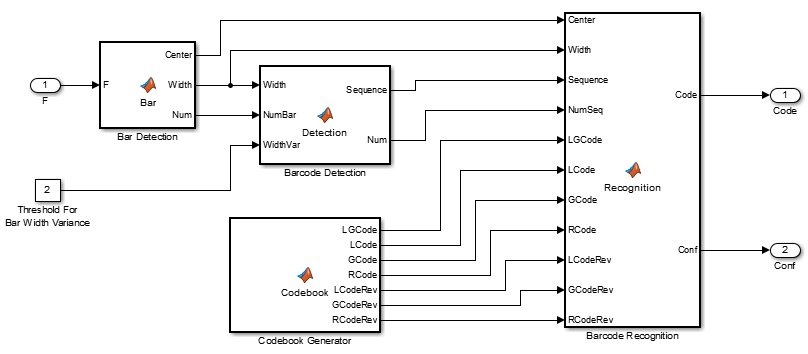 | Figure 4. Barcode recognition/ detection block |
6. Barcodes Validation
- Barcode authentication is the barcode categorize function these criteria that will make able to interoperability between barcode stamping and scanning systems, so that both industries and individuals rely on symbols to print successfully and regardless of where they were manufactured or treated. But this barcode recognition block calculates by taking the straight elements and multiplying them by three. Then add the sum of the odd elements with the sum of the straight elements. It will check the digit and also check which barcode is valid. The last digit is the check digit "7", and if the other numbers are correct then the check digit calculation must produce 7 shown in [Fig.5]. If it is checked smoothly and trustworthily, then the habit on the barcode may be displayed on the screen [7,10].
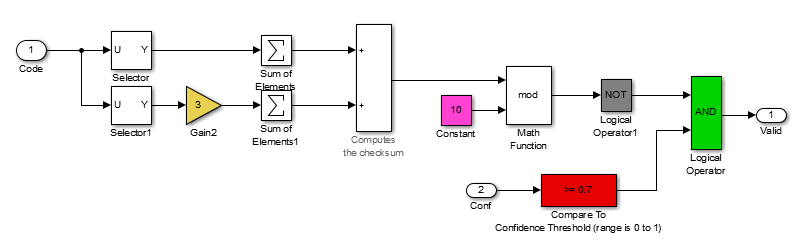 | Figure 5. Barcode validation block |
7. Video Display
- The input image comes from a constant image block. The video display block sends video data to a DirectX-supported video output device or camera. Alternatively, we can send the video data to a separate monitor or display the data in a window on our own computer screen shown in [Fig.6]. We used the Pts port to specify the appropriate shape coordinates. And also defined the color value of the shape's border. As well, choose to fill that shape and specify its opacity. The input into the Pts port must be an M-by-2L matrix in which each row specifies a different polyline. Each line must be (x1, y1, x2, y2, xL, yL) shape, which specifies the indentation and downstream points in recurrently order [7-10].
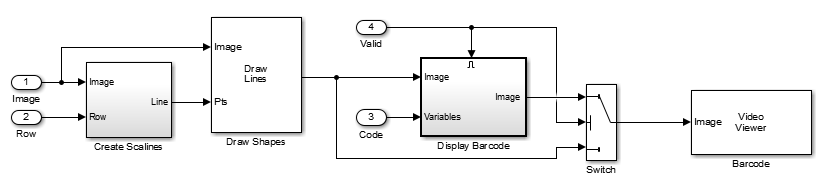 | Figure 6. Video display |
8. Experimental Results
- The proposed barcode detection with MATLAB SIMULINK is more perfect than the existing methods [Need Reference]. We have developed the simulation model of sub blocks of barcode recognition consisting with RGB block, barcode recognition block, barcode validation block and display. There were some issues that need to be counteracted in order to develop this barcode detection system with MATLAB SIMULINK. They are scanlines that have been used to detect barcodes that appears in red. If an EAN-13 is correctly detected and validated, the code appears at the top of the image. The barcode recognition system is expected to detect barcodes in each direction. So, we illustrated how to make a simulation and we got the result shown in [Fig.7,8].
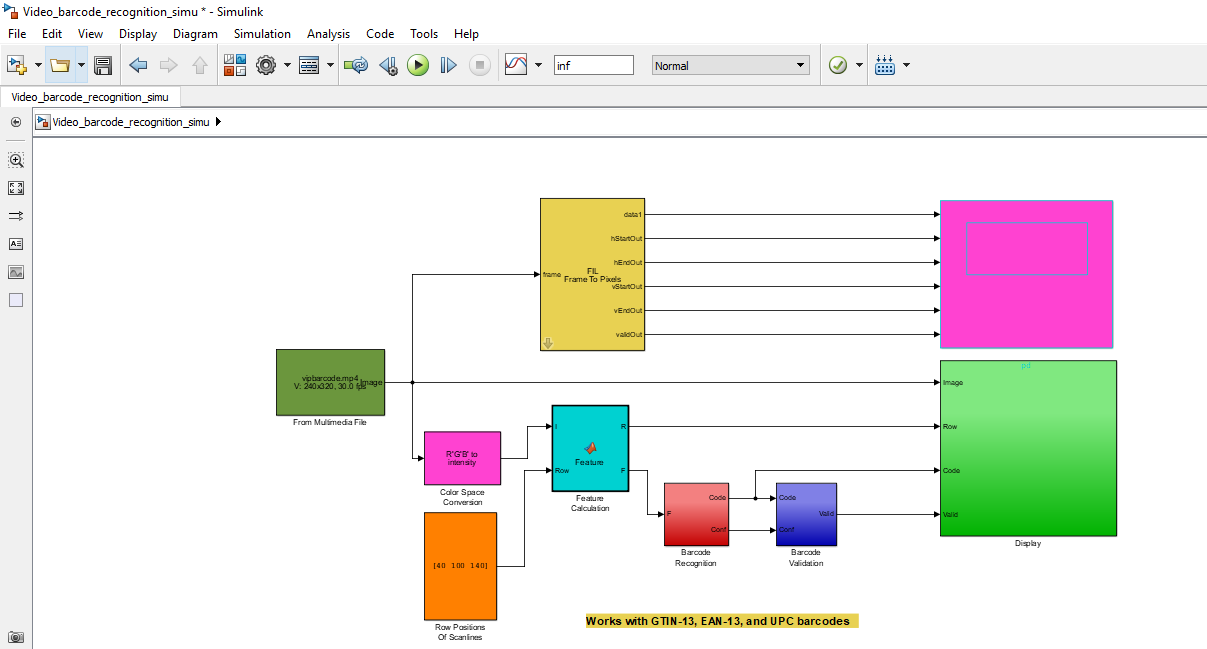 | Figure 7. MATLAB Simulation with Result |
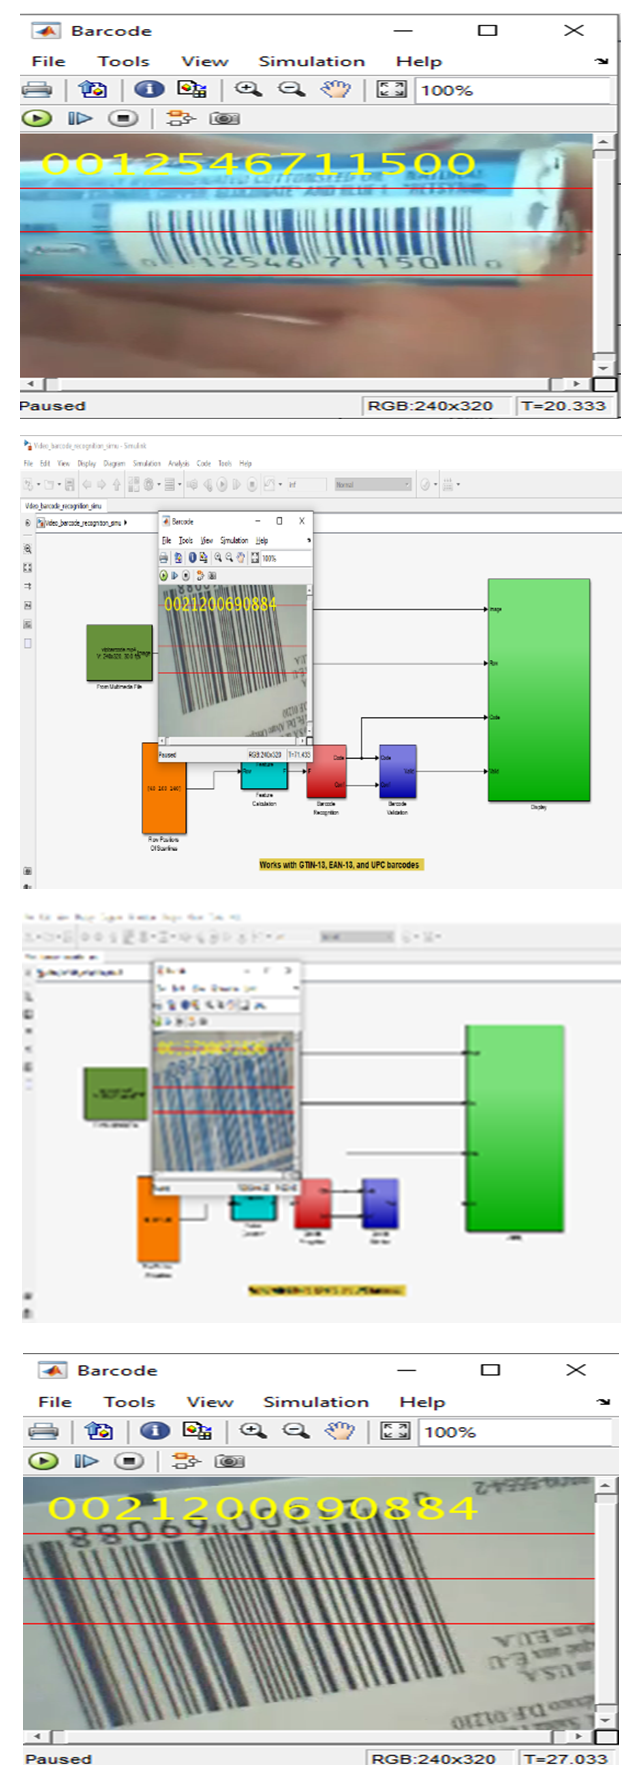 | Figure 8. Experimental Results |
9. Discussion
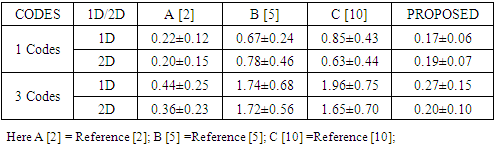
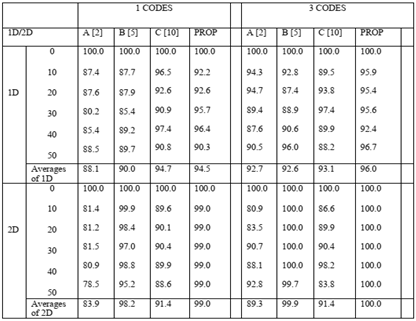
- Here we come to the discussion about barcode detection and simulation, we set out how effective the implemented algorithms and programs are on video images with different properties, and also compare their runtime. We have used the algorithm and program for the coefficient and expected result with the system for measure the digits of the real and recognized barcode region [2]. This not only measures the success of detection, but also takes into account the delimitation accuracy of the methods. The performance of the algorithms does not appear to depend on the strain applied in the test video images and does not appear to be prone to rotation.We can conclude that algorithms are able to effectively locate barcodes. This program and algorithm method are fast, but it loses efficiency when there are multiple barcodes in the Simulink and a little noise is also present. However, this result is better accuracy than another implementation [2,5,10].Our proposed algorithms are also very fast. In most cases, faster methods find barcodes less accurate or not at all, as if loss of accuracy where the price of speed gain. In our case, however, speed does not involve a significant cost of accuracy. From the evaluation output, we can conclude that the proposed method has super best running efficiency for all test video images (only now our version runs faster than before), and in many cases it also shows the best accuracy. The weakness of the method occurs when the images are very loud or when there are areas of images that resemble a barcode.An important aspect is also the efficiency of the methods for example the processing time. Table 1 shows the execution time of the recognition methods for images with 1 or 3 barcodes. Here we can easily see the significant differences between the different approaches.
|
10. Parallelism
- Simulations merely can be used as steering for the prosperity of modern computational tools. So, we have created a barcode detection from video image with MATLAB SIMULINK. This system is convenient for selling products. The method can be used by anyone easily and perfectly. These finding corroborations have the greater accuracy of the proposed method than the others [2]. Fig.8 shows the result of the barcode detection performance of the proposed method. Therefore, we seem that the type requires special programming for transferring the input data to the application program. In point-of-sale management, barcode systems can provide detailed, up-to-date information about the business, accelerate decisions and have more confidence. For example:• Fast selling items can be visualized rapidly automatically and perfectly.• Slow-selling items can be recognized to prevent inventory build-up.• Historical data can be used to accurately predict seasonal fluctuations.• Items can be regenerated on the shelf to reflect both sales prices and price increases.• No chance makes a mistake any digit of barcodes.
11. Conclusions
- This paper proposed smooth barcode detection of video images with MATLAB SIMULINK as well as image processing. It is expected that the system has a high efficiency as it can remove unwanted noise through this SIMULATION. This simulation can detect barcodes from any direction. Here, video images of barcodes are used as input. Input images are EAN-13 and UPC. Although we have effectively detected EAN-13 and UPC codes with minimum noise, this increases performance. So, we seem that the system is working smoothly and perfectly. So, it is the best and different system than others [2,5,10].The paper will continue until the system is fully functional, along with an additional feature that can help this system in the future. In order to achieve greater efficiency for this paper, the following proposal for future progress is used. For future system development, it is suggested that the system should also include a slider so that the user can control the barcodes of the image captured by the camera.
12. Future Work
- The focus will be to implement of the object tracking and image processing, as it can avoid high investments in industrial control computers while maintaining improvement of computing power and optimized system structure. The hardware implementation would make it possible to use the project in real time under practical conditions.
References
| [1] | Palmer, Roger C. The bar code book: reading, printing, and specification of bar code symbols. Helmers Pub., 1989. |
| [2] | Lei, F., Yang, Z., Lei, H., He, Y. and Xie, L., 2011, July. Embedded implementation of barcode recognition system in ammeter image. In 2011 International Conference on Multimedia Technology (pp. 5390-5393). IEEE. |
| [3] | “Barcode.” Wikipedia, the Free Encyclopedia. Wikimedia Foundation, Inc. 8. Dec. 2011. Web. 9. Dec.2011. |
| [4] | “Universal Product Code.” Wikipedia, the Free Encyclopedia. Wikimedia Foundation, Inc. 2 Dec. 2011. |
| [5] | Tekin, E. and Coughlan, J., 2009, May. A Bayesian algorithm for reading 1d barcodes. In 2009 Canadian Conference on Computer and Robot Vision (pp. 61-67). IEEE. |
| [6] | Zhongqing Yu. Application Research on Embedded Barcode Recognition System Based on Image Processing[D] Chinese Marine University, 2007.Web. 2 Dec. 2011. |
| [7] | Pavlidis, T., Swartz, J. and Wang, Y.P., 1990. Fundamentals of bar code information theory. Computer, (4), pp.74-86. |
| [8] | Tutorials on Computer Vision and Code Generation: https://www.mathworks.com/academia/student-competitions/tutorials videos.html. |
| [9] | MATLAB Onramp: https://matlabacademy.mathworks.com/ Simulink Onramp: https://in.mathworks.com/learn/tutorials/simulink-onramp.html. |
| [10] | Shams, R. and Sadeghi, P., 2007, April. Bar code recognition in highly distorted and low-resolution images. In 2007 IEEE International Conference on Acoustics, Speech and Signal Processing-ICASSP'07 (Vol. 1, pp. I-737). IEEE. |