-
Paper Information
- Paper Submission
-
Journal Information
- About This Journal
- Editorial Board
- Current Issue
- Archive
- Author Guidelines
- Contact Us
Computer Science and Engineering
p-ISSN: 2163-1484 e-ISSN: 2163-1492
2018; 8(2): 30-39
doi:10.5923/j.computer.20180802.03

Dynamics of Technology Transfer for Innovation Processes in a Constrained Resource Settings: The Promise of Data Analytics and Computer Simulations
 Abstract
 Reference
 Full-Text PDF
 Full-text HTML
Peter Kiarie1, Mwangi Henry1, Chunming Rong2
1Faculty of Computing and Information Management, KCA University, Kenya
2Faculty of Science and Technology, University of Stavanger, Norway
Correspondence to: Peter Kiarie, Faculty of Computing and Information Management, KCA University, Kenya.
| Email: |  |
Copyright © 2018 The Author(s). Published by Scientific & Academic Publishing.
This work is licensed under the Creative Commons Attribution International License (CC BY).
http://creativecommons.org/licenses/by/4.0/

Technology transfer, defined as the movement of scientific inventions from an enterprise to the market place, is often a difficult and frustrating process. Stakeholders in this area of study are usually at different levels of understanding due to many factors involved and speak different languages. There are number of problems associated with technology transfer processes in constrained resource settings such as lack of researchers in specific domains, motivation, bureaucratic climate, inability to make effective public investments, funding and inappropriate infrastructure, culture among many others. This research explores the above problems and others discussed by varies researchers in technology transfer and particularly those in Technology-Organization-Environment (TOE) framework using Data analytics and System Dynamics modeling approaches. Data analytics will facilitate in developing a more promising and data rich System Dynamics model. The study will shed light on technical and social factors that lead to formulation of policies which enable accelerated technology transfers in constrained resource settings.
Keywords: Technology Transfer, Data Analytics, System Dynamics, Modeling, Constrained resource setting
Cite this paper: Peter Kiarie, Mwangi Henry, Chunming Rong, Dynamics of Technology Transfer for Innovation Processes in a Constrained Resource Settings: The Promise of Data Analytics and Computer Simulations, Computer Science and Engineering, Vol. 8 No. 2, 2018, pp. 30-39. doi: 10.5923/j.computer.20180802.03.
Article Outline
1. Introduction
- Technology transfer has no specific definition and is not the same process nor perception for different stakeholders such as the universities, corporations, research labs and developing countries. For each stakeholder, roles and interests are different. For example, universities will talk of knowledge sharing while corporations will think of gaining competitive advantage. Basically, in all cases, there exist movement of an object, process or knowledge from point of origin to point of use. A lot of studies has been done on this area and there exists a lot of challenges and this study address some of these. Maskus (2012) in his studies alludes that technology transfer is becoming an increasingly important challenge for countries with constrained resource settings. Further studies by Marjanen (2003) on technology transfer says that it is both time consuming and risky process due its complex processes, which involves many, and varying factors. Technology transfer especially in IT and data is complex, risky and time-consuming (Nahar et al., 2006). Lin et al. (2004) claims that other factors that may affect the technology transfer are business practices, policies and regulations, economic situation, political system, and tele-communication infrastructure. Note that most of developing countries are focusing on development of these infrastructure or upgrading them to make economic sense. Organizational readiness for change (ORC) is a theory for organizational change and entail collective behavior change in the form of systems redesign that is, multiple, simultaneous changes in staffing, work-flow, decision making, communication, and reward system (Armenakis' et al, 1993). He further posit that readiness for change is the cognitive precursor to the behaviors of either resistance to, or support for, a change effort while Lehman et al. (2002) emphasized that ORC is a set of general factors that may be necessary but not always sufficient for change to occur. Lehman et al (2002) studies developed an instrument to measure the organizational readiness for change based on four dimensions: Ÿ Motivation for change. Ÿ Institutional resources of the program.Ÿ Personality attributes of the staff.Ÿ Organizational politics. Lehman et al (2002) further emphasize that motivational factors include program needs, training needs, and pressures for change, while program resources are evaluated concerning office facilities, staffing, training, equipment, and internet. Organizational dynamics include scales on staff attributes which led to the emergence of a variety of cultures. Cultures often influence how technology is used in the technology transfer process. The beliefs, ideas, and customs that are shared and accepted by people in a society are based on cultural variables. Cultures often influence how technology is used in the technology transfer process. This implies that technologies must be tailored to fit the culture of end users in order for technology transfer to be successful. These issues have led to several causes of problems in technology transfer.Numerous studies on innovations has been done by using Technical-Organization-Environment (TOE) framework. TOE framework explains how firms adopts and implements technological innovations and it is influenced by the technological, organizational and the environmental factors. (DePietro, Wiarda, & Fleischer, 1990). The technological factors includes the internal and external technologies that are required by the firm such as equipment or processes. Organizational factors looks at characteristics and resources of the firm such as firm’s size, managerial structure, human resources, amount of slack resources, linkages and on. Environmental factors includes the size and structure of the industry, the firm’s competitors, the macroeconomic context, and the regulatory environment (DePietro, Wiarda, & Fleischer, 1990).This research aims to fill the existing gaps by addressing key issues mentioned above and particularly Infrastructure, Cultures of users, Motivation and then incorporate the factors discussed in TOE framework. Integration of all these factors make technology transfer complex and that’s why linear approaches have failed. System Dynamics has been applied to solve this problem and data analytics has been incorporated. The system dynamics solves complex problems, with inter-related factors and it provides the causal structure for the interpretation of social data which is theory-rich modeling. With the advent of big data, system dynamics requires data science techniques to obtain useful input data, for analysis and interpretation. This research has tried to bridge these two approaches to come up with a promising data-rich technology transfer model and through the model, gain a better understanding of effective and faster technology transfer factors. The key motivation in using this model to improve decision making and policy formulation in technology transfers in future.
2. State of Practice in Technology Transfer
- According to Choi (2009), some major issues should be considered for efficient and effective technology transfer such as conceptions of technology, technological activity and transfer, communication channels, factors affecting transfer, and models of transfer. He further alludes that a well-developed model of technology transfer could be used as a framework for facilitating a technology transfer process. Technology transfer implies the movement of physical structure, knowledge, skills, organization, values, and capital from the site of generation to the receiving site (Mittelman & Pasha, 1997). The invisible aspects of technology, such as knowledge, skills, and organization, might be much more critical than the physical aspects for the successful transfer of technology. According to Frey (1987) technology can be an object, a process, or knowledge that is created by human intention. In most cases, technology tends to be the integration of all three components: object, process, and knowledge. Therefore, a provider of technology should try to transfer the integration of all components that make up that technology, not just one component.The case studies below shows that technology transfer is not the same process neither the same perception for everybody. Universities, corporations, federal labs, and developing countries have different roles and interests in technology transfer. For example, universities, as a provider of technology, view technology transfer as a means for serving a community through knowledge sharing. On the other hand corporations regard it as a way to obtain competitive advantages through performance improvements. The case studies shows many varying and interdependent variables that affect effective technology transfer.
2.1. Traditional University Technology Transfer Model
- According to Eckl (2012), models are not only useful for the description and understanding of complex structures, but they also serve as a starting point for the analysis of correlations. In particular, a well-developed model of technology transfer could be used as a framework for facilitating a TT process (Choi, 2009). According to Siegel et al (2004), the traditional model of university technology transfer (UTT) was constructed as a synthesis of dominant paradigms and the extant literature related to technology transfer within the academic and professional landscape. The UTT demonstrates a linear model, and it begins with the process of discovery by a university scientist (Siegel et al., 2004). The term scientist is used as a descriptor for a university researcher. The scientist uses the grant to conduct research and purposely or serendipitously discovers a new product or process technology that might have market potential, thus beginning the technology transfer process. In reality, industry might initiate a partnership with a university. Etzkowitz (2003) refers to this as reverse linearity, which starts from commercial and societal needs; that is, firms seek academic resources. Reverse linearity connects the university to external problems, sources of knowledge, and firms seeking academic resources (Etzkowitz, 2003).UTT model does not accurately capture the complexities of technology transfer in practice. We have weaknesses and misrepresentations in this model such as inaccuracies (e.g. linearity and over implication) and inadequacies (e.g. organizational culture). Siegel et al (2004), suggest that the traditional model understates the complexity of the technology transfer process, and they propose that when university inflexibility is high, university scientists will circumvent formal technology transfer processes and rely more heavily on informal commercialization and knowledge transfer.
2.2. Diffusion of Innovation
- According to Rogers (2003), diffusion is the process by which an innovation is communicated through certain channels over time among the members of a social system and by which alteration occurs in the structure and function of a social system as a kind of social change. He further alludes that diffusion is critical process for the practical use of innovation and reinvention i.e. diffusion plays a major role in helping the adopters fully take advantage of an innovation and to modify that innovation. Thus, the comprehension of the major issues in the diffusion process is essential for making technology transfer successful. Diffusion consists of four key elements: innovation, communication channels, time, and a social system (Mahajan & Peterson, 1985; Rogers, 2003). These four elements are crucial in studying diffusion. According to Rogers (2003), innovations have five common characteristics that help to explain the rates of adoption; these can be relative advantage, compatibility, complexity, trialability, and observability. He argued that the greater relative advantage, compatibility, trialability, and observability and the less complex the perceptions of an innovation are, the faster the rate of adoption. Change agents need to use this implication to speed up the rate of diffusion and to make the potential adopters recognize the need for change.According to Choi (2009), information exchange can be in a variety of channels in diffusion process of innovations, such as mass media, interpersonal channels, or interactive communication. More effective communication occurs when two or more individuals are similar (i.e., homophilous). However, some degree of heterophily, the degree to which two or more individuals who interact are different in certain attributes, is usually present in communication about innovations (Rogers, 2003). Time affect the rate of adoption in three different ways. First, it about the innovation decision process that deals with knowledge, persuasion, decision, implementation and confirmation. The second one is innovativeness of the individual. These are: Ÿ Innovators 2.5%, Ÿ Early Adopters 13.5%, Ÿ Early Majority 34%, Ÿ Late Majority 34% Ÿ Laggards 16%. Innovators (First 2.5%) tend understand complex technologies and have available funding. They are networked and can venture in different fiends and can cope with uncertainties. Technology transfer researchers should note that for complex technologies, this group does not affect the technology transfer. Early Adopters (Next 13.5%) are more acknowledge and conversant with the technology than innovators. It is from this group that the technology transfer researchers expect to locate opinion leaders. These group is also venturesome. The group is skeptical to recognize good technologies from poor ones. Opinion leaders have more influence on the technology transfer than persons in any other group therefore researchers’ attempts to persuade to adopt. Early Majority (Next 34%) this group have a better interconnectedness within the system's interpersonal networks. The group have a long period of deliberation before making an adoption decision. Note that this is the group that interact with users frequently who hold the position of leadership. Late Majority (Next 34%) this group is skeptical and very cautious not to risk their limited resources in high-end technologies. The group adopt due to economic and social necessity in the market. Laggards (Final 16%) this group have very few resources to risk and do not trust any new technology or innovations. The group is slow to implement because they have limited financial resources. It is therefore certain that complex and new technologies creates economic advantages to different groups. Funding is required for technology transfer and in limited resource settings income inequalities is evident. This means that technology transfer is a social and economic problem where people who most need the benefits of an innovation generally are the last to adopt it. Social system is a set of related unit that are in joint problem solving and has one common goal. This social system has a boundary where an innovation is accepted or rejected. Behavior patterns or norms are the order of the day and opinion leader are the change agents. The DOI has some weaknesses as well. One of the weaknesses of this model is that it is linear and source dominated. The theory also underestimates the power of media. They mainly create awareness of the innovations. It assigns a very central role to different types of people critical to the diffusion process.
2.3. Technology-Organization-Environment Framework
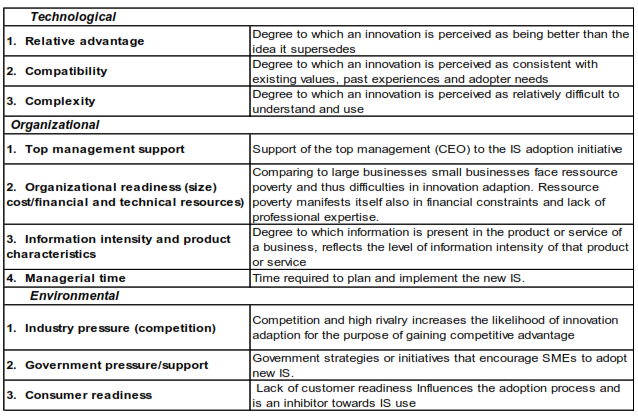
- DePietro, Wiarda, & Fleischer (1990) created technology-organization-environment (TOE) framework for explaining factors that influence technology transfer and its likelihood. The TOE framework has a solid theoretical basis and the potential for application in the IS adoption (Oliveira and Martins, 2010). It is developed by DePietro et al (1990) and it specifies 3 types of factors that influence the adoption and organizational usage of technological innovation. TOE describes the process by which industry adopts and implements technological innovations through technological context, the organizational context, and the environmental context (DePietro et al, 1990). The technological context includes the internal and external technologies that are relevant to the firm. Technologies may include both equipment as well as processes. The organizational context refers to the characteristics and resources of the firm, including the firm’s size, degree of centralization, degree of formalization, managerial structure, human resources, amount of slack resources, and linkages among employees. The environmental context includes the size and structure of the industry, the firm’s competitors, the macroeconomic context, and the regulatory environment (Depietro et al, (1990). Table 1 shows the variables identified from TOE framework.
|
3. Simulation and Modeling Methodology
3.1. Introduction
- Bandini et al (2009) eludes that computer simulation for predictive and/or explanatory research in complex systems, is equated to the use of a computational models that improves the understanding of a system's behavior and evaluate strategies for its operation or implementation. In this study we discuss some common models namely Agent-Based Modeling, Descriptive Event Modeling and System Dynamics Modeling.
3.1.1. Agent Base Modeling
- Agent-Based Modeling (ABM) is one of the models used for complex, non-linear and real world problems. According to Bandini et al (2009), ABM approach considers that the problem at hand as the results of interactions between autonomous and independent agents or entities. An agent is an encapsulated computer system situated in some environment and capable of flexible, autonomous action in that environment in order to meet its design objectives (Wooldridge 1997). ABM is a recent simulation modeling technique that consists of modeling a system from the bottom up, capturing the interactions taking place between the system’s constituent units (Bonabeau 2008). The further alludes that such a bottom up approach enables users to describe and predict emergent phenomena. According to Laskowski et al, (2011), ABM models are modeled as a collection of agents (people and objects) and their individual characteristics, behaviors and interactions. They further alludes that, agents are autonomous decision making entities able to assess their situation, make decisions, and compete with one another on the basis of a set of rules. Laskowski et al (2011) states that ABM’s conceptual depth is derived from its ability to model emergent behavior and its ability to exhibit a complex behavioral phenomenon. In summary, ABMs are suited to system modeling in which agent behavior is complex, nonlinear and stochastic.
3.1.2. Descriptive Event Modeling (DEM)
- Discrete event simulation (DEM) describes an event-oriented or activity-oriented methodology of simulation where events or activity may happen at any time. Chronological sequence of events and activities are represented in the system. Each activity or event occurs at a certain time and marks a change of state. Event graphs are good indicators of how event-oriented methodology can be represented graphically. Event graphs are comprised of: 1) A set of states (i.e., variables that changes in accordance to events that happen within the model). 2) A set of parameters (i.e., a set of design-time values used by the model for determining the model’s behavior). 3) A set of events the associated state changes that occur upon the occurrence of the event. 4) Scheduling and cancellation edges between events and their associated scheduling condition and the simulated time at which the event occurs. DEM is a non-continuous type of simulation.
3.1.3. System Dynamic Modeling
- System dynamics (SD) is a computer-aided approach to policy analysis and design (Richardson, 1991). He further eludes that SD applies to dynamic problems arising in complex social, managerial, economic, or ecological systems i.e. any dynamic systems characterized by interdependence, mutual interaction, information feedback, and circular causality. SD methodology uses system thinking methods and on several relationships that link the parts of the whole making it a complex system. SD is an approach to understanding the non-linear behavior of complex systems over time using stocks and flow diagrams, feed-back loops, table functions and time delays (Forrester, 1961). It is a methodology and mathematical modeling technique to frame, understand, and discuss complex issues and problems and is currently being used throughout the public and private sector for policy analysis and design (Forrester, 1961).
3.1.4. Conclusions on Modeling and why SD
- As an alternative to time step approximation, discrete event modeling (DEM) may be used to implement the SD model through discretization of stocks or flows within the system and identifying events that change these quantities. The quantization of continuous variables in SD into discrete quantities may introduce quantization errors. Emergent behavior seen in ABM can occur in SD through the interactions between equations (Tan 2014). He further eludes that due to the compactness of SD equations, it feels less intuitive to develop models using SD than it does to develop models using ABM. Technology transfer is a complex process and so an explanation and general insights regarding the behavior of its complexity and can be elucidated by a methodology that supports such. Decision rules and policies can be varied as they are formulated during simulation as opposed to being specified as constant thus incorporating feedback effects of past relation. Both linear and non-linear relationships as well as physical and information delays can be incorporated in the model. Additionally, soft behavioral relationships for which adequate statistical data may not be available can be modeled. This makes SD quite adequate in modeling technology transfer as explanations that yields from simulations can be used to foster and further understanding and insights. SD approach starts with defining problems then mapping proceeds to modeling stages and finally to model policies.
3.2. Data Analytics and Python
- The SD approach provides the causal structure for the interpretation of social data which is theory-rich modeling. With the advent of big data, system dynamics requires data science techniques to obtain useful input data, for analysis and interpretation and that why we are incorporating data analytics in this research to bridge this gap. Branch of the data analytics, known as Predictive analytics can make predictions about data and uses various methods from data mining, statistics, modeling, machine learning, and artificial intelligence to analyze current data. The patterns found in historical and transactional data can be used to identify risks and opportunities for future. By successfully applying predictive analytics the enterprise can interpret big data for the right benefit. One common goal in predictive modeling is to accurately predict an outcome value for a new set of observations. This goal is known in predictive analytics as prediction (for a numerical outcome) or classification (for a categorical outcome) (Shmueli and Koppius, 2010). Predictive analytics support the extraction of information from large data sets and from a variety of data structures. Python is cited as the language for data analytics in most studies. It is an expressive language and has a variety of available libraries and is relatively easy to learn. Some important libraries that are freely available to Python users include SciPy for scientific computing, pandas for data and array analysis, and scikit-learn for machine learning. Houghton (2014) states that SD models can be combined with Python-based analysis using multiple methods and as an example, PySD allows SD models to be written directly in Python. Another approach is to take a model developed on a desktop software program and simulate it from Python. PySD is a tool designed to facilitate the integration of SD models and data science by bringing models created with traditional SD modeling platforms into rapidly developing ecosystem of Python data science tools (Houghton, 2014).
3.3. Integration of SD and Data Analytics Model
- The integration of data analytics and system dynamics will give as a diagram as shown in Figure 1 below where they complement each other.
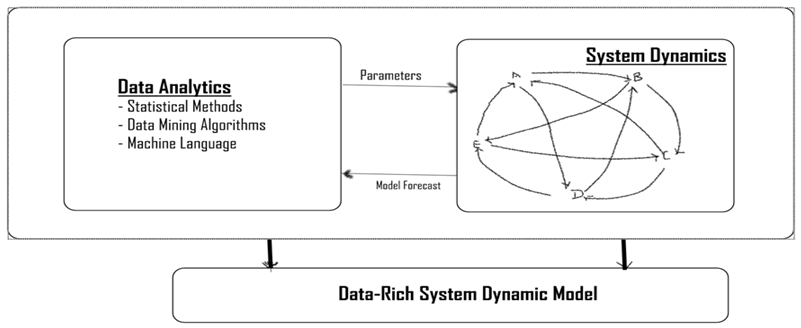 | Figure 1. Integrated SD and Data Analytics Model |
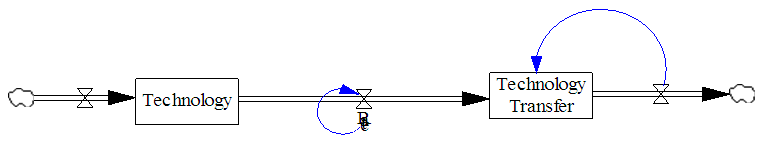 | Figure 2. Technology Transfer Model (illustration file: technologytransfer.mdl) |
4. Variables that Affect Technology Transfer
- In this study, the research model incorporates technological, organizational, and environmental contexts as important determinants of technology transfer in limited resource setting. The technological factors refer to internal and external technologies that exist in an organization. Organizational factors refer to several indexes regarding the origination, such as firm size and scope, centralization, formalization, and complexity of managerial structure and the quality of human resources. Environmental factors refer to the industry, competitors and government policy or intention. Relative advantage will be positively associated with technology transfer. Rogers (1983) defined relative advantage as the degree to which a technological factor is perceived as providing greater benefit for firms. Complexity will be negatively correlated with the technology transfer. Complexity can hinder technology transfer and therefore complexity negatively affects it. Compatibility will be positively correlated with the technology transfer. Compatibility refers to the degree to which innovation fits with the potential adopter’s existing values, previous practices and current needs (Rogers, 1983). When technology is recognized as compatible with work systems, organizations are usually likely to consider its adoption. Top management support will be positively correlated with the technology transfer. Top management support and firm size. The organizational context includes attributes such as size, quality of human resources, and complexity of the firm’s managerial structure (Oliveira and Martins, 2010). Top management support is critical for creating a supportive climate and for providing adequate resources for the adoption of new technologies (Lin and Lee, 2005). As the complexity and sophistication of technologies increase, top management can provide a vision and commitment to create a positive environment for innovation (Lee and Kim, 2007). Firm size will be positively correlated with the technology transfer. Technology readiness will be positively correlated with the technology transfer. Technological readiness of organizations, meaning technological infrastructure and IT human resources, influences the adoption of new technology (Oliveira and Martins, 2010). Technological infrastructure refers to installed network technologies and systems in place. IT human resources provide the knowledge and skills to implement technology transfer. Competitive pressure will be positively correlated with the technology transfer. Competitive pressure refers to the level of pressure felt by the firm from competitors within the industry (Oliveira and Martins, 2010). Trading partner pressure will be positively correlated with the technology transfer. Some empirical research studies have suggested that trading partner pressure is an important determinant for IT adoption and use (Zhu et al., 2004).The Major and key variables for the model are Technology, Technology transfer, Organization support, Environment competition, Marketing, Management support and the university size.
4.1. Hypothesized Reference Mode for Technology Transfer
- Reference mode and behavior chart are simply other names for a plot of the behavior of key variables of a system over time. A reference mode graph has time on the horizontal axis and units of the variables on the vertical axis. By drawing the reference modes, a modeler roughly simulates the situation in his mind. A modeler needs to think clearly about which factors influence each other. A modeler takes the most important factors, usually the stocks and flows of the system, and graphs their behavior over time. See Figure 3 below for our research study.
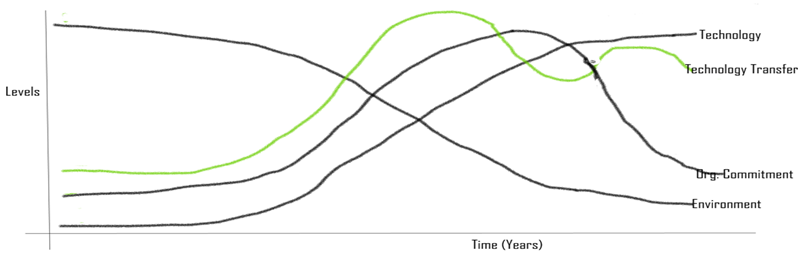 | Figure 3. Reference Model of Technology transfer |
4.2. Dynamic Hypothesis, Mechanisms and Feedback Loops
- A dynamic hypothesis is an explanation of the reference mode behavior and should be consistent with the model purpose. A modeler uses a dynamic hypothesis to draw out and test the consequences of the feedback loops. Then a modeler creates diagrams illustrating the basic mechanisms driving the system’s dynamic behavior as shown in Figure 4 below:
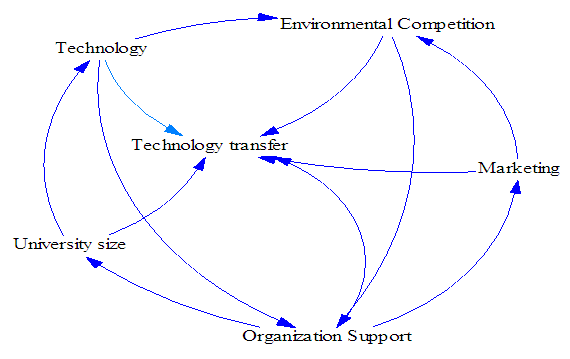 | Figure 4. Dynamic hypothesis / Descriptive Model of the system |
5. Modeling the Technology Transfer
- A dynamic hypothesis is an explanation of the reference mode behavior and should be consistent with the model purpose. A modeler uses a dynamic hypothesis to draw out and test the consequences of the feedback loops. Then a modeler creates diagrams illustrating the basic mechanisms driving the system’s dynamic behavior.
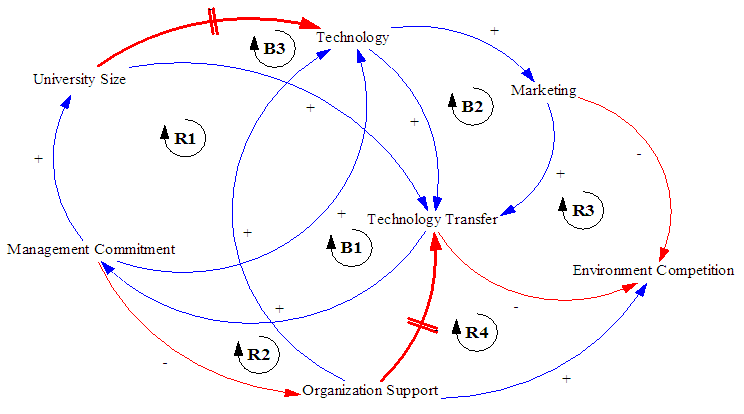 | Figure 5. Causal-Loop diagram for Technology Transfer Feedback Model |
6. Propositions Derived from the TT Descriptive Model
- The following propositions has been derived from the above model to give more understanding of the TT process:1. It can be assumed that Reputable Universities enjoys academic prestige and is linked to higher research quality. This indirectly influences the outcomes of technology transfer. 2. The size of university is expected to be indirectly related to the relative or absolute performance of the R&D which influences the Technology transfer and policy formulation. 3. Organization structure and operational processes of the University impacts technology transfer efficiency. 4. Technology complexity and its compatibility (high technology) impact positively to technology transfer efficiency. 5. The regional economic status (resource per person, University Budget and Collaboration Research) impacts the technology transfer efficiency. 6. The level of education in a community or region impacts the technology transfer efficiency.
7. Summary and Further Research
- The contribution of this paper has been twofold as follows. Firstly, a literature survey that helped identify the gaps that exists in technology transfer in limited resource settings and more so on Technical, Organizational and Environmental. Secondly, combination of SD modeling and data analytics to accommodate data science and particularly big-data. This hybrid modeling approaches should be further developed in order to make existing modeling and simulation approaches appropriate for dealing with modern data and making SD more scientific and data-rich and can be used to infer parts of models from data. The immediate future work will be development of a system dynamics model that will be used to determine the strengths of the relationships and thus the relative importance of each key variable discussed in this paper.