Waqas Ahmad, Awais Salman Qazi
Department of Computer Science, Lahore Garrison University, Lahore, Pakistan
Correspondence to: Waqas Ahmad, Department of Computer Science, Lahore Garrison University, Lahore, Pakistan.
| Email: |  |
This work is licensed under the Creative Commons Attribution International License (CC BY).
http://creativecommons.org/licenses/by/4.0/

Abstract
Cloud computing is a revolutionary technology in the field of information technology and is growing immensely with a fast pace. Cloud computing offers better resource sharing, resource utilization and energy efficiency to end users and service providers. CPU utilization is a necessary part in cloud computing. In this research paper, we have investigated the CPU utilization between host and guests in physical and virtual environment which will help further in better resource management. The relationship overview between them has been observed on an open source cloud computing software i.e. OpenStack. The results in the form of graphs are collected from both cloud and standalone system for a better understanding. The simulation gathered from cloud and standalone system has revealed that in 100% Workload, CPU utilization is constant while in low Workload, the CPU utilization correlates in the correlation analysis.
Keywords:
Cloud Computing, CPU Utilization, Open Stack, Resource Utilization
Cite this paper: Waqas Ahmad, Awais Salman Qazi, Analysis of Interactive Utilization of CPU between Host and Guests in a Cloud Setup, Computer Science and Engineering, Vol. 8 No. 1, 2018, pp. 7-15. doi: 10.5923/j.computer.20180801.02.
1. Introduction
Cloud computing is fastest growing field of information technology. It offers resource sharing with maximum flexibility and scalability. There are three different models of cloud computing i.e. Software as a service (SaaS), Platform as a service (PaaS) and Infrastructure as a service (IaaS). SaaS provides application and software for consumers which can act as a host in cloud infrastructure. PaaS gives the opportunity to consumers to develop their own application and software in cloud infrastructure, while IaaS gives opportunities for the consumers to deploy different resources like network, storage, memory and processor in a cloud infrastructure [1-3]. Service providers such as internet service providers (ISP) use IaaS to give services to their customers by deploying various computers which are used as resources. They also want to have a check and balance on their computer resources, it means that they check regularly how much their computer resources have been used by the customers. Same is the case with the system performance. System performance varies according to the usage of resources. System performance can give a better view of the usage. However, this kind of work is not new, but it has not been implemented properly in cloud infrastructure due to little research in the service model of cloud infrastructure [4, 5]. The cost of cloud service provider depends mainly on the utilization of central processing unit and the cost of cloud customer depends on the resources they use. It is already known that if the CPU utilization is high, it will tend to generate more heat in the datacenter and more heat will ultimately increase the electricity cost. If the heat is generated, there must be some precautionary measures to minimize the heat of that datacenter, which will also cost lot of money to accomplish. It has been observed that approximately 40% of money has been spent on giving the electricity bills and minimizing the heat of datacenters [6, 7]. The cloud infrastructure promises to offer efficient resource utilization for the datacenters, CPU is one of the various resources that a customer can use in a cloud environment [8]. Therefore, CPU utilization has been taken into account in this research paper. CPU utilization shows the value between 0 to 100, which explains the percentage of CPU usage. Value 100 means that CPU is not available for further processes. In this scenario if a new process is placed in a queue, it will create a huge mess up for the CPU. Therefore, it is necessary to have a deep look on the utilization of resources so that CPU is always available for new processes [9]. In a cloud environment, service providers prefer to monitor the CPU utilization so that efficient service can be made possible for their valuable customers. In this research paper, we have analyzed the relationship between host and guests in terms of CPU utilization from customer and service provider’s point of view. This relationship will help us to launch the better management of resources. Our main motivation and concern in carrying out this research is that we are able to find a scenario where we will have CPU utilization as high as possible and that it will always be available for the new processes. We have taken our research into steps. First we have discussed about the virtualization techniques, what is hypervisor and why it is used. Then we have chosen a cloud computing tool and performed all the simulations on it. The simulation results obtained during this process are displayed and are made visible for the readers.
2. Virtualization
Virtualization is the process of creating virtual environments of something in which you can get all things to work with like operating system, devices, servers and network resources. A virtual computer is normally called as a virtual machine (VM). Like original computer, virtual computer has operating system and application programs. There can be more than one virtual machines on a single computer that can share resources.
2.1. Virtualization Techniques
There are various techniques of virtualization which can be termed as follows:1. Operating System Virtualization2. Hardware/Platform Virtualization3. Para VirtualizationOperating System virtualization means that multiple operating systems be run parallel on the same computer. It allows the user to run multiple applications that can use multiple operating systems on the same computer. Disadvantage of this OS virtualization is that it uses same kernel as that of physical computer [10]. In hardware or platform virtualization, a virtual machine is created that acts like a real machine. This kind of virtualization does not share kernel; it will have its own unique kernel. This virtualization technique has all hardware components that makes the installation of VMs very easy. Para virtualization is an extension of virtualization. An interface has been provided to the virtual machine in this kind of technique. It is a lightweight technique.
2.2. Properties of Virtual Machine
There are various properties of virtual machine, all these properties are very unique and because of this uniqueness it offers many benefits. Some of the benefits are briefed as follows [11]:1. Partitioning2. Isolation3. Encapsulation4. Hardware Independence
3. Introduction to Hypervisor
Hypervisor is a virtual machine monitor (VMM) that is used to monitor the virtual machines. In other words, it can be said that without the hypervisor, virtual machines cannot be run. Hypervisor might be called as software, firmware or hardware that can create and run virtual machine. There are two types of hypervisor available, one is termed as Type-1 and another is Type-2. Type-1 hypervisor runs directly on host hardware and manages the guest’s operating system while Type-2 hypervisor is installed onto the host computer and then works like an application program [12].
4. Introduction to OpenStack Tool
OpenStack is an open source tool that is used to create private and public clouds and also allows to deploy and manage cloud infrastructure. Cloud has two requirements which are huge scalability simplicity, open stack is the one which fulfils these requirements. The main point of open stack software is that it can be configured by the user very easily i.e. if a user doesn’t want anything it can be eliminated easily. Another plus point of open stack software is that it supports various hypervisors, it is not limited to only one hypervisor. Xen, KVM and VMware are different kinds of hypervisor to some extent. Services that open stack software provide are compute, object storage, block storage, network management, authentication, image service, billing service and dashboard. In a datacenter there are many resources present i.e. compute, storage and network resources. OpenStack software has the ability to tackle with the large pool of resources. It can manage these resources through its dashboard and it is the most suitable for heterogeneous infrastructure. Lot of enterprises, companies and institutions are showing great trust on this tool because of its various unique features. Every enterprise wants to expand its business and due to the trust level of OpenStack, they rely on this software [13]. It is mostly deployed as IaaS, in which services and resources are made available to the customers. OpenStack main services and components are explained by the figure 1 below.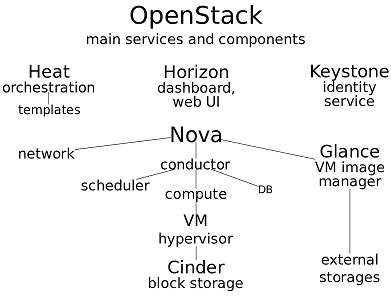 | Figure 1. OpenStack Main Services and Components [13] |
OpenStack is a group of source projects that has an ambition to provide comprehensive cloud services. It is used for building cloud computing scenarios and also used for managing cloud computing scenarios both in public and private clouds.
5. Simulation Results
Simulation has been performed on looking at CPU usage in OpenStack compute node and independent experiment to see the impact of OpenStack orchestration layer on CPU utilization with kernel based virtual machine hypervisor. All the scenarios are run for at-least five minutes, and 10 minutes’ iteration time been included in it. The platform used for obtaining the results is OpenStack. So as to decide the CPU execution of the compute node, mpstat is issued for 5 minutes. The x-axis of graph denotes time in seconds while y-axis denotes CPU utilization in percentage. Simulation results of CPU utilization data collected from compute node and standalone system of a city’s network are displayed in the form of graphs in figure 2 and figure 3 respectively below. In this simulation, multiple number of virtual machines are used. It is already stated that mpstat provides CPU utilization and it has the overall values.To get steady outcome the use estimations of initial 60 seconds and most recent 60 seconds are considered as warm up and are evacuated. The outcome from tests demonstrate that the CPU usage increases by expanding the quantity of VMs. The graph takes a specific pattern in the both situations when the quantity of VMs being focused is expanded. But both the graphs are quite different to each other in terms of CPU utilization. Clearly graph in figure 3 has the maximum CPU utilization because standalone system has less number of CPU cores as compared with the city’s network compute node.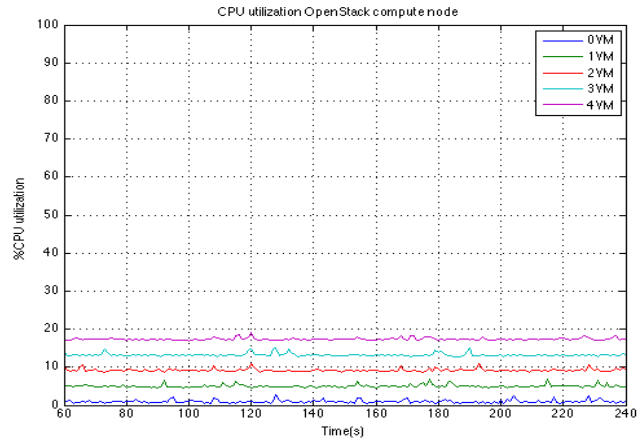 | Figure 2. CPU usage data from compute city network node |
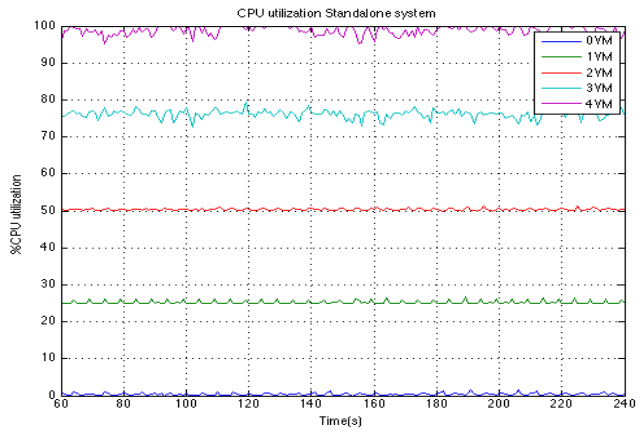 | Figure 3. CPU usage data from standalone test system |
6. Results of Load Using Different Tools
These results have been performed with a tool named stress-ng, which is used to customize the workload. Initially, stress-ng is used to stress 1 virtual central processing unit (VCPU) of virtual machine (VM) with 10% load. Afterwards the percentage of load is increased to see the response of CPU utilization. Load is increased to 20%, 30%, 40%, 50% and 100% in each experimental run. Two different tools (mpstat and Top) have tried to fetch the data from physical machine and virtual machine in Ubuntu and CentOS host. Following graphs show the behavior of load when two different operating systems are tried. First of all, result of load in Ubuntu operating system using mpstat tool with 1 VCPU is shown in figure 4, then result of load in CentOS using mpstat tool with 1 VCPU is shown in figure 5. Similarly, results in both cases with 2 VCPU using mpstat tool is shown in figure 6 and figure 7 respectively. Below graphs show the results of load with stress-ng.Now above graphs show the results when we used another tool named (Top) and tried to fetch the data from physical and virtual machine in Ubuntu and CentOS host. Result of load in Ubuntu operating system and CentOS using (Top) tool with 1VCPU is shown in figure 8 and figure 9 respectively. Result of load in Ubuntu and CentOS using (Top) tool with 2VCPU is shown in figure 10 and figure 11 respectively.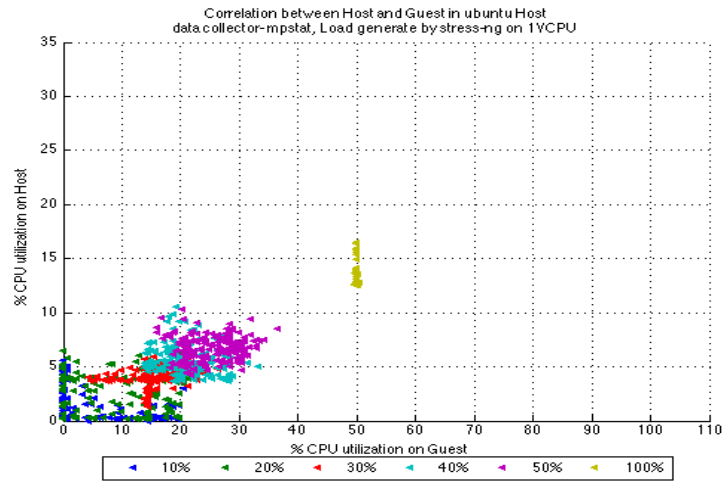 | Figure 4. CPU utilization on Ubuntu host (1 VCPU) |
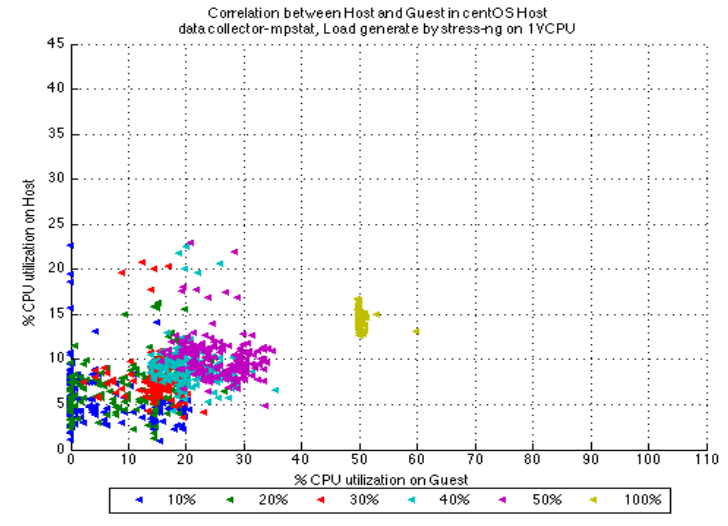 | Figure 5. CPU utilization on CentOS host (1 VCPU) |
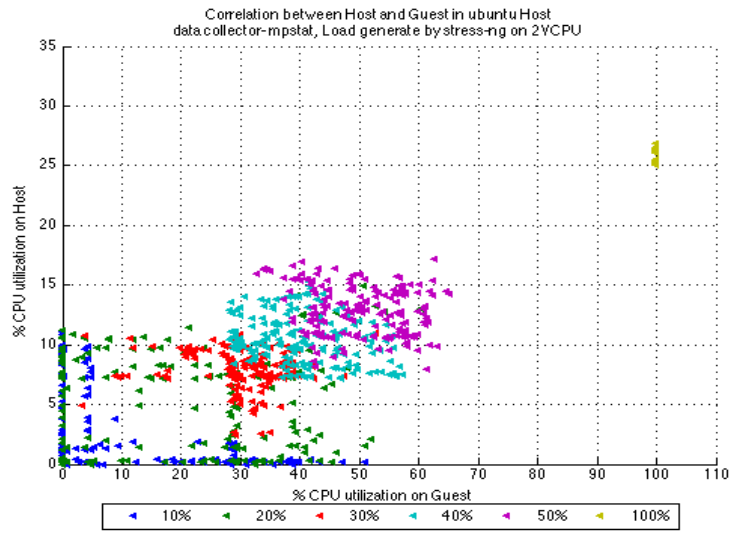 | Figure 6. CPU utilization on Ubuntu host (2 VCPU) |
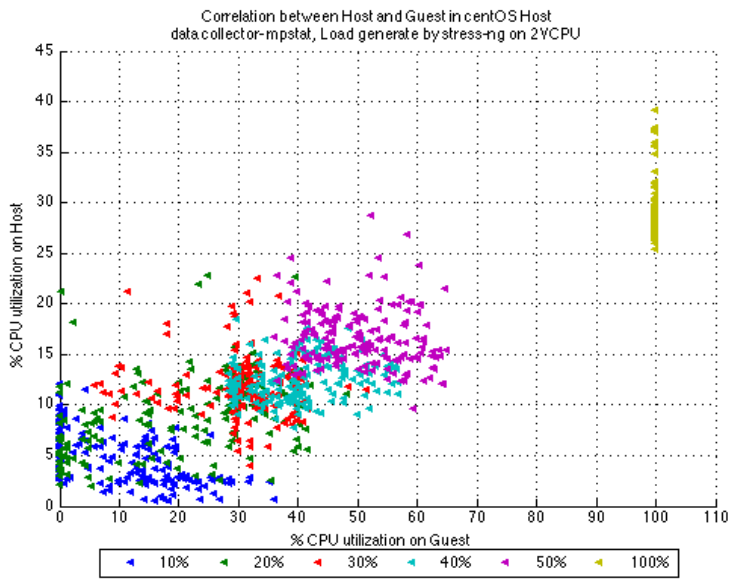 | Figure 7. CPU utilization on CentOS host (2 VCPU) |
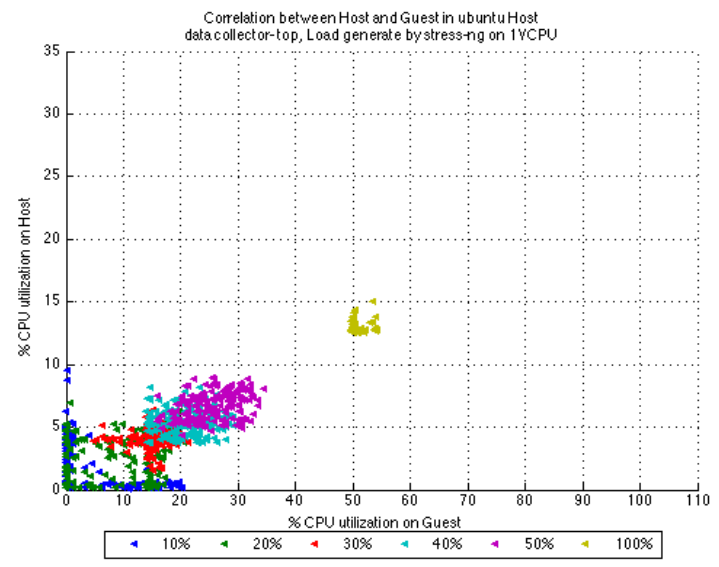 | Figure 8. CPU utilization on Ubuntu host (1 VCPU) |
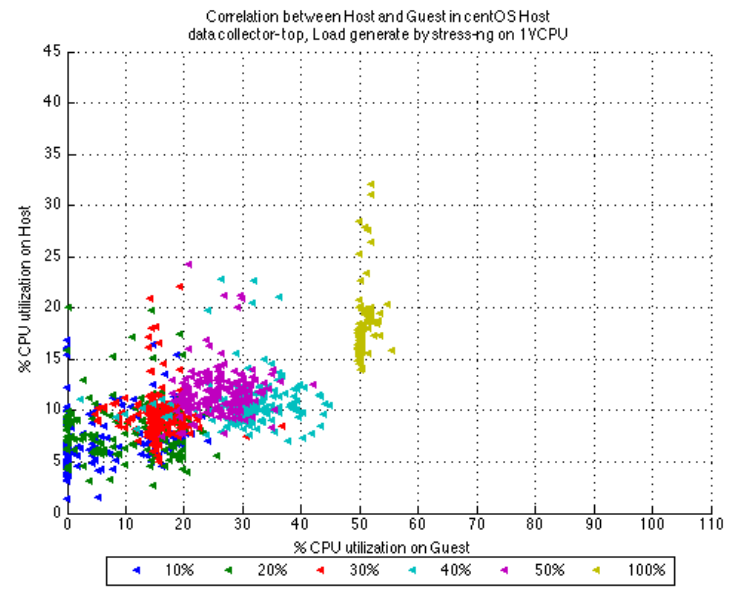 | Figure 9. CPU utilization on CentOS host (1 VCPU) |
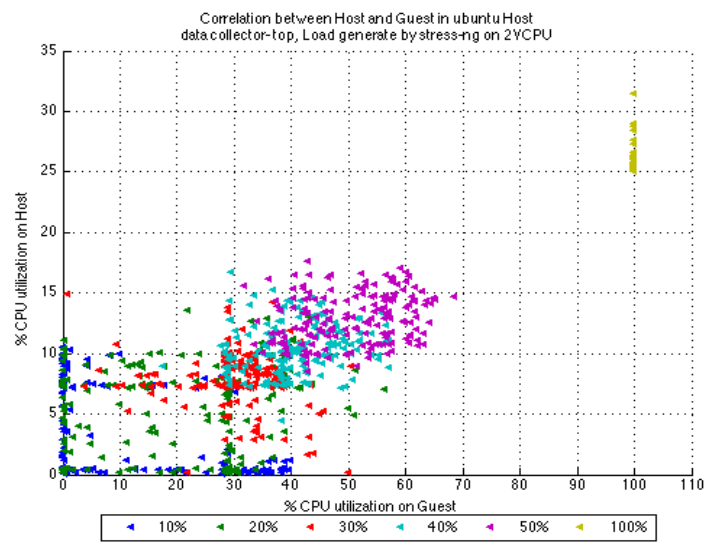 | Figure 10. CPU utilization on Ubuntu host (2VCPU) |
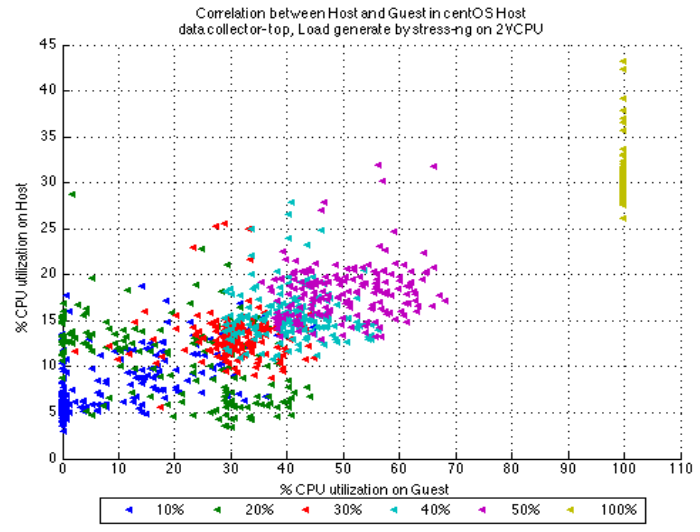 | Figure 11. CPU utilization on CentOS host (2 VCPU) |
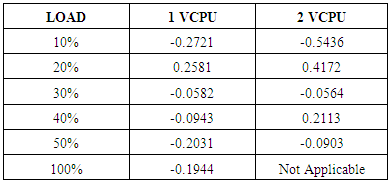
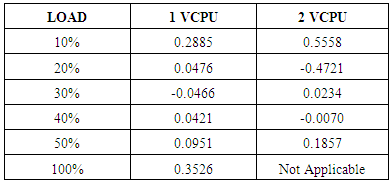
7. Statistical Analysis
The visual relationship from dissipated plots demonstrate that there is some linearity when VM is loaded by different workloads. To explain the behavior of above graphs mathematically, we need to have the value of correlation coefficient. The value of correlation coefficient always lies between the range of -1 and 1 [14], which can be seen from the table 1, 2, 3 and 4 respectively below. Table 1. Correlation coefficient b/w CentOS host and guest (mpstat tool)
 |
| |
|
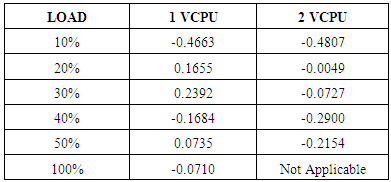
Table 2. Correlation coefficient b/w CentOS host and guest (top tool)
 |
| |
|
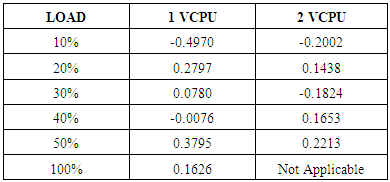
Table 3. Correlation Coefficient b/w Ubuntu host and guest (mpstat tool)
 |
| |
|
Table 4. Correlation coefficient b/w Ubuntu host and guest (top tool)
 |
| |
|
8. Conclusions
In this paper, a visual correlation is provided between CPU utilization of standalone (host) and cloud system (guest). There is slight correlation amongst host and guest CPU usage, when they are totally used. Scattered plots are obtained when the load percentage is under 100 and we can't see a legitimate pattern in them. Examining the mechanisms for getting CPU usage is out of extension. We can't really extrapolate and add from host to guest values or the other way around. We recommend that system/network manager ought to be more cautious about the performance.
9. Future Work
In virtualization frameworks, both hypervisor and guest operating system offer scheduling services which are multiple in nature, therefore this twofold scheduling activity weakens the execution issue in the framework. Rather, dynamic task of VCPUs to the VM in light of its need and also accessible PCPUs is useful [15]. Our research paper focused on distinguishing CPU conduct when more than one distributed resources are pushed and guiding this investigation to dynamic task of computational assets is in fact convincing and can be considered as future work.
ACKNOWLEDGEMENTS
We would like to take this opportunity to express our profound gratitude and deep regard to Mr. Muhammad Kashif Aslam (Lecturer, University of Poonch, Rawlakot, Azad Jammu & Kashmir, Pakistan) for sharing his pearl of wisdom, valuable feedback and constant encouragement with us during the course of this research. His perceptive criticism kept us working to write this research paper in a much better way. We also thank two anonymous reviewers for their so-called insights. We are also immensely grateful to Mr. Taseer Suleman (Senior Lecturer, Lahore Garrison University, Pakistan) and Mr. Zaka Ullah (Lecturer, Lahore Garrison University, Pakistan) for their comments on an earlier version of the manuscript, although any errors are our own and should not tarnish the reputations of these esteemed persons. We would also like to thank our parents who have been a continuous source of encouragement till the completion of this manuscript. Their prayers have made us capable to write this manuscript.
References
| [1] | L. M. Vaquero, L. Rodero-Merino, J. Caceres, and M. Lindner, “A Break in the Clouds: Towards a Cloud Definition,” SIGCOMM Computing Communication Rev, vol. 39, no. 1, pp. 50–55, Dec. 2008. |
| [2] | T. Grandison, E. M. Maximilien, S. Thorpe, and A. Alba, “Towards a Formal Definition of a Computing Cloud,” in 2010 6th World Congress on Services (SERVICES-1), 2010, pp. 191–192. |
| [3] | B. P. Rimal and E.Choi, “A service-oriented taxonomical spectrum, cloudy challenges and opportunities of cloud computing,” Int. J. Commun. Syst., vol. 25, no. 6, pp. 796- 819, 2012. |
| [4] | G. Katsaros, G. Gallizo, R. Kübert, T. Wang, J. O. Fitó, and D. Henriksson, “A Multi-level Architecture for Collecting and Managing Monitoring Information in Cloud Environments.,” in CLOSER, 2011, pp. 232–239. |
| [5] | Q. Zhang, L. Cheng, and R. Boutaba, “Cloud computing: state-of-the-art and research challenges,” J. Internet Serv. Appl., vol. 1, no. 1, pp. 7–18, 2010. |
| [6] | M. Gusev, S. Ristov, M. Simjanoska, and G. Velkoski, “CPU Utilization while Scaling Resources in the Cloud,” presented at the CLOUD COMPUTING 2013, The Fourth International Conference on Cloud Computing, GRIDs, and Virtualization, 2013, pp. 131–137. |
| [7] | A. Beloglazov and R. Buyya, “Energy Efficient Allocation of Virtual Machines in Cloud Data Centers,” in Proceedings of the 2010 10th IEEE/ACM International Conference on Cluster, Cloud and Grid Computing, Washington, DC, USA, 2010, pp. 577–578. |
| [8] | A. Berl, E. Gelenbe, M. Di Girolamo, G. Giuliani, H. De Meer, M. Q. Dang, and K. Pentikousis, “Energy-efficient cloud computing,” Comput. J., vol. 53, no. 7, pp. 1045–1051, 2010. |
| [9] | Available online at http://www.cyberciti.biz/tips/how-do-i-find-out-linux-cpu-utilization.html. |
| [10] | B. Gregg, Systems Performance: Enterprise and the Cloud. Pearson Education, 2013. |
| [11] | Available online at https://www.vmware.com/solutions/virtualization.html. |
| [12] | M. Portnoy, Virtualization essentials, vol. 19. John Wiley & Sons, 2012. |
| [13] | Available online at https://www.openstack.org |
| [14] | Bivariate analysis, Wikipedia, the free encyclopedia. 28-Jul-2015. |
| [15] | X. Song, J. Shi, H. Chen, and B. Zang, “Schedule Processes, Not VCPUs,” in Proceeding of the 4th Asia-Pacific Workshop on Systems, New York, NY, USA, 2013, pp.1:1-1:7. |

 Abstract
 Reference
 Full-Text PDF
 Full-text HTML