-
Paper Information
- Paper Submission
-
Journal Information
- About This Journal
- Editorial Board
- Current Issue
- Archive
- Author Guidelines
- Contact Us
Computer Science and Engineering
p-ISSN: 2163-1484 e-ISSN: 2163-1492
2017; 7(2): 52-66
doi:10.5923/j.computer.20170702.03

A New Hybrid Fuzzy Time Series Forecasting Model Combined the Time -Variant Fuzzy Logical Relationship Groups with Particle Swam Optimization
 Abstract
 Reference
 Full-Text PDF
 Full-text HTML
Nghiem Van Tinh1, Nguyen Cong Dieu2
1Thai Nguyen University of Technology, Thai Nguyen University, Thainguyen, Vietnam
2Thang Long University, Hanoi, Vietnam
Correspondence to: Nghiem Van Tinh, Thai Nguyen University of Technology, Thai Nguyen University, Thainguyen, Vietnam.
| Email: |  |
Copyright © 2017 Scientific & Academic Publishing. All Rights Reserved.
This work is licensed under the Creative Commons Attribution International License (CC BY).
http://creativecommons.org/licenses/by/4.0/

Fuzzy time series forecasting models are used to overcome traditional time series methods when the historical data of traditional time series approaches contain uncertainty or need to be represented by linguistic values. Besides, fuzzy time series forecasting methods do not require any assumption valid. Generally, fuzzy time series forecasting methods consist of three major stages such as fuzzification, determination of fuzzy logic relationships or fuzzy relationship matrix, and defuzzification. All these stages of fuzzy time series are very important on the forecasting performance of the model. In this paper, a new hybrid fuzzy time series forecasting model is proposed based on three computational approaches such as: the new concept of time-variant fuzzy relationship group is used to establish time-variant fuzzy relationship group in the determination of fuzzy logical relationships stage, named called the time - variant fuzzy logical relationship groups (TV-FLRGs), the proposed forecasting rules is applied to calculate the forecasting value for the TV-FLRGs and particle swarm optimization technique (PSO) is aggregated with TV-FLRGs to adjust interval lengths and find proper intervals in the universe of discourse with the objective of increasing forecasting accuracy. To verify the effectiveness of the proposed model, two numerical data sets are selected to illustrate the proposed method and compare the forecasting accuracy with existing methods. The results show that the proposed model gets a higher average forecasting accuracy rate to forecast the Taiwan futures exchange (TAIFEX) and enrolments of the University of Alabama than the existing methods based on the first – order and high-order fuzzy time series.
Keywords: Enrolments, TAIFEX, Forecasting, Fuzzy time series (FTS), Time – variant fuzzy logical relationship groups, High-order fuzzy time series, Particle swarm optimization
Cite this paper: Nghiem Van Tinh, Nguyen Cong Dieu, A New Hybrid Fuzzy Time Series Forecasting Model Combined the Time -Variant Fuzzy Logical Relationship Groups with Particle Swam Optimization, Computer Science and Engineering, Vol. 7 No. 2, 2017, pp. 52-66. doi: 10.5923/j.computer.20170702.03.
Article Outline
1. Introduction
- In recent years, fuzzy time series has been widely applied to many fields such as forecasting enrolments, crop productions, stock index, temperature, etc.,. Based on the fuzzy set theory, Song and Chissom [1] first proposed the concept of fuzzy time series. They developed two fuzzy time series forecasting models: the time-invariant model [1] and the time-variant model [2] which use the max–min operations to forecast the enrolments of the University of Alabama. Compared with traditional time series models, these fuzzy time series models can deal with the forecasting problems in which the historical data are represented by linguistic values rather than traditional time series model. Unfortunately, their methods had many drawbacks such as huge computation when the fuzzy rule matrix is large and lack of persuasiveness in determining the universe of discourse and the length of intervals. Therefore, in order to overcome those disadvantages, Chen [3] proposed the first-order fuzzy time series model by using simple arithmetic calculations to replace max-min composition operations [1, 2] in the process of mining fuzzy logical relationships and performing prediction for better forecasting accuracy. After that, the fuzzy time series methods have received increasing attention in many forecasting applications. To achieve better forecasting accuracy, in [4] presented an effective approach which can properly adjust the lengths of intervals. Subsequently, in order to further enhance forecasting accuracy of model, Chen [5] extended his previous work [3] to a high-order time-invariant fuzzy time series model to forecast the enrolments of the University of Alabama. Yu showed models of refinement relation [6] and weighting scheme [7] for improving forecasting accuracy. Singh [8] presented a simplified and robust computational method for the forecasting rules based on one and various parameters as fuzzy relationships. In addition, in [9] exploited neural networks to construct FTS model. The model was used to forecast stock index and obtained better forecasting results. In the recent years, many researchers started applying nature inspired computation techniques for optimization purpose in FTS forecasting. Chen et al. [10, 11]. improved the first-order and high-order fuzzy time series model by introducing genetic algorithm. Lee et al. [12] presented method for forecasting the temperature and the TAIFEX based on the high – order fuzzy logical relationship groups and genetic algorithm. They also used simulated annealing techniques [13] to adjust the length of each interval in the universe of discourse for increasing the forecasting accuracy rate. Particle swarm optimization technique has been successfully applied in many applications as can be found in [14-21]. From Chen's model [3], Kuo et al. [14] introduced a new hybrid forecasting model which combined fuzzy time series with PSO algorithm to find the proper length of each interval. Then, by improving method [14]. Kuo et al. [15] presented a new hybrid forecast method to solve the TAIFEX forecasting problem based on FTS and PSO algorithm. In addition, in [16] proposed a new method for the temperature prediction and the TAIFEX forecasting, based on two-factor high-order fuzzy logical relationships and particle swarm optimization. Singh and Borah [17] also utilized PSO algorithm to construct unequal-sized intervals for developing Type-2 fuzzy model of stock time series on basis of the scheme of supervised learning. Dieu N.C et al. [18, 19] introduced the concept of time-variant fuzzy logical relationship group and used it in the determining of fuzzy logical relationship stage. Huang et al. [20] proposed a new forecasting model based on FTS and PSO by using the global information of fuzzy logical relationships is aggregated with the local information of latest fuzzy fluctuation to find the forecasting value in FTS. Moreover, a novel method of partitioning the universe of discourse of time series based on interval information granules is proposed in [21] for improving forecasting accuracy. Some other techniques for determining best intervals and interval lengths based on clustering techniques such as: the automatic clustering techniques are found [22], and the fuzzy c-means clustering in [23]. Other approaches as, a high-order algorithm for Multi-Variable FTS [24] and a vector autoregressive model for Multi-Variable FTS [25] based on fuzzy clustering are presented to deal various forecasting problems such as: enrolments forecasting, Gas forecasting, Rice produce prediction and Handy-max and Panamax data of the chartering rates of a group of dry bulk cargo ships, respectively.The above-mentioned researches showed that the lengths of intervals, fuzzy logical relationships and fuzzy defuzzificated techique are three critical factors for forecasting accuracy. Therefore, the objective of the present research is to develop a new model for forecasting in fuzzy time series models which combined the TV-FLRGs is proposed in [18] and PSO algorithm. Firstly, the proposed method fuzzifies the historical data into fuzzy sets to create high-order TV-FLRGs. Secondly, the novel defuzzication rules of forecasting are proposed to calculate the forecasting value for these TV-FLRGs. Finally, a new hybrid forecasting model based on aggregated the high – order TV-FLRGs and PSO algorithm for the optimized lengths of intervals is developed to adjust the lengths of intervals in the universe of discourse with an aim to increase the forecasting accuracy. The empirical study on the enrolments data at the University of Alabama and the stock market dataset of TAIFEX show that the performance of proposed model is better than those of any existing models.This paper is organized as follows. In Sec. 2, a brief review of the basic concepts of FTS and algorithms are introduced. In Sec. 3, an improved forecasting model based on the high – order TV-FLRGs and PSO algorithm is presented. Section 4 evaluates the forecasting performance of the proposed method with the existing methods on the enrolment data of the University of Alabama and the TAIFEX data. Finally, conclusion remarks are given in Sec. 5.
2. Basic Concepts of Fuzzy Time Series and Algorithms
2.1. Basic Concepts of Fuzzy Time Series
- This section briefly reviews the basic fuzzy time series concepts. The main difference between the fuzzy time series and traditional time series is that the values of the fuzzy time series are represented by fuzzy sets rather than real value. Let
 be an universal set; a fuzzy set Ai of U is defined as
 where
where  is a membership function of a given set A, such that
 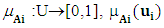 indicates the grade of membership of ui in the fuzzy set A, such that
 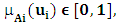 and 1≤ i ≤ n .. General definitions of FTS are given as follows:Definition 1: Fuzzy time series [1, 2]Let
 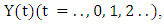 a subset of R, be the universe of discourse on which fuzzy sets
  are defined and if
  be a collection of
  then
then  is called a FTS on
  With the help of the following example, the notions of FTS can be explained:Example: The common observations of daily weather condition for certain area can be described using the daily common words “hot”, “very hot”, “cold”, “very cold”, “good”, “very good”, etc. All these words can be represented by fuzzy sets.Definition 2: Fuzzy logic relationships (FLRs) [1, 3]The relationship between F(t) and F(t-1) can be denoted by
  Let
Let  and
and  the relationship between F(t) and F(t -1) is denoted by fuzzy logical relationship
  where
where  and
and  refer to the current state or the left - hand side and the next state or the right-hand side of fuzzy time series.Definition 3: The high- order fuzzy logical relations [5]Let
  be a fuzzy time series. If
  is caused by
  then this fuzzy relationship is represented by by
  and is called an m- order fuzzy time series.Definition 4: Fuzzy logic relationship groups (FLRGs) [3]Fuzzy logical relationships with the same fuzzy set in the left-hand side of the fuzzy relationships can be grouped into a fuzzy logic relationship group. Suppose there are exists fuzzy logic relationships as follows:
 these fuzzy logic relationship can be grouped into the same FLRG as:
  The same fuzzy set appear more than once time on the right hand side, according to Chen model [3], it can be only counted one time but Yu model [6], the recurrence of fuzzy set can be admitted.Definition 5: The concept of Time-variant fuzzy logical relationship groups [18].The fuzzy logical relationship is determined by the relationship of
  If,
If,  and
and 
 The relationship
  is replaced by
  The same way, at the time t, we will have the following fuzzy logical relationship
  and
and  with
with 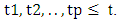 It is noted that Ai(t1) and Ai(t2) has the same linguistic value as Ai, but appear at different times t1 and t2, respectively. It means that if the fuzzy logical relationship took place before
 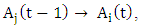 the fuzzy logical relationships can be grouped into the same FLRG as
  and it is called first – order time-variant fuzzy logical relationship group.Definition 6: The m – order time-variant fuzzy logical relationship groups [19].If there are the m - order fuzzy logical relationships having the same left-hand side, shown as follows:
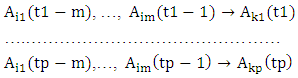 The notation
 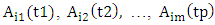 indicate the fuzzy set
 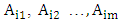 which appear in the m- order fuzzy relationships at time t1, t2,…,tp, respectively.It can be eliminated the time variable on the left-hand side of the fuzzy logical relationships as follows:
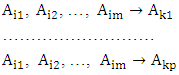 with t1< t2<…<tp, then these fuzzy logical relationships at the time tp can be grouped into a TV- FLRG, shown as follows:
2.2. Particle Swarm Optimization Algorithm
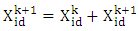
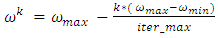
- PSO was first introduced by Eberhart and Kannedy in 1995, is a random searching algorithm based on group cooperation and is inspired by simulating the social behaviour of animals, such as fish schooling, birds flocking and the swarm theory. It is particle swarm optimization initializes each particle randomly, and then finds the optimal solution through iteration. At each step of optimization, the particles update themselves by tracking their own best position and the best particle [14]. To get the optimal solution, the particles update their own speed and positions according to the following formulas:
 | (1) |
 | (2) |
 | (3) |
 is the current position of a particle id in k-th iteration;ü
  is the velocity of the particle id in k-th iteration, and is limited to
  where
where  is a constant pre-defined by user.ü
  is the position of the particle id that experiences the best fitness value.ü
  is the best one of all personal best positions of all particles within the swarm.ü Rand() is the function can generate a random real number between 0 and 1 under normal distribution.ü
  and
and  are acceleration values which represent the selfcondence coefficient and the social coefficient, respectively.ü
  is the inertia weight factor accoding to Eq. (3).A briefly description of the standard PSO is summarized in the following algorithm 1.
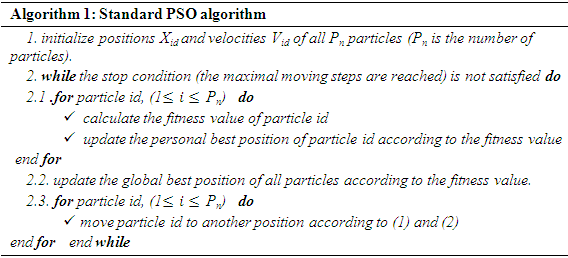
2.3. Time – Variant Fuzzy Logical Relationship Groups Algorithm
- Suppose there are fuzzy time series F(t), t =1, 2 ,…, q which it is presented by fuzzy sets as follows:
 Based on the Definition 5 and 6 of the time - variant fuzzy logical relationship groups, an algorithm for TV-FLRGs is proposed as follows:
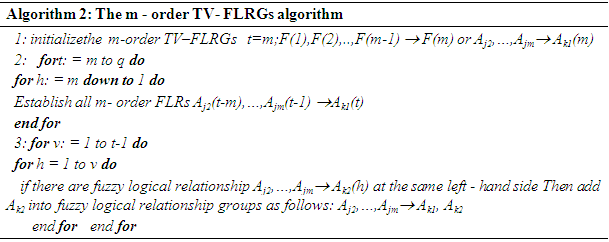
3. A New Forecasting Model Based on the TV-FLRGs and PSO Algorithm
- In this section, a new forecasting model which combined the high – order TV-FLRGs and PSO algorithm is introduced. In the proposed model, three key aspects have been applied to approach the lengths of intervals and fuzzy logical relationships on time series data to increase forecasting accuracy. Firstly, original historical data are used instead of the variations of historical data in our forecasting model. Second, the high – order TV-FLRGs are derived from the concept of time-variant fuzzy relationship group and calculate the forecasting output based on the fuzzy sets on the right-hand side of the high – order TV-FLRGs. Third, the lengths of optimal intervals are obtained by employing PSO algorithm. The detail of the proposed model is presented as follows:
3.1. A New Forecasting Model Based on the TV-FLRGs
- To verify the effectiveness of the proposed model, all historical enrolments data [14] from 1971s to 1992s are used to illustrate the high - order fuzzy time series forecasting process. The step-wise procedure of the proposed model is detailed as follows:Step 1: Define the universe of discourse UAssume Y(t) be the historical data of enrolments at year
 The universe of discourse is defined as
  In order to ensure the forecasting values bounded in the universe of discourse U, we set
 and
and  where
where  are the minimum and maximum data of
  and
and  are two proper positive integers to tune the lower bound and upper bound of the U. From the historical data [14], we obtain
 Thus, the universe of discourse is defined as
  with
with  and
and  Step 2: Partition U into equal length intervalsDivide U into equal length intervals. Compared to the previous models in [3] and [14], we cut U into seven intervals,
  respectively. The length of each interval is
 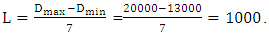 Thus, the seven intervals are defined as follows:ui = [13000 +(i-1)*L, 13000 + i *L), with
  gets seven intervals as:u1 = [13000, 14000), u2 = [14000,15000), …, u6 = [18000,19000), u7 = [19000, 20000).Step 3: Define the fuzzy sets for observationsEach of interval in Step 2 represents a linguistic variable of “enrolments” in [3]. For seven intervals, there are seven linguistic values which are
  “not many”,
  “not too many”,
  “many”,
  “many many”,
  “very many”,
  “too many”, and
  “too many many” to represent different areas in the universe of discourse on U, respectively. Each linguistic variable represents a fuzzy set
  and its definitions is described in (4) and (5) as follows.
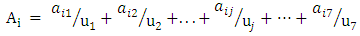 | (4) |
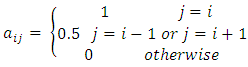 | (5) |
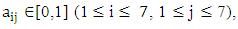 uj is the j-th interval of U. The value of
  indicates the grade of membership of uj in the fuzzy set Ai. For simplicity, the different membership values of fuzzy set
  are selected by according to Eq. (5). According to Eq. (4) and (5), a fuzzy set contains 7 intervals. Contrarily, an interval belongs to all fuzzy sets with different membership degrees. For example,
  belongs to
  and
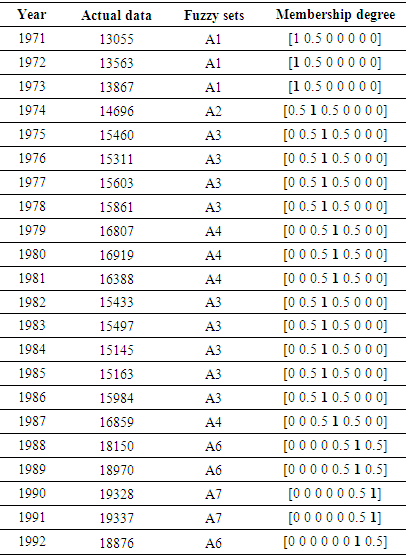
and  with membership degrees of 1 and 0.5 respectively, and other fuzzy sets with membership degree is 0.Step 4: Fuzzy all historical enrolments dataIn order to fuzzify all historical data, it’s necessary to assign a corresponding linguistic value to each interval first. The simplest way is to assign the linguistic value with respect to the corresponding fuzzy set that each interval belongs to with the highest membership degree. For example, the historical enrolment of year 1972 is 13563, and it belongs to interval
  because 13563 is within [13000, 14000). So, we then assign the linguistic value ‘‘not many” (eg. the fuzzy set
  ) corresponding to interval
  to it. Consider two time serials data
  and
and  at year t, where
  is actual data and
  is the fuzzy set of
  According to Eq. (4), the fuzzy set
  has the maximum membership value at the interval
  Therefore, the historical data time series on date
  is fuzzified to
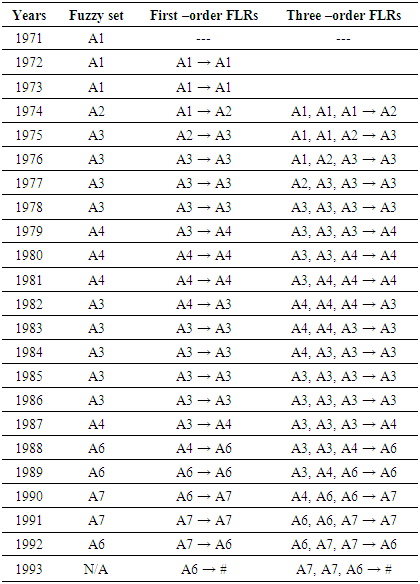
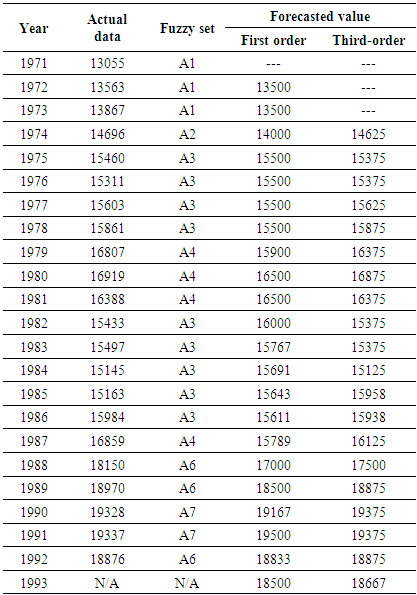
  The completed fuzzified results of the enrolments are listed in Table 1.
|
 Based on Definition 2 and 3, one fuzzy relationship is built by two or more consecutive fuzzy sets in time series. To establish a fuzzy logical relationship with various orders, we should find out any relationship which has the type
 where
where  and
and  are called the current state and the next state, respectively. Then a m - order fuzzy logical relationship is got by replacing the corresponding linguistic values as follows:
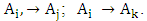
  Two examples for first-order and three-order are illustrated as follows.In the case of m = 1, two consecutive fuzzy sets are used to form a first – order fuzzy logical relationship. For example, based on Table 1, one fuzzy relationship
  is created by replacing the historical data of F(1973) and F(1974) with linguistic values of
  and
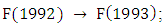
and  respectively. All first-order fuzzy relationships from year 1972 to 1992 are shown in column 3 of Table 2.Similarly, in the case of m = 3, four consecutive fuzzy sets are used to form a three – order fuzzy logical relationship. For example, based on Table 1, a fuzzy relationship
 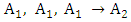 is got as
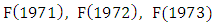
 respectively. All three-order fuzzy logical relationships from year 1974 to 1992 are shown in column 4 of Table 2. If the linguistic value of the next state does not exist in the historical data, the symbol ‘#’ is used to denote the unknown linguistic value. The fuzzy logical relationship with unknown linguistic value of the next state is used for testing. For example, a first-order fuzzy logical relationship is F(1992) → F(1993) where the linguistic value of F(1993) is unknown. Therefore, the fuzzy relationship is expressed as
|
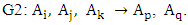
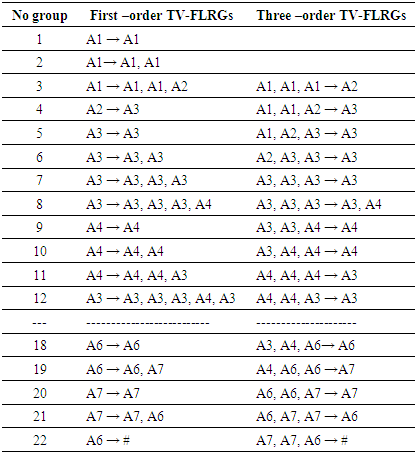
 These fuzzy logical relationships can be grouped together into two group G1 and G2 in chronological order are listed as follows:
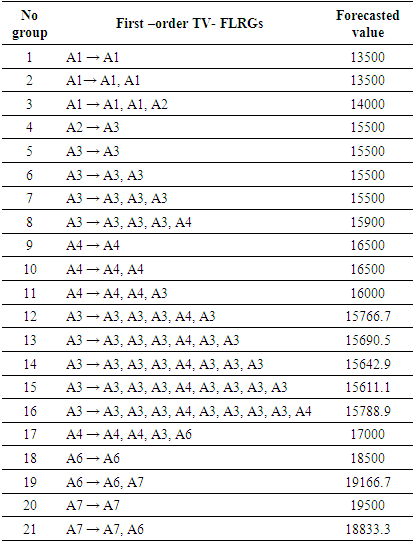
 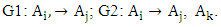 From this viewpoint and based on Table 2, we can obtain 22 the first -order TV- FLRGs are shown in column 2 of Table 3. Where, the first 21 groups of the first – order fuzzy logical relationship groups are called the trained patterns (or in training phase), and the last one is called the untrained pattern (or in testing phase). Similarly, we can establish m – order time – variant FLRGs based on Definition 6. For example, assume m=3 and there two 3rd – order fuzzy logical relationships with the left – hand side as follows:
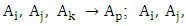
 These fuzzy logical relationships can be grouped together into two group G1 and G2 in chronological order are listed as follows:
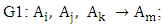
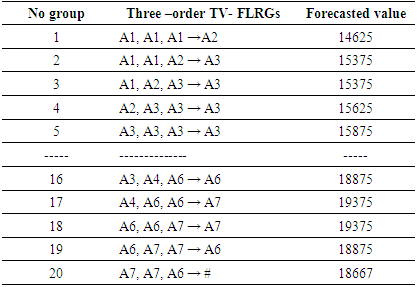
 From column 4 of Table 2 and based on Definition 6, all the three-order time – variant FLRGs are shown in column 3 of Table 3.
|
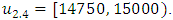
 then the forecasted value of year t is calculated as follows:
 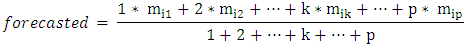 where,
 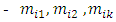 are the middle values of the intervals ui1, ui2 and uik respectively, and the maximum membership values of Ai1, Ai2 , . .. ,Aik occur at intervals ui1, ui2, uik, respectively.
 is chronologically determined weights.For example, the forecasted enrolments of the years 1974 is calculated as follows: From column 2 of Table 2, we can see that the fuzzified enrolments of year 1973 is A1. From column 2 Table 3, we can see that there is a fuzzy logical relationship group A1 → A1, A1, A2 that receives from three fuzzy logical relationships ‘‘A1 → A1, A1 → A1, A1 → A2” in chronological order are 1972, 1973 and 1974, respectively. Then, we can assign different weights for each FLR incrementally, say 1, 2, and 3 (the recent FLR is assigned the highest weight of 3). Therefore, the forecasted enrolments of year 1974 is calculated as follows:
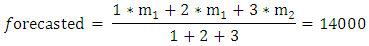 Where,
  are the middle values of the intervals
  respectively. Following the above example, the complete forecasted values for all the first - order FLRGs in column 2 of Table 3 are listed in Table 4.Rule 2: In the case of high – order TV-FLRGsIn order to estimate all forecasting values for all high – order TV-FLRGs, we consider more information within all next states or fuzzy sets on the right-hand side of all fuzzy relationships in the same group.The viewpoint of this principle is presented as following. For each group in column 3 of Table 3, we divide each corresponding interval of each next state into p sub-intervals with equal size, and calculate a forecasted value for each group according to Eq. (6).
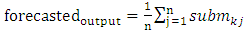 | (6) |
 ü n is the total number of next states or the total number of fuzzy sets on the right-hand side within the same group.ü
  is the midpoint of one of p sub-intervals (means the midpoint of j-th sub-interval) corresponding to j-th fuzzy set on the right-hand side where the highest level of Akj occur in this interval.For example, in column 3 of Table 3, Group 1 of three – order FLRs has only one fuzzy set on the right-hand side as
 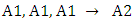 where the highest membership level of A2 belongs to interval
  In this study, we divide the interval
  into four sub-intervals which are
 In Table 3, the three-order fuzzy logical relationship group
  is got as F(1971), F(1972), F(1973) → F(1974); where the historical data of year 1974 is 14696 and it is within sub-interval
 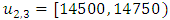 and then the midpoint
  of sub-interval
  is 14625. The finally, forecasted value for Group 1 according to Eq. (6) is 14625. Forecasted value of all remaining three – order TV- FLRGs are calculated in a similar manner and shown in Table 5.Rule 3: In the case of FLRGs is empty (called the untrained pattern)To estimate the forecasted value for the untrained pattern in testing phase, we use defuzzification rule is proposed in [14] whose name as mater voting (MV) scheme. For FLRG which contains the unknown linguistic value of the next, the MV scheme gives the highest votes (weights) to the latest past and one vote to other past linguistic values in the current state respectively, and calculates a forecasted value based on Eq. (7) as follows:
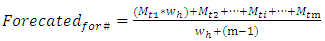 | (7) |
 means the highest votes predefined by user, the symbol m is the order of the fuzzy logical relationship, the symbols
  and
and  denote the midpoints of the corresponding intervals of the latest past and other past linguistic values in the current state. From column 3 of Table 3, it can be shown that last group has the three - order fuzzy logical relationship A7, A7, A6 → # as it is created by the fuzzy relationship
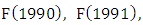
 since the linguistic value of F(1993) is unknown within the historical data, and this unknown next state is denoted by the symbol ‘#‘. Then, calculating value for "#" based on the current state of this group is computed by Eq. (7). The result of group with unknown next state under wh of 15 is shown in Table 5.
|
|
|
 | (8) |
3.2. Forecasting Model Combining the TV-FLRGs and PSO Algorithm
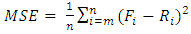
- To improve forecasted accuracy of the proposed model, the effective lengths of intervals, TV- FLRGs and defuzzification techniques which are three main issues presented in this paper. A novel hybrid method for forecasting enrolments is developed to adjust the length each of intervals in the universe of discourse without increasing the number of intervals by minimizing the MSE value (8).In our model, each particle exploits the intervals in the universe of discourse of historical data Y(t). Let the number of the intervals be n, the lower bound and the upper bound of the universe of discourse U on historical data Y(t) be
 and
and  respectively. Each particle is a vector consisting of n-1 elements
  where
where  and
and  Based on these n-1 elements, define the n intervals as
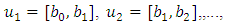
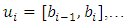 and
and 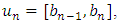 respectively. When a particle moves to a new position, the elements of the corresponding new vector need to be sorted to ensure that each element bi arranges in an ascending order. The complete steps of the proposed method are presented in Algorithm 3.
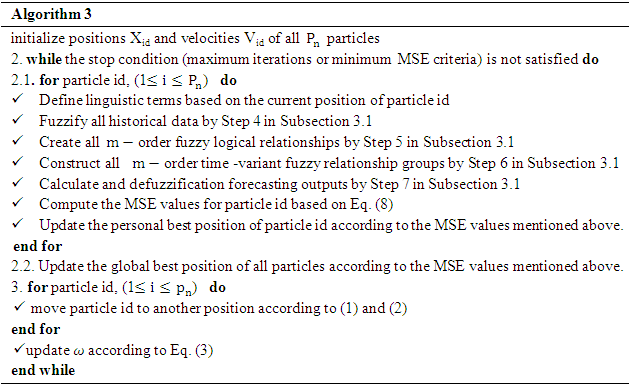
4. Experimental Results
4.1. Prepared Data
- In this paper, the proposed method is applied to forecast the enrolments of the University of Alabama with the entire historical data from 1971 to 1992 [14] and compared to other forecasting models with the same set of training data, training and testing phases. In addition, the proposed method is also tested in other forecasting problems such as the stock market index of TAIFEX [13] with the historical data from 8/3/1998 to 9/30/1998. Without loss of generality and for simplicity of comparison, the necessary parameters of the proposed model are set the same as HPSO model [14] for forecasting enrolments and NPSO model [15] for forecasting TAIFEX. The detail parameters for each of data set are listed and explained in Table 7.
|
4.2. Experimental Results for Forecasting Enrolments
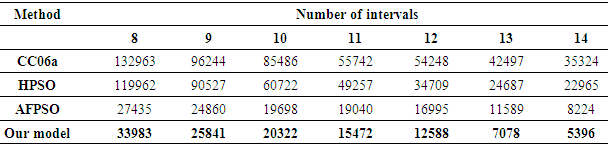
- To evaluate the effectiveness of the proposed model with the number of intervals is 14 and the first - order fuzzy logical relationships, six forecasting models i.e., the SCI model [2], C96 model [3], H01 model [4], CC06a model [10], HPSO model [14], Wei Lu’s et al. model [21] and AFPSO model [20] are selected for comparison. It is noted that the entire forecasting models employ the first-order fuzzy logical relationships with different number of intervals. The forecasted accuracy of the proposed model is estimated using the MSE function (8). According to the parameter values in column 2 of Table 7, the proposed model is executed 20 runs. In twenty optimal runs, our forecasting model can be get the 20 different MSE values. The smallest MSE value is chosen as the solution with an acceptable forecasting accuracy. A comparison of the forecasted results between the proposed and existing methods is listed in Table 8.
|
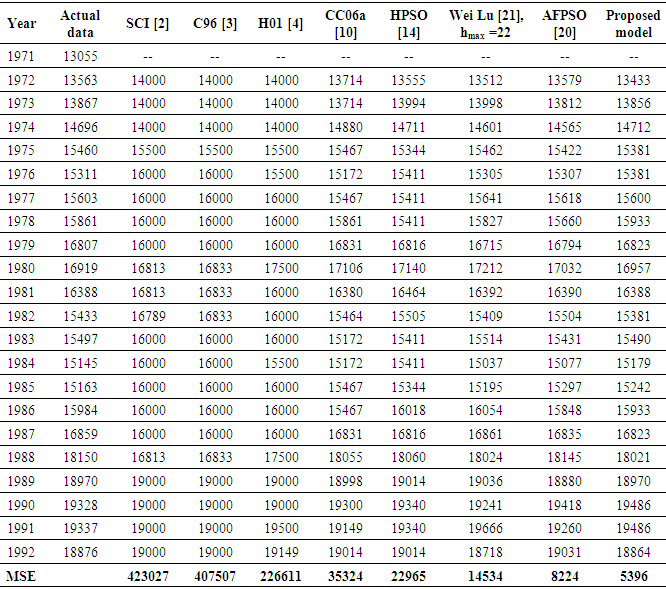
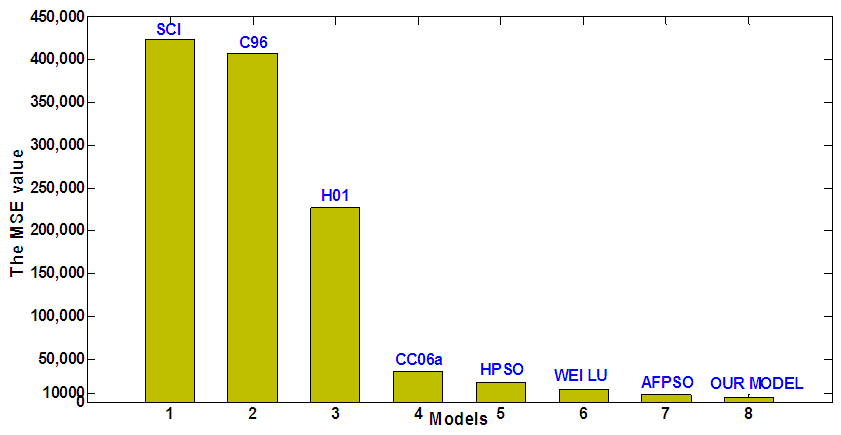 | Figure 1. A comparison of the MSE value between proposed model and the existing models based on first – order FTS |
|
|
 Furthermore, we also perform 10 more runs in each order to be compared with various high-order forecasting models under seven intervals such as C02 model in [5]. CC06b model in [11], HPSO model in [14] and AFPSO model in [20]. The detail of comparison is shown in Table 11. The trend in forecasting of enrolments based on the high - order FTS under various orders by MSE value can be visualized in Fig.2.
|
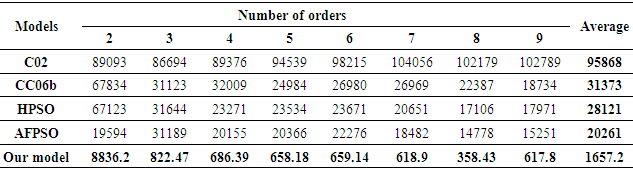
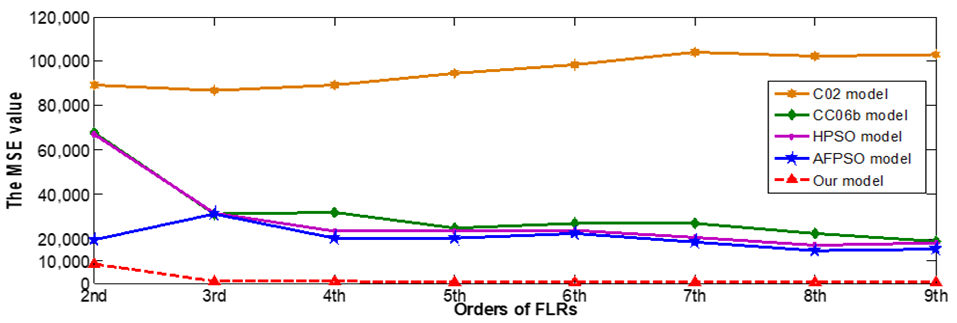 | Figure 2. A comparison of the MSE values for 7 intervals with various high-order FLRGs |
4.3. Experimental Results for Forecasting TAIFEX
- The historical data of the TAIFEX [13] are used to perform comparative study in the training and testing phases. In order to verify forecasting effectiveness, the proposed model is compared with those of corresponding models for various orders and different intervals. The forecasted accuracy of the proposed method is estimated using the function MSE (8).
4.3.1. Experimental Results in the Training Phase
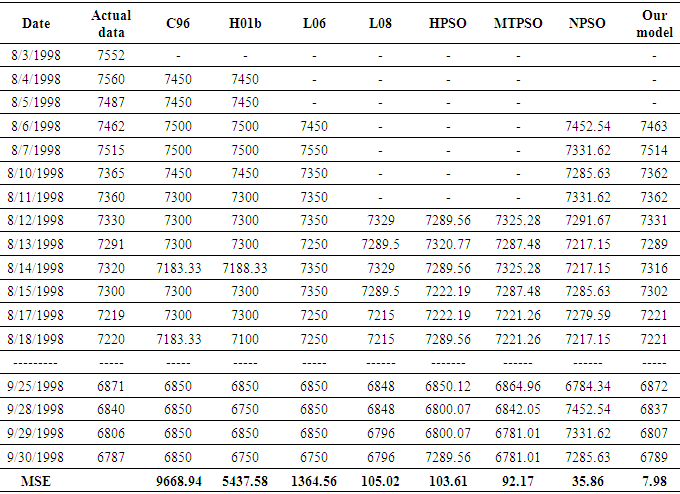
- In this subsection, the proposed method is applied to forecast the TAIFEX from 8/3/1998 to 9/30/1998. To verify the superiority of the proposed model under various high-order FLRGs and different numbers of intervals, existing forecasting model, viz., C96 model [3], H01b model [4], L06 model [12], L08 model [13], HPSO model [14], NPSO model [15] and MTPSO model [16] and are selected for comparison. During simulation with parameters are expressed in column 3 of Table 7, the number of intervals is kept fix (number of intervals =16) for the existing model and the proposed model. A comparison of the forecasted results using MSE criteria in (8) is shown in Table 12.
|
|
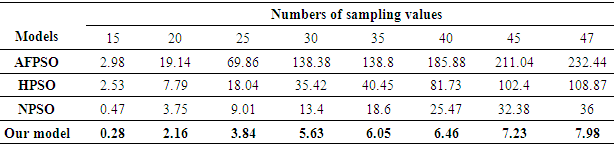
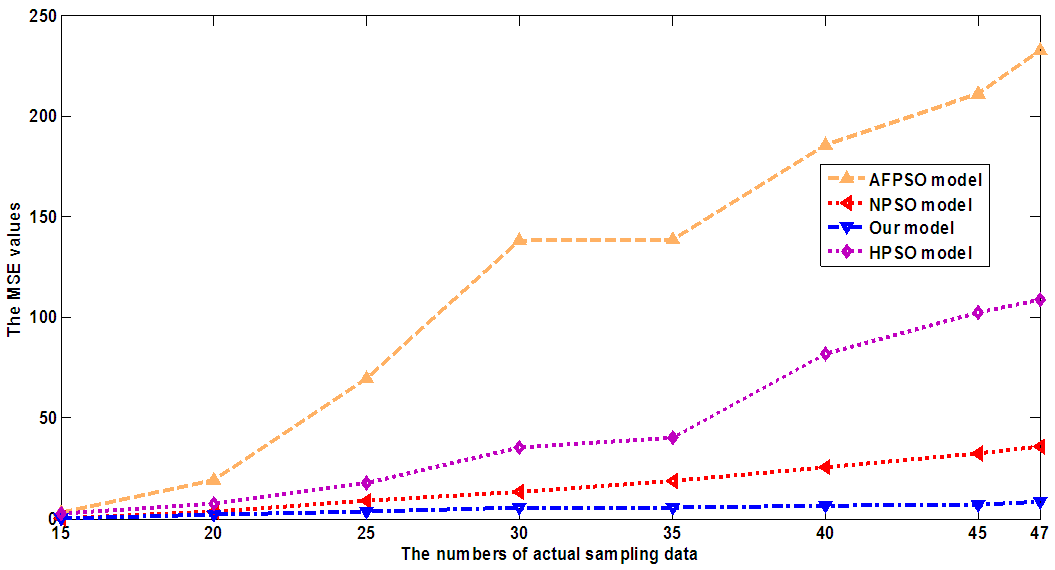 | Figure 3. A comparison of the MSE value between our model and the previous methods: AFPSO, HPSO, NPSO models based on the 3rd-order FTS under number of intervals of 16 with different number of samples |
4.3.2. Experimental Results in the Testing Phase
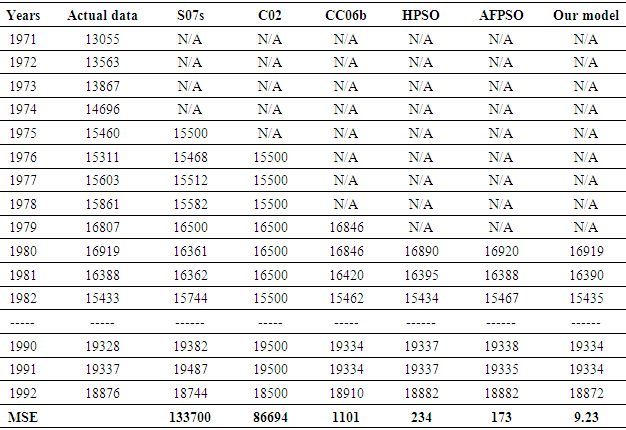
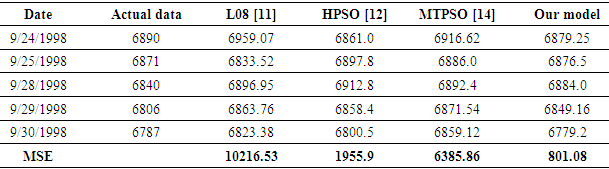
- To verify the forecasting accuracy for future TAIFEX, the historical data of the TAIFEX index are separated two parts for independent testing. The first part is used as training data set and the second part is used as the testing data set. Based on the historical data for the past days, we can forecast the new TAIFEX index for the next day only. In this study, the historical data of the TAIFEX from 8/3/1998 to 9/23/1998 is used as the training data set and the historical data of the TAIFEX index from 8/24/1998 to 9/30/1998 is used as the testing data set. For example, to forecast the new data of date 9/24/1998, the data under days 8/3/1998 ~ 9/23/1998 are used as the training data set. Similarly, a new data of date 9/25/1998 can be forecasted based on the data under dates 8/3/1998 ~ 9/24/1998. Table 14 shows a comparison for actual data and the forecasted results of the L08 model in [13], HPSO model in [14], MPTSO model in [16] and the proposed model which use 16 intervals with the 3rd - order FLRGs.
|
5. Conclusions
- In this paper, we have presented a hybrid forecasting model in academic enrolments forecasting and the TAIFEX prediction based on two advanced methods, the high – order TV-FLRGs and PSO algorithm. In order to improve the forecasting accuracy of two models; the HPSO model and NPSO model, we consider the appearance history of the fuzzy sets on the right-hand side of the same fuzzy relation to generate high –order TV-FLRGs. Furthermore, we also consider more information within all next states of all fuzzy logical relationships to calculate the forecasting output for them by proposed defuzzification rule. Then, a novel hybrid forecasting model based on aggregated high – order TV-FLRGs and PSO is developed to adjust the length of each interval in the universe of discourse with aim to increase forecasting accuracy. The empirical results show that the proposed model not only obtains higher forecasting accuracy for forecasting the enrolments of University of Alabama than the existing methods, but also supplies an effective tool for forecasting stock markets based on high - order FTS model for both the training and testing phases. The detail of comparison was presented in Table 6-14, Fig. 1, Fig. 2 and Fig 3.The main contributions of this paper are illustrated in the following. Firstly, we propose fuzzy logical relationships generation method is different from models compared and also show the forecasted accuracy is affected by calculating the forecasting rules from these time-variant fuzzy logical relationship groups. Secondly, the computational results show that the proposed model gets highest forecasted accuracy for the 9th - order FTS model under number of intervals =14 when applied to the enrolment data and also obtains the highest forecasted accuracy for TAIFEX datasets based on the 3rd - order FTS model. Actually, as listed in Table 10 and Table 12 have the MSE value for the proposed model is 9.23 and 7.98 which are the lowest forecast error among the models are compared, respectively.As a result of implementation, it can be seen that the superior forecasting capability compared with existing forecasting models, but the proposed model is a new forecasting model and only tested by the enrolments dataset and the TAIFEX dataset. Hence, the performance of the proposed method can be changed for every different data sets. To continue assessing the effectiveness of the forecasting model, there are two suggestions for future research: The first, we can apply proposed model to deal with more complicated real-world problems for decision-making such as weather forecast, crop production, road traffic accident forecast and so on. The second, we can use type-2 fuzzy time series or hegde algebras combining with more intelligent algorithm to deal with forecasting problems which has more factors. That will be the future work of this research.
ACKNOWLEDGEMENTS
- The authors would like to express thanks to anonymous reviewers for the number of valuable and constructive comments and suggestions. This work was supported in part by the science council of Thai Nguyen University of Technology - Thai Nguyen University, under contract number 110x HĐNCKH-ĐHKTCN.