-
Paper Information
- Paper Submission
-
Journal Information
- About This Journal
- Editorial Board
- Current Issue
- Archive
- Author Guidelines
- Contact Us
Computer Science and Engineering
p-ISSN: 2163-1484 e-ISSN: 2163-1492
2016; 6(2): 33-38
doi:10.5923/j.computer.20160602.03

Page Rank Performance Evaluation of Cluster Computing Frameworks on Cray Urika-GX Supercomputer
 Abstract
 Reference
 Full-Text PDF
 Full-text HTML
Robert W. Techentin 1, Matthew W. Markland 1, Ruth J. Poole 1, David R. Holmes III 2, Clifton R. Haider 1, Barry K. Gilbert 1
1Special Purpose Processor Development Group, Department of Physiology and Biomedical Engineering, Mayo Clinic, Rochester, USA
2Biomedical Analytics and Computational Engineering Group, Department of Physiology and Biomedical Engineering, Mayo Clinic, Rochester, USA
Correspondence to: Robert W. Techentin , Special Purpose Processor Development Group, Department of Physiology and Biomedical Engineering, Mayo Clinic, Rochester, USA.
| Email: |  |
Copyright © 2016 Scientific & Academic Publishing. All Rights Reserved.
This work is licensed under the Creative Commons Attribution International License (CC BY).
http://creativecommons.org/licenses/by/4.0/

Modern “big data” and analytics software platforms offer a variety of algorithms to the analytics practitioner. It is often possible to choose from several available implementations to solve a given set of problems, even on the same set of hardware, within the same software ecosystem, or leveraging completely different software environments. Choices of techniques should be informed by the relative performance and scalability of the implementations, whether or not they run on the same hardware platform. This paper presents a relative performance comparison of three implementations of the popular PageRank graph analytic algorithm running on the Cray Urika-GX high performance analytics appliance. Relative performance and scaling presented here, along with additional information about the problem set and resources available to the analyst, could be used to make an informed decision about which PageRank implementation to choose.
Keywords: Graph theory, Computational efficiency, Parallel Algorithms, Analytical Models
Cite this paper: Robert W. Techentin , Matthew W. Markland , Ruth J. Poole , David R. Holmes III , Clifton R. Haider , Barry K. Gilbert , Page Rank Performance Evaluation of Cluster Computing Frameworks on Cray Urika-GX Supercomputer, Computer Science and Engineering, Vol. 6 No. 2, 2016, pp. 33-38. doi: 10.5923/j.computer.20160602.03.
Article Outline
1. Introduction
- Graph analytics is becoming an increasingly popular approach to realizing value from “big data,” particularly when the datasets are naturally sparse and irregular. Clinical data is a classic example of “big data,” with the “four V” characteristics of volume, variety, velocity and veracity. Veracity is particularly problematic, since medical records and even clinical study data are often incomplete or recorded in incompatible dialects of different medical subspecialties. Even before the inception of integrated fully-electronic medical records in the last century, there have been significant efforts to glean insights from aggregations of patient data [1, 2], but the sparsity and veracity of the data challenged the best statistical analysis and (later) data mining techniques [3, 4]. Tera Computer began developing a new kind of computer system in the early 1990s specifically intended to address sparse problems. The Multithreaded Architecture (or MTA) was based on custom processors with thousands of execution cores and gigantic shared memory. This new kind of machine excelled at processing data with complex and sparse relationships. Cray Inc. brought the massively multithreaded technology to market in their Cray XMT computer system in the mid-2000s, and developed a follow-on XMT2 system that became available in 2011. The custom Threadstorm processors (each processor is a single custom-designed integrated circuit) had uniform access to memory via the SeaStar supercomputer network. An XMT2 with 8,196 cores and 2 TB of memory (Serial Number 2) was installed at Mayo Clinic in 2011, and has been used for a number of studies, including government sponsored research, health care, and computer network defense [5-7]. Graph analytics, statistical computation, and machine learning have all been applied using this specialized hardware.However, specialized hardware, although very capable in its domain, cannot take advantage of the surge of new data analytics algorithms and software generated within academia and industry, which is generally developed for networks of commodity computers. Foundational open source software packages such as Hadoop and Spark have grown into software ecosystems, enabling a huge number of software developers to contribute and improve implementations of analytics algorithms. With these open source frameworks, analytics practitioners can choose among algorithms, different implementations of the same algorithm, or even implementations in disparate software ecosystems. The practitioner’s choices should, however, be informed by an understanding of the relative performance and scalability of analytics techniques available in these environments.In this paper we present an evaluation of the performance of the PageRank algorithm, a classic graph analytic, as implemented in three software ecosystems while running on the same high-performance cluster computing platform. We measured computation time for large graphs of more than a billion edges, and we report strong scaling, where the graph size is held constant and the number of compute nodes varies. This algorithm evaluation approach is similar to algorithm performance comparisons presented in [4] and database comparisons in [8], which explored algorithm optimization in different environments. However, instead of hand-tuning algorithms for each environment, we simply chose implementations available in the various software ecosystems in the same manner as analytics practitioners would do. Analytics workflows are seldom composed of a single algorithm, and thus time spent tuning the raw performance of any given implementation must be balanced against other efforts, including other algorithms, processing, and even data curation.In the following sections, we describe the hardware and software platforms and the nature of the graph datasets and algorithms. We compare computation times and scaling for each of the ecosystems, and suggest guidelines for choosing one implementation over another.
2. Computing Platform
- The Cray® Urika®-GX Agile Analytics Platform, announced in May 2016, is positioned as a fusion of supercomputing technology and enterprise-class open source data analytics frameworks. The hardware platform inherits high performance computing (HPC) features from Cray’s computational cluster supercomputers, with modifications suitable for “big data” enterprise analytics. This is the third generation Cray data analytics platforms, combining graph analysis and “big data” mining technologies from the Urika-GD “Graph Discovery” appliance and the Urika-XA “Extreme Analytics” platform. This new machine supports several different open source and proprietary software ecosystems, with cluster resource management features that allow them to be run in any combination on independent dynamically allocated partitions.Individual cluster nodes provide substantial computational resources, with up to 32 cores of Intel® Xeon® processors and 256 GB of DRAM. A single rack contains up to 48 compute nodes which are clustered by the Cray Aries™ supercomputing network, providing a bisection bandwidth of 378 GB/s. The computational cluster is augmented by disk storage on every compute node, with both solid state and spinning disk drives providing over 200 TB of local storage distributed throughout the rack.The Urika-GX provides three software ecosystems for data analytics: Hortonworks Data Platform (HDP™) Hadoop®; the Spark™ Ecosystem; and the proprietary Cray Graph Engine. Hadoop and Spark are open source and widely used in the data analytics community. The Cray Graph Engine is a direct descendent of the Urika-GD “graph discovery” appliance software, providing a semantic graph database using Resource Description Framework (RDF) [9] triples to represent data, and the SPARQL query language [10] and built-in graph algorithms to support discovery and analysis. The ecosystems can share the Hadoop Distributed File system (HDFS) or an attached Lustre® file system. Application productivity tools (e.g., Jupyter Notebooks) are layered on top of analytics programming environments, including Java, Scala, R, and Python.In addition to three data analytics ecosystems, the system offers computational supercomputer software development environments, including compilers and libraries for multithreaded (e.g., OpenMP), multiprocessor (e.g., MPI) and shared memory (e.g., Partitioned Global Address Space, or PGAS) parallel processing. While these resources can be valuable for data analytics workflows, they were not addressed in this study.
3. Graph Data Generation
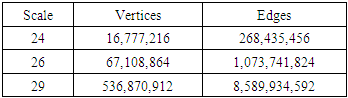
- Recursive MATrix (R-Mat) graphs [11] have a power law distribution of edges (i.e., a small number of highly connected vertices) and have structure similar to social networks and other real-world datasets. With a small number of parameters, graphs can be synthesized with specific characteristics, matching models such as Erdős-Rényi or Pennock, and of arbitrarily size. The datasets for this evaluation were synthesized with the graph generator from the Graph500 benchmark suite [12] using the default parameters A=0.57, B=0.19, C=0.19, D=0.05 and an edge factor of 16. The generated graphs were undirected and contained duplicate edges. The Graph500 benchmark defines problem size in terms of the “scale” of the graph, where there are 2scale vertices and 16 times as many edges as vertices. A “toy” problem is defined as scale 26 and having approximately one billion edges. A “small” graph, at scale 29, could be stored in as little as 128 GB of memory when edges are represented as pairs of 64-bit integer vertices. Table 1 summarizes the dataset sizes for this study. The scale 24 graphs were used as software test cases, while scale 26 and 29 were employed in the study.
|
4. Algorithm Selection
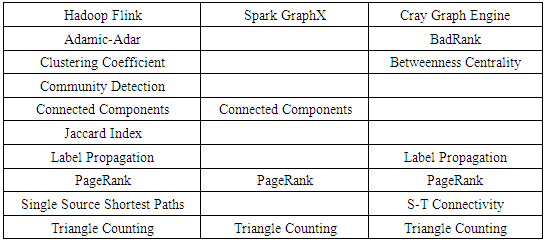
- Many different graph algorithms have proven useful in data analytics, but there is no general consensus on an essential subset of “the most important” algorithms. Analytics software packages and libraries usually provide several algorithms, often optimized for their particular environments. Instead of choosing a specific algorithm and then implementing, debugging and tuning code to match each of the software ecosystems, we simply selected algorithms from the provided packages. The lists of available graph algorithms for the three ecosystems, presented in Table 2, had surprisingly little overlap, with only two algorithms available in all three frameworks. Because it is well known and widely implemented, we chose the PageRank algorithm [13] to compare the three software ecosystems. It should be noted, however, that although PageRank has been widely implemented, efficient execution using parallel processing or acceleration remains an active research area [14-16].
|
5. Run Time Results
- PageRank was run on each size graph, using 4, 8, 16, and 32 compute nodes to evaluate strong scaling of each software ecosystem. Only minimal performance tuning was conducted, using command line options: the algorithm implementations themselves were not modified. Tuning parameters depend on the ecosystem features. The Hadoop Flink PageRank was run with 32 cores per compute node, while CGE was launched with 16 images per node, which is roughly equivalent to cores. Spark GraphX parameters, on the other hand, were oriented towards the problem space and memory, specifying 256 edge list partitions and 192 GB memory per executor.Flink does not have tuning parameters itself, but relies on characteristics set by the YARN resource manager. The YARN configuration on the Urika-GX limited the number of tasks per task manager to 8, so in order to take advantage of 32 cores per compute node, it was necessary to use 4 task managers per node with 8 tasks per manager. For larger graphs, running multiple task managers failed with insufficient memory, so it was necessary to reduce the number of task managers to one per node.Spark GraphX tuning parameters are extensive and complex. For this study, we focused on balancing data partition counts and memory allocation across executors. GraphX launches one executor on each compute node. We initially allocated 192 GB of memory for each executor, leaving some for operating system functions. Empirical tests with the scale 29 graph data and 32 compute nodes indicated that 29 data partitions per compute node provided optimal performance. Each data partition is processed by one executor thread, so this configuration utilized 29 cores for data processing and left 3 cores for operating system functions. However, the overhead of running 29 data partitions required reducing memory allocation to 128 GB.CGE has only two tuning parameters available to the command line database launcher: the number of compute nodes and the number of images per node. Images are roughly equivalent to cores. The shared memory programming model of co-array C++ allows many processes in a compute cluster to share a partitioned global address space. Each process is aware of its local memory partition, and remotely accesses the global partitions when necessary. Remote memory accesses take advantage of the Cray Aries interconnect features such as fine granularity and atomic operations. Varying the number of images per node changes the balance between the local and global memory partitions, and can affect performance. For this study we fixed the number of images at 16 as recommended by Cray as a starting point for reasonable performance.Run times for the scale 26 graph are presented in Figure 1. With four compute nodes, CGE was only slightly faster than Spark, and Hadoop was 10X slower than both of them. For larger numbers of compute nodes, Hadoop performance improved substantially, while Spark performance actually deteriorated. CGE was consistently 5X faster than the others.
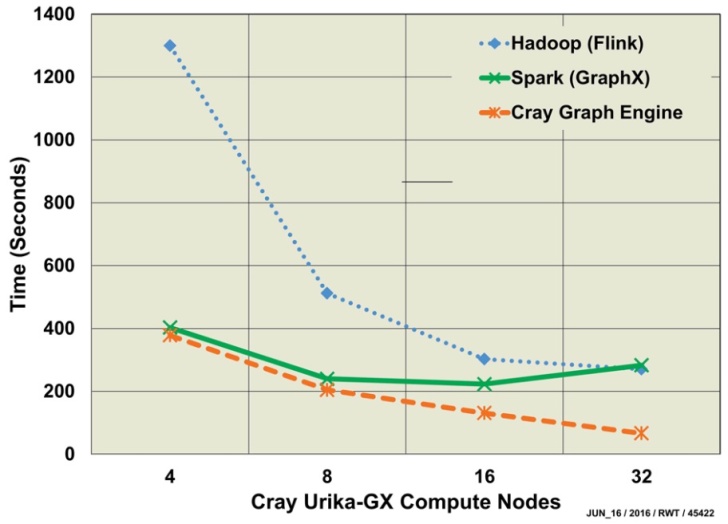 | Figure 1. PageRank Run Time Comparison for Scale 26 Graph on Urika-GX shows strong scaling (varying number of compute nodes) for 100 Iterations of Hadoop Flink, convergence of Spark GraphX, and convergence of Cray Graph Engine (45422) |
|
6. Discussion
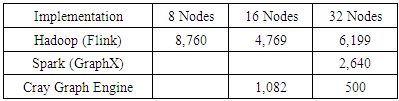
- PageRank run time trends were similar to our expectations, with Hadoop yielding the lowest performance and CGE providing the fastest solution. The poor scaling for Spark GraphX was somewhat surprising, since we expected each implementation to perform better with more processors and memory. This result may be due to the relative immaturity of the GraphX software, or it might indicate a need for additional performance tuning, perhaps related to graph partitioning. To the best of our knowledge, these software ecosystems have not been rigorously tested against datasets this large, and we surmise that good performance may require both tuning and modifications to the implementation.Run times for both scale 26 and 29, exemplified by Figure 1, show strong scaling for both Hadoop Flink and the Cray Graph Engine implementations of PageRank. Spark GraphX scaled poorly for this example. The clear winner in raw computation time and scaling is CGE, which can complete 5X faster than the other implementations. As a native C++ application, CGE takes full advantage of the Cray Aries supercomputer interconnect, which includes low-level primitives that accommodate the inevitable latencies that plague clustered computer systems. The Aries network features and the shared memory model may also account for the superior scaling of CGE. It must be noted, however, that only minimal tuning was performed for this study, as would be typical of business environments where costs and schedules often constrain the analytics practitioner to simply achieving an expedient answer. Academics may further tune open source implementations or develop new algorithms, but those improvements would not be generally accessible for some time. Run times, however, do not tell the entire story. PageRank is an iterative algorithm. Both Spark and CGE run the computation iteratively until a convergence criterion is achieved. Hadoop, on the other hand, runs for a specified number of iterations regardless of convergence. We were able to compare Spark and Hadoop running 100 iterations each, and observed that Hadoop’s Flink implementation was actually 3X-5X faster than Spark’s GraphX for the same number of iterations. An in-depth analysis would be required to determine convergence, since an equal number of iterations might not produce equivalent results from the two implementations.Raw computation time of the PageRank algorithm would very likely not be the only issue driving the practitioner’s choice of implementation. Run time for PageRank (or any algorithm) may be only one small part of a complex analytical workflow that includes data curation, format translations, statistical analysis of algorithm output, data exploration, and presentation of results. For this specific use case, running PageRank on a scale 29 graph, the run time difference of 10 versus 100 minutes may be sufficient motivation to integrate CGE’s PageRank into an established Hadoop workflow that includes data curation, post-PageRank statistics and graphical presentation of results.There are drawbacks to each of these PageRank implementations which must be considered by analytics practitioners. The Spark execution environment offers a large number of tuning parameters, and individual algorithms may have additional controls. The wide variety of tuning parameters can enable performance improvements, but the complexity of tuning and the interrelationship between parameters can make optimal performance elusive. Another performance consideration for both Hadoop and Spark is that they rely upon Java Virtual Machines, which can introduce their own complexities into optimization. For example, changing memory allocations or data partitions to optimize one set of parameters may change the amount of data shuffling and even influence garbage collection behavior of the underlying JVM. Changing the problem size or hardware allocation may invalidate optimizations found for the previous run.In addition to performance considerations, there are practical issues of using the different environments. On the Cray Urika-GX, Hadoop job resources are managed by YARN and require the user to allocate and de-allocate resources manually. Spark and CGE will dynamically allocate resources and release them when the job completes. Data file formats can also be an issue that affects the analysis effort. Both Hadoop Flink and Spark GraphX use a simple integer edge list to describe a directed graph. CGE, however, requires data in RDF format, and even when the analysis requires only a simple directed graph, it is necessary to translate the data with the correct grammar.
7. Conclusions
- The Cray Urika-GX system provides several useful software ecosystems for performing analytics on large and complex datasets, including Hadoop, Spark, and the Cray Graph Engine. A particular algorithm may be uniquely implemented take advantage of characteristics of the software ecosystem, offering substantially different performance characteristics, even when running on the same hardware. If there is a choice of ecosystems, or if the various ecosystems can be integrated into a hybrid application, comparison and validation of the implementations is appropriate. We evaluated the performance of the PageRank algorithm implemented in the Hadoop Flink package, the Spark GraphX library, and the Cray Graph Engine using synthetic datasets from the Graph500 benchmark. We presented strong scaling results for run times on graphs of up to 8 billion edges, and showed that performance could vary by more than 10X between the implementations. From these results, we concluded that analytics practitioners may choose implementations of various algorithms from different software ecosystems, evaluate their performance on relevant problem sets, and determine if performance differences warrant integration of the specific implementations into their analytics workflows. While graph algorithm research and optimization is still an active area of research, practitioners should take advantage of readily available implementations to improve their workflows.
ACKNOWLEDGEMENTS
- The authors thank T. Funk and S. Neumann for artwork and manuscript preparation. This work was funded by DARPA’s Microsystems Technology Office.