-
Paper Information
- Paper Submission
-
Journal Information
- About This Journal
- Editorial Board
- Current Issue
- Archive
- Author Guidelines
- Contact Us
Computer Science and Engineering
p-ISSN: 2163-1484 e-ISSN: 2163-1492
2016; 6(2): 25-32
doi:10.5923/j.computer.20160602.02

Welding Sequence Optimization through a Modified Lowest Cost Search Algorithm
 Abstract
 Reference
 Full-Text PDF
 Full-text HTML
Romero-Hdz J.1, Saha B. N.2, Toledo G.1
1Centro de Ingeniería y Desarrollo Industrial (CIDESI), México
2Centro de Investigación en Matemáticas (CIMAT), México
Correspondence to: Romero-Hdz J., Centro de Ingeniería y Desarrollo Industrial (CIDESI), México.
| Email: |  |
Copyright © 2016 Scientific & Academic Publishing. All Rights Reserved.
This work is licensed under the Creative Commons Attribution International License (CC BY).
http://creativecommons.org/licenses/by/4.0/

Welding deformation plays a negative role in metal joining processes. It greatly impacts industries in several ways such as constraints in the design phase, reworks, quality cost and overall capital expenditure. Welding sequence optimization significantly reduces the welding deformation. Selecting an optimal welding sequence can be considered as a combinatorial optimization problem with many possible configurations which often make it computationally very expensive. This paper reports the development and implementation of a Modified Lowest Cost Search (MLCS) algorithm which produces a pseudo-optimal welding sequence. Welding simulation experiments were conducted on a plate-tube skewed T-joint using Gas Metal Arc Welding (GMAW) which is commonly used in heavy earth-moving, construction and agricultural equipment. Experimental results demonstrate that proposed MLCS algorithm yields less deformation and effective stress.
Keywords: Optimal welding sequence, Welding sequence optimization, Lowest cost algorithm, Welding deformation
Cite this paper: Romero-Hdz J., Saha B. N., Toledo G., Welding Sequence Optimization through a Modified Lowest Cost Search Algorithm, Computer Science and Engineering, Vol. 6 No. 2, 2016, pp. 25-32. doi: 10.5923/j.computer.20160602.02.
Article Outline
1. Introduction
- Welding is the most common metal joining process due to its extensively applications on a wide range of industries such as automotive, shipbuilding, aerospace, construction, pipelines, nuclear, pressure vessels, heavy and earth-moving equipment (Masubuchi, 1980; Islam et al., 2014). When it comes to welding, deformation and residual stress are one of the major industrial concerns. Because it derives several negative effects, principally on fit-up processes and loss of structural integrity. Welding deformation and residual stress can be computed accurately with several methods. For fusion processes like GMAW, the mathematical model for the heat source is based on a Gaussian distribution of power density (Goldak et al., 1984). Finite Element Methods (FEM) are the most suitable and extensive researches have been conducted to compute deformation and residual stress. FEM methods can work under various welding conditions and geometric configurations. However, it is inherently very computationally expensive. Welding sequence has a significant effect on deformation pattern, typically it is selected by experience and a simplified design of experiments. Therefore the selected sequence is not necessarily the optimum choice (Kumar et al., 2011). An optimal welding sequence can be obtained through a full factorial design procedure. For full factorial design, the total number of welding configuration can be counted by
 where n and r are the number of welding directions and beads (seams or segments) respectively. For example, the total number of welding configurations for 5 beads and 2 directions is 3840 and it grows exponentially with the number of welding beads. It has been found that for a complex weldment in an aero-engine assembly might have 52-64 weld segments (Jackson and Darlington, 2011). Hence, the full factorial design is impractical for industrial practice since the FEM simulation is computationally very expensive. In this research, we first developed and implemented a Modified Lowest Cost Search (MLCS) algorithm which produces the pseudo-optimal welding sequence. The MLCS algorithm is similar to lowest-cost-first Search algorithm (Russell and Norvig, 2003). However, the differences between the MLCS and the lowest-cost-first search are as follows. For the lowest-cost-first search the total cost for reaching a particular node from the source is the sum of the path or arc costs from the source to that particular node. However, the welding deformation is not additive in nature and cannot be computed the total deformation for a particular node as the sum of the inner arc or path costs from the source to that particular node. If we need to find the deformation for a particular node, we have to perform the complete welding sequence together required to reach that node from the source, even if we know ahead all the deformations for all intermediate arc or path costs. Also the deformation distribution from the source to any particular node is very hard to be predictable. One of the possible solutions is to find the optimal sequence using lowest-cost first search in an exhaustive manner which is equal to a full factorial design procedure and hence, it is impractical for the industrial applications. In this paper, we report the following contributions by adapting the lowest-cost-first search for the welding sequence problems. 1) Traditional lowest cost-first search terminates when the goal is achieved or you visit all the nodes in a graph. Therefore, you need to construct the graph first and then traverse all possible shortest paths until you reach the goal or visit all the nodes in the graph. In the MLCS algorithm we construct and traverse the graph in an interleaved fashion. We traverse the graph as soon as the part of the graph is constructed. At each intermediate step, we choose the direction which gives the immediate shortest path. We terminate the process as soon as we achieve a complete sequence (performing the welding to all the beads once) and thus we converge MLCS search much faster than the exhaustive lowest cost-first search. 2) Since the MLCS searches locally, it does not guarantee a global minima and find an optimal sequence. Rather we conclude that we find a pseudo-optimal welding sequence. 3) We carried out a welding simulation experiment on a plate-tube skewed T-joint using GMAW which is commonly used in heavy earth-moving, construction and agricultural equipment. The MLCS algorithm finds a sequence which generates less deformation over single pass welding. The MLCS algorithm not only generates overall less deformation on the total plate-tube skewed T-joint structure, but also yields less Von Mises (effective) stress on the critical regions of the structure which are a very important quality factor for the weldment. The organization of the rest of the paper is as follows. Existing optimization methods for selecting the optimal welding sequence is given in section 2. In section 3 thermal analysis and mechanical analysis are briefly explained. Section 4 presents our developed MLCS algorithm. Experiments results and discussions are demonstrated in section 5. Finally we present our conclusion in Section 6.
2. Literature Review
- Several optimization methods have been developed to choose an optimal welding sequence. Among them, one of the most popular methods is genetic algorithm (GA). (Mohammed et al., 2012) presented an optimization procedure based on the principles of GA, in which the FEM is used to produce the distortion data and lead the evolution of the GA. (Kadivar et al., 2000) provided a solution with GA where they neglects the effect of the welding sequence on the maximum residual stress and only the distortion is used as an objective function. (Damsbo and Ruboff, 1998) proposed a hybrid GA incorporating domain specific knowledge in order to optimize welding sequence. Instead of distortion and residual stress, they used the path length as the objective function. (Islam et al., 2014) presented a coupled GA-FEM approach. They considered the maximum distortion as the objective function and other design variables such as welding direction and upper and lower bounds of welding process parameters were considered in the model. (Warmefjord et al., 2010) proposed several alternative approaches to GA in spot welding sequence selection by choosing general simple guidelines, minimize variation in each step, sensitivity and relative sensitivity. (Park and An, 2015), presented a modified Joint Rigidity Method, where the welding sequence is decided by calculating the resistance to angular bending under a unit moment. Optimal sequence starts with more rigid joints and moves progressively towards less rigid joints would result in less distortion. (Voutchkov et al., 2005) proposed a surrogate model to reduce the computational expenses of sequential combinatorial FEM problems by ignoring the effects of cooling on welding deformation. However, the cooling effects cannot be avoided for all weldment geometries. (Kim et al., 2004) developed two types of heuristic algorithms called construction algorithm and an improvement algorithm where heuristics for the traveling salesman problem are adapted to the welding sequence optimization problem. The algorithms proposed by (Kim et al., 2004) are not taking into account the inherent heat-caused distortion with the aim of minimizing the time required for a process task.
3. Welding Simulation Framework
3.1. Thermal Analysis
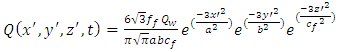
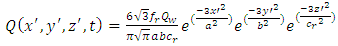
- Weld process modeling (WPM) is a very complex task. The physics of heat generation has as a fundamental principle the law of conservation of energy. Typically, the complexity of the heat generation physics in the weld puddle is simplified by using a heat input model or well known as Welding simulation models. The classical approach in Computational Welding Mechanics (CWM) is to ignore fluid flow and use a heat input model where heat distribution is prescribed. The given heat input replaces the details of the heat generation process and focus on larger scales. Moreover, the modeling of fluid flow and pertaining convective heat transfer may be integrated with a CWM model.The most common used model for fusion welding processes is the well known Goldak double ellipsoidal heat distribution Figure 1. This heat input model combines two ellipsoidal heat sources to achieve the expected steeper temperature gradient in front of the heat source and a less steep gradient at the trailing edge of molten pool. This two heat sources are defined byFront heat distribution:
 | (1) |
 | (2) |
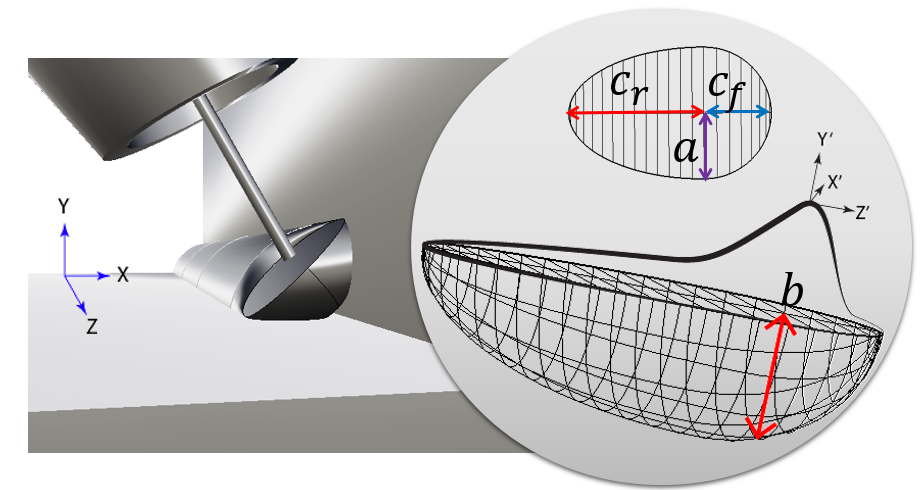 | Figure 1. Goldak double ellipsoidal model |
 is the fraction factor of heat deposited in the front part,
  is the fraction factor of heat deposited in the rear part. Those factors must satisfy the relation
  .
.  is the width,
  is depth,
  is the length of the rear ellipsoid y
  is the length of the front ellipsoid.These parameters are physically related to the shape of the weld puddle. Width and depth are commonly taken from the cross section, the authors recommend to use a half of parameter
  for the front fraction and two times
  for the rear fraction. For a linear trajectory along axis
  , is defined by
  :
:  | (3) |
 actual coordinate
  ,
,  is travel speed,
  is a delay factor and
  is the time. The heat available from the heat source is defined by:
  | (4) |
 heat source efficiency,
  is the current
  ,
,  is the voltage
  . Thus the heat input model in CWM must be calibrated with respect to experiments or obtained from WPM models. Therefore, the classical CWM models have some limitations in their predictive power when used to solve different engineering problems. For example, they cannot prescribe what penetration a given welding procedure will give. The appropriate procedure to determine the heat input model is therefore important in CWM [Lindgren, 2007].
3.2. Mechanical Analysis
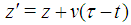
- The temperature history from the thermal analysis was used as a series of loads in the structural analysis. In this phase, the temperature history from the thermal cycle of each node is taken as an input and it is used as a node load with temperature dependent material properties. The solid model mesh used for the mechanical analysis was also used for the thermal analysis where each increment of weld deposition corresponded to one load step. Because phase transformation has an insignificant effect on the welding residual stress and distortion, the total strain
 (assuming negligible contribution from solid state phase transformation) can be decomposed into three components as follows:
 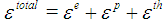 , where
  and
and  represent elastic, plastic and thermal strain respectively. In the welding process, changes in stress caused by deformation are assumed to travel slowly compared to the speed of sound. So, at any instant, an observed group of material particles is approximately in static equilibrium, i.e., inertial forces are neglected. In rate independent plasticity, viscosity is zero and viscous forces are zero. In either the Lagrangian or the Eulerian reference frame, the partial differential equation of equilibrium is, at any moment is given by the conservation of momentum equation that is mentioned below [Goldak, 2010].Conservation of Momentum Equation
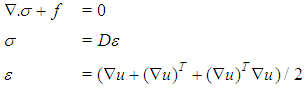 | (5) |
 and
and  represent partial differential, cauchy strss, total body force, temperature dependent material property (elastic matrix relevant to the modulus of elasticity and Poisson's ratio), the Green-Lagrange strain and displacement vector respectively.
  represents the displacement gradient. The mechanical model is based on the solution of three partial differential equations of force equilibrium illustrated in Equation 5. In the FEM formulation, Equation 5 is transformed and integrated over the physical domain, or a reference domain with a unique mapping to the physical domain [Goldak and Akhlaghi, 2005]. Simufact solves this partial differential equation for a viscothermo-elasto-plastic stress-strain relationship. The initial state often is assumed to be stress free. Dirichlet boundary conditions constrain the rigid body modes. The system is solved using a time marching scheme with time step lengths of approximately 0.1 second during welding and 5 second during cooling phase.
4. Modified Lowest Cost Search (MLCS)
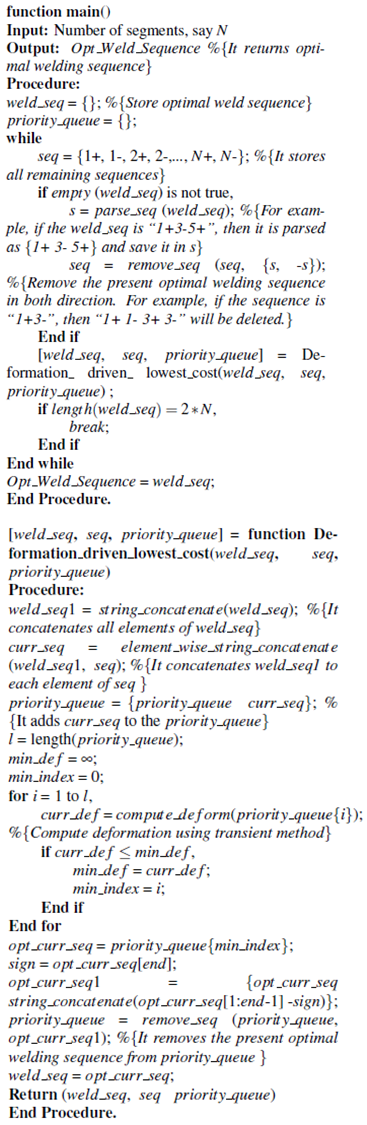
- The MLCS algorithm for selecting the welding sequence is demonstrated as follows.STEP 1. Let the number of weld segments be N. First compute the welding deformation for each element of A = {1+, 1−... N+, N−} separately. Here, i+ denotes that the welding on segment i(i = 1, 2,..., N) will be conducted from right-to-left. Consider a graph G with root node as a dummy node. Construct a node in G for each element of A and join it with the root node. Store the deformation for each element of A in the respective node in G as shown in Figure 2. Push the sequence of A in a priority queue Q with the sequence having the deformation with increasing order.STEP 2. Pop the first node of Q, i.e., the node with minimum deformation, say i+. Then construct a new sequence, say A1 = {i + 1+, i + 1−,..., i + N+, i + N−}(removing i+ and i+ from A and then add i+ in front of each element of A).STEP 3. Perform welding for these new sequences. Add new nodes required for these new sequences and update the graph G. Store the deformation for each new sequence in the respective node in G. Delete i+ and i− from Q and push these new sequences in the priority queue Q.STEP 4. Expand the graph G by performing the step 2 and 3 iteratively until a complete sequence (when the welding operation is performed once on all the segments) is found. Let this sequence be S. Then S is considered the pseudo-optimal sequence found by the proposed MLCS method. The pseudo-code for the algorithm is given in Algorithm 1 and an example graph is illustrated in Figure 2.Time Complexity. For the best case scenario, the time complexity is 2(N + N − 1 + N − 2 + ... + 1) = N (N + 1) = O (N2), where N is the number of weld segments. For the worst case scenario, the time complexity 2N + 2N.2(N − 1)+ 2(N − 1).2(N − 2)+ ... + 4.2) =
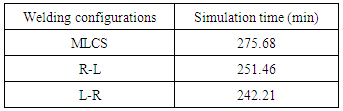
 which is equal to the full factorial design. However, we found in our experiment that the time complexity is much less than the worst case scenario. For our experiment, in a 5 weld segments and 2 welding directions for plate-tube skewed T joint using GMAW simulation, we found the pseudo-optimal sequence after 35 configurations, where full factorial design or lowest-cost-first search finds the optimal sequence after 3840 welding configurations.
5. Experimental Results and Discussions
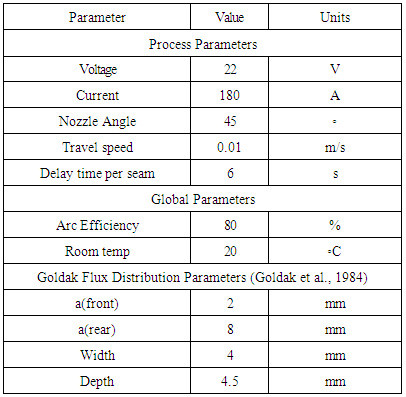
- We conducted a welding simulation experiment on plate-tube skewed T-joint as shown in Figure 1 using GMAW which is commonly used in heavy earth-moving, construction and agricultural equipment (Webster et al., 2008). The use of skewed T joints for both tubular and non-tubular connections has been more popular since the steel structure geometries become more complicated such as bridges, hydraulic tanks and other pressure vessels (Green and Schlafly, 2011). We used Simufact Welding® software in our experiment. For details about the software, please see (Islam et al., 2014). We implement MLCS method for choosing the welding sequence and we compare the efficacy of MLCS method with single pass positive (right-to-left) (R-L) and single pass negative (left-to-right) (L-R) welding configurations. We use the same parameters for all the configurations that are provided in Table 1. We divide the welding bead into five segments as shown in Figure 1. Proposed MLCS generates the graph as shown in Figure 2.
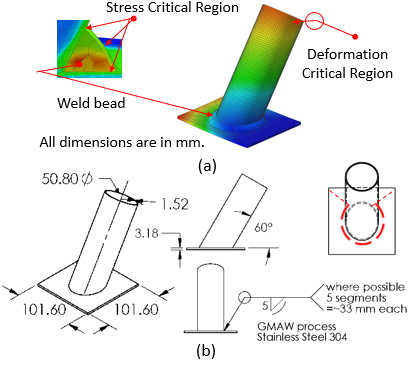 | Figure 1. Plate-tube skewed T-joint used for the experiment. (a) Plate-tube skewed T-joint in Simufact welding software. (b) Engineering drawing of the Plate-tube skewed T-joint |
|
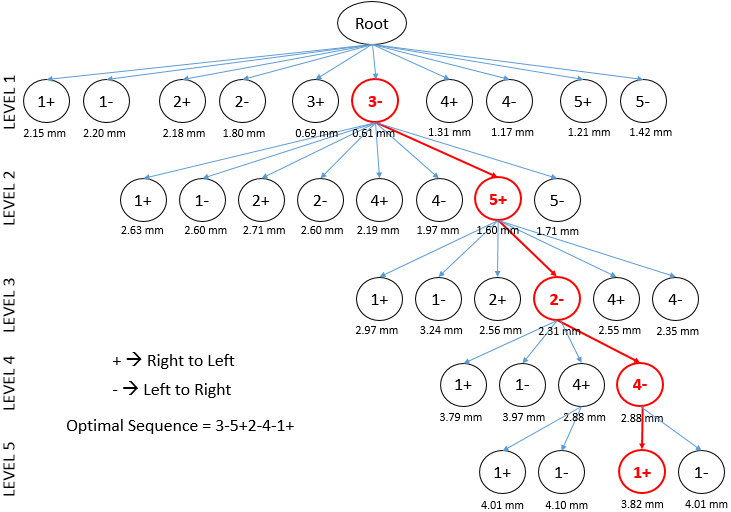 | Figure 2. Proposed Modified Lowest Cost Search (MLCS) graph |
|
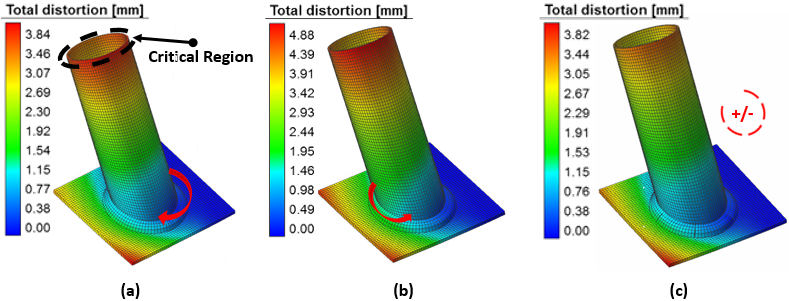 | Figure 3. Deformation distribution of (a) single pass positive (R-L), (b) single pass negative (L-R), and (c) MLCS |
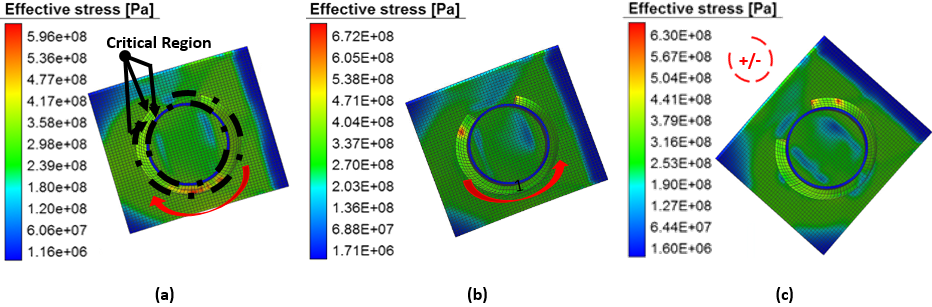 | Figure 4. Von Mises stress distribution of (a) single pass positive (R-L), (b) single pass negative (L-R), and (c) MLCS |
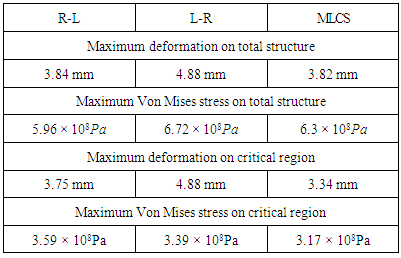
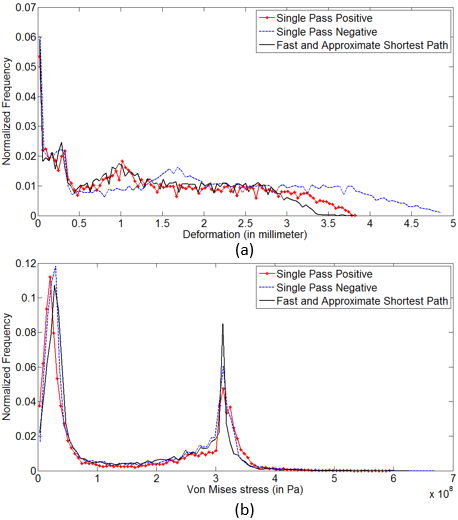 | Figure 5. Histogram of (a) Deformation and (b) Von Mises stress on total structure |
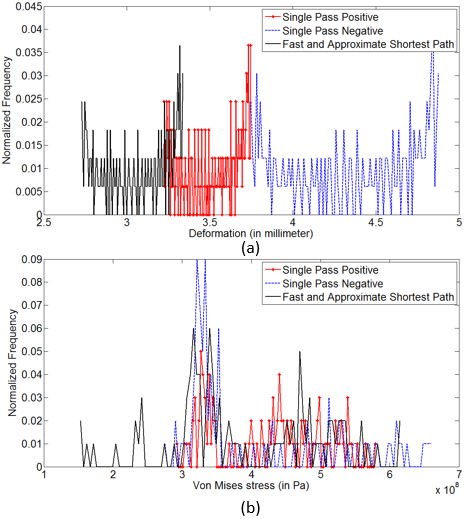 | Figure 6. Histogram of (a) Deformation and (b) Von Mises stress on critical region |
|
6. Conclusions and Future Work
- In this paper, the MLCS has been developed and implemented for choosing the pseudo-optimal welding sequence. Choosing the optimal welding sequence requires an exhaustive search which is inherently very expensive. In addition, the computational expenses grow exponentially with the number of welding beads. The MLCS algorithm can be used as an alternative that reduces the number of welding configurations significantly. Experimental results demonstrate that the MLCS algorithm, not only generates less total deformation and effective stress, but also leads to less deformation and effective stress on the critical region than single pass configurations which is an important factor for measuring the overall quality of the weldment. In future, we would explore an admissible heuristic using joint rigidity method (moment/ angle of rotation) (Park and An, 2015) of the total structure and explore A* search (Russell and Norvig, 2003) for choosing the optimal welding sequence.
ACKNOWLEDGEMENTS
- The authors gratefully acknowledge all the support provided by CONACYT (The National Council of Science and Technology).
Algorithm 1