Oloja S. V1, Kuboye B. M2, Obolo O. A2
1Department of Math/Stat/CIS, Achievers University, Owo, Ondo State, Nigeria
2Department of Computer Science, Federal University of Technology, Akure, Ondo State, Nigeria
Correspondence to: Oloja S. V, Department of Math/Stat/CIS, Achievers University, Owo, Ondo State, Nigeria.
| Email: |  |
Copyright © 2012 Scientific & Academic Publishing. All Rights Reserved.
Abstract
Code Division Multiple Access is a modulation and multiple access schemes based on Spread Spectrum Communication while Global System for Mobile Communication is of digital cellular that is based on Time Division Multiple Access and Frequency Division Multiple Access. This paper assesses both CDMA and GSM network qualities in South West, Nigeria. Some marketing mix strategies of CDMA and GSM operators were put together in a questionnaire and were administered to respondents of different status, locations and different states. Consequently, hypotheses relevant to the study were formulated for test. These hypotheses were later analyzed and tested using Chi-Square. The results showed tariff as the determinant factor for subscribers to choose their preferred network.
Keywords:
CDMA, GSM, Chi-Square, Hypotheses, Communication
Cite this paper: Oloja S. V, Kuboye B. M, Obolo O. A, Assessment of Subscriber’s Preference to GSM and CDMA in South West Nigeria, Computer Science and Engineering, Vol. 4 No. 1, 2014, pp. 1-6. doi: 10.5923/j.computer.20140401.01.
1. Introduction
Nigeria is often identified as the fastest-moving economy, and one of the most advanced ICT market sectors in Africa. Little wonder it easily became the telecom hot spot[1]. The deregulation of the communication sector led to the issuance of the first Global System for Mobile (GSM) licence, by the Nigerian Communication Commission (NCC), on 9 February, 2001, after a much-lauded bid sessions earlier, to MTN Nigeria. MTN consequently made its first GSM call on May 16, 2001[2], and later launched full commercial presence in Lagos, Portharcourt and Abuja. Following MTN’s monolithic success, and Nigeria being regarded as one of the fastest growing GSM markets in the world[3], other network providers soon put a foot in the door. They included Econet (Zain), Glo, and Etisalat, in that order. Further, some Code Division Multiple Access (CDMA) network providers evolved too, comprising Starcomms, Visafone and Zoom.This development had been explosive, as the NCC comparatively reckons that as at 2001, the number of working lines was approximately 450,000. This jumped to 7 million and over 70 million respectively by August 2004, and December 2009[3]. Nine years on, and with intense competition, the network providers’ focus seems to be shifting from coverage to improved quality. This study seeks to evaluate the performance of GSM and CDMA network generally in the South-West, Nigeria.Specifically, it intends, among others, to: Determine the most patronized GSM network, Ascertain and rank the attributes for GSM network patronage, Determine whether network performance is associated with choice of network by subscriber, Evaluate the significance of network attributes in network preference.Mobile number portability is the new services introduced by Nigeria Communication Commission (NCC) in other to get subscribers opportunities to port to network of their choice. As the network providers are wooing subscribers to their network each claiming that they have better performance than the other. How can we ascertain their claims? This work is set to provide answer for this question raised above. That is, this work will investigate how the performance of each network is seeing by the subscriber. This research work is set to get appropriate performance of different network providers.
2. History of CDMA and GSM Technology
CDMA technology dates right back to the pre-WWII America. Invented by HedyLamarr and George Antheil in the 1940s, it was used to control the movement of torpedoes by means of using multiple radio frequencies. The military used this as their standard means of communication, as it allows them make completely secure broadcasts, known during that time as frequency-hopping, this technology kept changing and evolving till it reached its present-day status. CDMA was patented by Qualcomm and then adopted by all other telecom companies through the course of time.[4]Today, CDMA is vital to carriers such as Sprint, Verizon and GTE. Multi- links started operations in December 1997 as the first private company to rollout fixed wireless phones in Nigeria. The company’s network operation started in Lagos and could boasts of over 100,000 subscribers. Multi-Links was the first evidence of the successful commencement of the liberalization of the Nigerian telecommunications sector. Intercellular was incorporated in December 1992 and began operations in January 1998 rendering limited mobile and fixed wireless services. Its services were available almost in every part of the country. Although it joined the ranks of PTOs relatively late, it is rubbing shoulders with the leaders today. Starcomms provides pre-paid voice and data services to over 145,000 subscribers including retail users, corporate and community centers. The company uses CDMA technology which provides high quality voice and 3G- type telecoms services to its customers. The company is also the first business of its kind to fast track international private equity in Africa. Today, Nigeria is proud of about eighteen CDMA operators providing full mobile and fixed wireless services with a total number of subscribers above 64 million as at February, 2009.[5]
3. History of GSM Technology
One of the most important conclusions from the early tests of the new GSM technology was that the new standard should employ Time Division Multiple Access (TDMA) technology. This ensured the support of major corporate players like Nokia, Ericsson and Siemens, and the flexibility of having access to a broad range of suppliers and the potential to get product faster into the marketplace. After a series of tests, the GSM digital standard was proven to work in 1988. With global coverage goals in mind, being compatible with GSM from day one is a prerequisite for any new system that would add functionality to GSM. As with other 2G systems, GSM handles voice efficiently, but the support for data and Internet applications is limited. A data connection is established in just the same way as for a regular voice call; the user dials in and a circuit-switched connection continues during the entire session. If the user disconnects and wants to re-connect, the dial-in sequence has to be repeated. This issue, coupled with the limitation that users are billed for the time that they are connected, creates a need for packet data for GSM.[6]Since its inception, GSM was destined to employ digital rather than analog technology and operate in the 900 MHz frequency band. Most GSM systems operate in the 900 MHz and 1.8 GHz frequency bands, except in North America where they operate in the 1.9 GHz band. GSM divides up the radio spectrum bandwidth by using a combination of Time- and Frequency Division Multiple Access (TDMA/FDMA) schemes on its 25 MHz wide frequency spectrum, dividing it into 124 carrier frequencies (spaced 200 Khz apart). Each frequency is then divided into eight time slots using TDMA, and one or more carrier frequencies are assigned to each base station. The fundamental unit of time in this TDMA scheme is called a ‘burst period’ and it lasts 15/26 ms (approx. 0.577 ms). Therefore the eight ‘time slots’ are actually ‘burst periods’, which are grouped into a TDMA frame, which subsequently form the basic unit for the definition of logical channels. One physical channel is one burst period per TDMA frame.[7]
4. GSM Network Architecture
Global System for Mobile Communications (GSM) is a digital cellular phone technology based on TDMA that started in Europe and migrated to other continents. GSM defines the entire cellular system, not just the TDMA air interface. In the early 1990s, GSM enabled roaming across European nations for the first time, and today, more than 1.5 billion GSM customers worldwide can phone each other via roaming agreements between the carriers. GSM supports voice calls and data transfer speeds of up to 9.6 kbps, together with the transmission of SMS.[8]
5. Theoretical Construct/Hypotheses
An examination of the marketing mix strategies of the different GSM network providers provided the framework for our hypotheses;Product: Several products abound from different network providers, ranging from MTN’s Xtra Connect, Xtra Cool, Xtrapro; Airtel’s Top-Up, Joli, Padi; Glo’s Easy Talk, Prepaid Classic, Classic Plus; to Etisalat’s Home Zone, Oga Line, etc. This multiplicity is evidently aimed at serving the peculiar needs of different market segments[9].Price: This is the tariff for the use of GSM network services. Following intense competition in the industry, a semblance of price war is discernible in series of deals for existing or new products.Place: This refers to the geographic spread or connectivity of a particular GSM network. Although MTN was a premier network, commencing in Lagos, Abuja and Port Harcourt, other network providers had shown primal presence in other towns. Virtually all network providers hinge their vision largely on Place. MTN’s “everywhere you go”; Glo’s “Africa’s biggest and best network”, and Etisalat’s “world where people’s reach is not limited by distance” are slogans and visions rooted in “Place” (see MTN, Glo and Etisalat websites).Promotion: The foregoing marketing strategies are propagated with the instrumentality of promotions. The network providers are heavy users of different mass media, as well as novelties such as T-Shirts, caps, pen, etc, in their bid to inform and persuade consumers.From the above synopsis on GSM marketing mixes, the following hypotheses relevant to our study are consequently formulated for tests thus:H1: There is no significant difference between GSM and CDMA network attributes (mixes) in South West, Nigeria. H2: Tariff is not a major determinant of GSM/CDMA network preference.H3: Primacy of network presence is not a strong measure of market dominance in an area of operation.
6. Research Methodology
This study is limited to the assessment of the performance of the GSM and CDMA networks such as Etisalat, Glo, MTN, Airtel, Starcomms and Visafone in South West, Nigeria which includes states such as: Lagos, Ekiti, Ondo, Osun, Ogun and Oyo. 500 persons were sampled across six states of South West Nigeria namely: Lagos, Ekiti, Ondo, Osun, Ogun and Oyo, using questionnaires. The questionnaires were distributed equally and simultaneously, to minimize a sampling bias that might arise from migration. Respondents were selected randomly from different parts of each of the states under consideration. Chi-square is utilized in the tests of our hypotheses 1, 2 and 3 respectively.
7. Data Summary (Analysis of Responses)
Table 1 to 7 and their following description is a summary of the survey data as provided by the respondents. 472 of the 500 questionnaires distributed across the six states of South West, Nigeria were retrieved.| Table 1. Respondent’s gender |
| | Gender | Frequency | Percentage | Cumulative percentage (%) | | Male | 238 | 51.0 | 51.0 | | Female | 234 | 49.0 | 100 | | Total | 472 | 100 | - |
|
|
| Table 2. Age Bracket of Respondent |
| | Age Declaration | Frequency | Percentage | Cumulative percentage (%) | | 16- 20 (years) | 57 | 12.0 | 12.0 | | 21 - 26 (years) | 330 | 70.0 | 82.0 | | 27 - 32 (years) | 49 | 10.0 | 92.0 | | Over 33 (years) | 36 | 8.0 | 100 | | Total | 472 | 100 | - |
|
|
Table 1 and 2 represent the demographics of the respondent. The gender distribution is 49% for female and 51% for male. This indicates that mobile telecommunication subscribers have more males than females. Respondents between 16 and 20 years old have a 12%. We have 70% for those between 21 and 26 years old. Those between 27-32 years account for 10%. Those above 33 years of age were 8%. This indicates that most (70%) of the subscribers to mobile telecommunication services are between the ages of 21 and 26 years inclusive. | Table 3. Cellular Phone Ownership |
| | Variables | Frequency | Percentage | Cumulative percentage (%) | | Yes | 467 | 99.0 | 99.0 | | No | 5 | 1.0 | 100 | | Total | 472 | 100 | - |
|
|
From Table 3 represents cellular phone ownership of 467 (99%) of the respondents owned a cellular phone. Cost, theft/loss was given as reasons for non-ownership of 1%, by the rest.Table 4. Primary Network
 |
| |
|
Table 5. Customers’ knowledge of Tariff
 |
| |
|
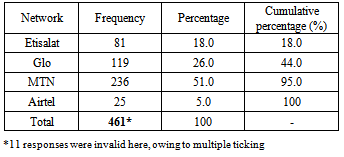
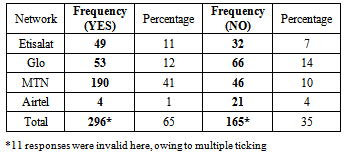
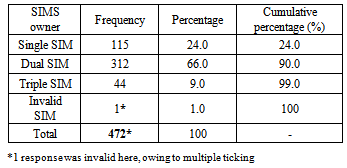
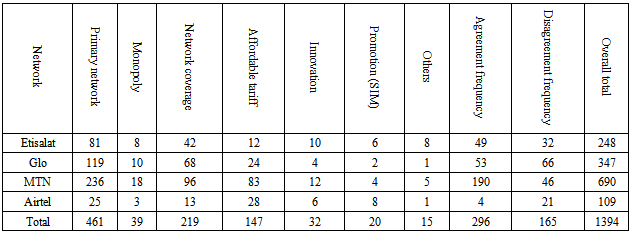
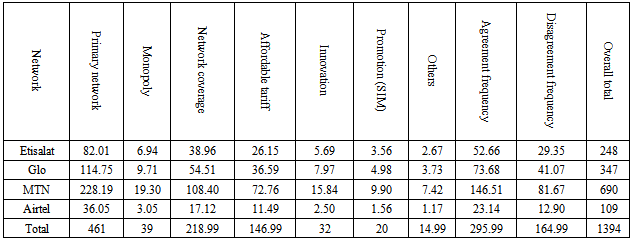
Table 4 and 5 represent the primary network distributed and customer’s knowledge tariff of the respondent. The network distribution is 18% for Etisalat, 26% for Glo, 51% are MTN and 5% for Airtel. This indicates that MTN network distribution has more subscribers compared with other network placing Airtel been the least as stated on table 4. Based on finding we can deduce that customer’s knowledge tariff by the respondent indicate in confirmatory to stronger agreement to MTN tariff and stronger disagreement to Glo tariff placing confirmatory agreement on Airtel been the least to customer’s knowledge tariff of all primary network stated in table 5. Consequently, a total of 11 responses were invalid owing to multiple ticking.The Majority of the respondents (312; 66%) were double-line (SIM) owners; (1; 1%) based on invalid SIM ticking; (115; 24%) and (44; 9%) owned one and three GSM lines (SIM Cards) respectively.Based on finding the Network coverage (219; 46%) was the dominant reason for network choice in each of the six states: Lagos, Ekiti, Ogun, Osun, Oyo and Ondo, followed by Tariff rates. Other attributes and their weights are shown in Table 7.Table 6. Number of GSM lines (SIM Cards) owned
 |
| |
|
| Table 7. Determinants of Initial GSM Network Choice |
| | Factors | Frequency | Percentage | Cumulative percentage (%) | | Monopoly | 39 | 8.8 | 8.8 | | Network Coverage | 219 | 46.0 | 54.8 | | Affordable Tariff | 147 | 31.0 | 85.8 | | Innovation | 32 | 6.8 | 92.6 | | Promotion (SIM) | 20 | 4.2 | 96.8 | | Others | 15 | 3.2 | 100 | | Total | 472 | 100 | - |
|
|
8. Analysis and Test of Hypotheses
Arising from the questionnaire administered three (3) were formulated. The three hypotheses were respectively tested, using Chi-square, Correlation and spearman’s Rank Correlation. H1: There is no significant difference between GSM network attributes and customer Patronage in South West, Nigeria. H2: Tariff is not a major determinant of GSM Network Preference in South West, Nigeria.H3: Primacy of Network presence is not a strong measure of market dominance in an area of operation.
8.1. Facts Finding on Chi-Square
The null hypothesis states that there is no significant difference between the expected and observed frequencies while the alternative hypothesis states they are different. Di Maria 2013, as a result the level of significance is set at .05 which is the standard for most scientific experiments. The chi-square formula used on these data is stated here.X2 = (O - E)2/ EWhere O is the Observed Frequency in each categoryE is the Expected Frequency in the Corresponding CategoryDf is the “Degree of Freedom” (n - 1)
8.2. The First Hypothesis (H1)
The first (H1) states thatthere is no significant difference between GSM network attributes and customer Patronage in South West, Nigeria. This was tested with table 4 and 5 respectively. | Table 8. Observed frequencies (O) H1 |
| | Network | Primary Network | Agreement Frequency | Disagreement Frequency | Overall total | | Etisalat | 81 | 49 | 32 | 162 | | Glo | 119 | 53 | 66 | 238 | | MTN | 236 | 190 | 46 | 472 | | Airtel | 25 | 4 | 21 | 50 | | Total | 461 | 296 | 165 | 922 |
|
|
| Table 9. Expected frequencies (E) H1 |
| | Network | Primary Network | Agreement Frequency | Disagreement Frequency | Overall total | | Etisalat | 81 | 52.01 | 28.99 | 162 | | Glo | 119 | 76.41 | 42.59 | 238 | | MTN | 236 | 151.53 | 84.47 | 472 | | Airtel | 25 | 16.05 | 8.95 | 50 | | Total | 461 | 296 | 165 | 922 |
|
|
Hence to get the entire table expectation entry we calculate (row total multiply column total) divide overall total.
8.2.1. Find the df. (N-1)
The number of degree of freedom is calculated from an M * N table as (M * N – 1); so in this case we have (3 * 4 – 1) = 12 – 1 = 11; hence showing a degree of freedom as 11.
8.2.2. Find the Table Value (Consult the Chi Square Table)
Hence the tabular 95% value of X^2 (degree of freedom = 11) is 19.675; the calculated chi-square value for the set of data we analyzed (73.0840) is significant at 5% level and greater than the table critical value (19.675) - reject the null hypothesis, and accept the alternate (there is a significant difference). In this situation, the rejection of the null hypothesis means that the differences between the expected frequencies and the observed frequencies are not due to chance. That is, they are not due to chance variation in the sample survey; there is a real difference between them. Therefore, in deciding GSM Network attributes are significant to customer patronages in south west, Nigeria. So we conclude that our survey sample supports the hypothesis of a difference.
8.3. The Second Hypothesis (H2)
The second (H2) states thattariff are not a major determinant of GSM Network Preference in South, Nigeria. This was tested with table 4, 5 and 7 respectively. Table 10. Observed frequencies (O) H2
 |
| |
|
Table 11. Expected frequencies (E) H2
 |
| |
|
Hence to get the entire table expectation entry we calculate (row total multiply column total) divide overalltotal.
8.3.1. Find the df. (N-1)
The number of degree of freedom is calculated from an M * N table as (M * N – 1); so in this case we have (9 * 4 – 1) = 36 - 1 = 35; hence showing a degree of freedom as 35.
8.3.2. Find the Table Value (Consult the Chi Square Table)
Hence the tabular 95% value of X^2 (degree of freedom = 35) is 49.802; the calculated chi-square value for the set of data we analyzed (176.1242) is significant at 5% level and greater than the table critical value (49.802) - reject the null hypothesis. In this situation, the rejection of the null hypothesis means that the differences between the expected frequencies and the observed frequencies are not due to chance. Therefore, tariff is a major determinant of GSM Network preference in south west, Nigeria.
8.4. The Third Hypothesis (H3)
The third (H3): states thatprimacy of Network presence is not a strong measure of market dominance in an area of operation. This was tested with table 2 and 4 respectively. | Table 12. Observed frequencies (O) H3 |
| | Network | Primary Network | 16-20 years | 21-26 years | 27-32 years | Over 33 years | Overall Total | | Etisalat | 81 | 12 | 42 | 3 | 5 | 143 | | Glo | 119 | 10 | 88 | 9 | 6 | 232 | | MTN | 236 | 24 | 169 | 29 | 22 | 480 | | Airtel | 25 | 11 | 31 | 8 | 3 | 78 | | Total | 461 | 57 | 330 | 49 | 36 | 933 |
|
|
| Table 13. Expected frequencies (E) H3 |
| | Network | Primary Network | 16-20 years | 21-26 years | 27-32 years | Over 33 years | Overall Total | | Etisalat | 70.66 | 8.74 | 50.58 | 7.51 | 5.52 | 143.1 | | Glo | 114.63 | 14.17 | 82.06 | 12.18 | 8.95 | 231.93 | | MTN | 237.17 | 29.32 | 169.77 | 25.21 | 18.52 | 479.99 | | Airtel | 38.54 | 4.77 | 27.59 | 4.10 | 3.01 | 78.01 | | Total | 461 | 57 | 330 | 49 | 36 | 933 |
|
|
Hence to get the entire table expectation entry we calculate (row total multiply column total) divide overall total.
8.4.1. Find the df. (N-1)
The number of degree of freedom is calculated from an M * N table as (M * N – 1); so in this case we have (5 * 4 – 1) = 20 – 1 = 19; hence showing a degree of freedom as 19.
8.4.2. Find the Table Value (Consult the Chi Square Table)
Hence the tabular 95% value of X^2 (degree of freedom = 19) is 30.144; the calculated chi-square value for the set of data we analyzed (29.7917) is significant at 5% level and lesser than the table critical value (30.144) accept the null hypothesis (there is no difference). In this situation, the acceptance of the null hypothesis means that the no differences between the expected frequencies and the observed frequencies are due to chance. That is, they are due to chance variation in the sample survey. Consequently, primacy of network presence is not a strong measure of market dominance in an area of operation.
9. Conclusions
The customer satisfaction measurement is one way to help service firms improve service quality and help prospective customers make informed choice (s) of a service provider. This paper shows GSM patronage among subscribers in South West, Nigeria.The survey results, has 65 percent of the sampled respondents claimed to have knowledge of the tariffs charged by their primary (preferred) network providers. The survey shows 65 percent of respondents claimed that tariff is the most significant factor of choosing preferred network. This implies that tariff has the major impact among the other factors since there influencing the patronage of GSM network in Nigeria.CDMA is yet to break into or compete with GSM in Network popularity in South West, Nigeria since there is little presence. Mobile telecommunication service providers should adopt the template presented in this work on an annual basis in order to ascertain the level of their subscriber satisfaction. this will go a long way to improve on their service quality and positively increase the customer patronage. As a result NCC should endeavor to enforce each service provider to conduct the subscriber satisfaction test at least once in a year.
References
| [1] | Nwachukwu, T.T. (2003), “Marketability of GSM Services”, Journal of Nigerian Telecommunications Sectors. |
| [2] | www.mtnonline.com |
| [3] | Okonedo, Bill (2010), Business Day, 18 January. |
| [4] | Aigbinode, R. (2008, July 7). Seven years of telecoms revolution – the breathtaking revolution in telecoms industry. Tell Magazine of Nigeria. |
| [5] | CDMA network coverage optimization in South-Eastern Nigeria, Shoewu, O., Adedipe, A and Edeko, F.O. |
| [6] | http://kbs.cs.tuberlin.de/jutta/gsm/js-intro.html |
| [7] | Scourias, John. “Overview of the Global System for Mobile Communications”, 1997. |
| [8] | www.pcmag.com |
| [9] | Hawkins, Del I; Best, Roger T. and Coney, Kenneth A. (2001) Consumer Behaviour: Building Marketing Strategy, Boston: McGraw-Hill, Inc. |
| [10] | DiMaria, R. Ann (2013), “Understanding and Interpreting the Chi-Square Statistic”, retrieved from URLs: http:/hsc.wvu. edu/Charleston/son/Class2chisquareDiMaria.pdf on 27th August, 2013. |
| [11] | Osaretti, C.P. (2005), “Innovation in GSM”, excerpted from MTN Newsletter, MTN Corporate Affairs Department, Lagos. |
| [12] | Robertson, Chris (2002), Business Statistics: A Multi-media Guide to Concepts and Applications, London: Holder Headline Group. |
| [13] | Churuchill, Gilbert A. (1976), Marketing Research: Methodological Foundations, Illinois: The Dryden Press. |
| [14] | Kotler, Philip and Keller, Kevin L. (2006), Marketing Management, 12th ed, New Delhi: Prentice Hall. |
| [15] | Ozuruigbo, Nnamdi (2010), an interview with OZB Communications, the Telecom Major Dealer, headquartered in Owerri, Imo State. |
| [16] | Hawkins, Del I; Best, Roger T. and Coney, Kenneth A. (2001) Consumer Behaviour: Building Marketing Strategy, Boston: McGraw-Hill, Inc. |
| [17] | Kinnear, Thomas C. and Taylor, James R. (1991), Marketing Research: An Applied Approach, 4th.ed, New York: McGraw Hill Inc. |
 Abstract
 Reference
 Full-Text PDF
 Full-text HTML