-
Paper Information
- Previous Paper
- Paper Submission
-
Journal Information
- About This Journal
- Editorial Board
- Current Issue
- Archive
- Author Guidelines
- Contact Us
Computer Science and Engineering
p-ISSN: 2163-1484 e-ISSN: 2163-1492
2013; 3(3): 56-66
doi:10.5923/j.computer.20130303.02
GOMP Profiler: A Profiler for OpenMP Task Level Parallelism
 Abstract
 Reference
 Full-Text PDF
 Full-text HTML
Joseph M. Arul, Gwang-Jie Hwang, Han-Yao Ko
Department of Computer Science and Information Engineering, Fu Jen Catholic University, Hsin Chuang Dt, New Taipei City, Taiwan
Correspondence to: Joseph M. Arul, Department of Computer Science and Information Engineering, Fu Jen Catholic University, Hsin Chuang Dt, New Taipei City, Taiwan.
| Email: |  |
Copyright © 2012 Scientific & Academic Publishing. All Rights Reserved.
The current trend in microprocessor is to go multi-core, be it in desktops, note-books or hand-held systems. Fortunately, many major software and hardware vendors specifically defined a parallel programming API model called OpenMP. Recently, OpenMP version 3.0 included a new feature, i.e., task level parallelism, for parallelizing unstructured programs. This research focuses on using a particular instrumented library, together with the OpenMP run-time library, for a specific GNU Compiler Collection (GCC) and constructs a visualization tool for presenting the performance during task level parallelism. In order to verify the capability of the GNU OpenMP (GOMP) Profiler, Barcelona OpenMP Task Suits (BOTS) were used and analysed. Four different metrics were used in order to eliminate the unnecessary overheads and understand the behavior of BOTS. Thus, by using this profiler, a programmer can understand the code better and rearrange the code in order to avoid the extra computations involved during the parallel execution. Thus, task level parallelism can be improved greatly.
Keywords: Task level parallelism, OpenMP, Profiler, Multi-core, Run-time
Cite this paper: Joseph M. Arul, Gwang-Jie Hwang, Han-Yao Ko, GOMP Profiler: A Profiler for OpenMP Task Level Parallelism, Computer Science and Engineering, Vol. 3 No. 3, 2013, pp. 56-66. doi: 10.5923/j.computer.20130303.02.
Article Outline
1. Introduction
- Recent computers have been built with dual, quad, and hexa cores. Hence, it is important to compile the sequential programs into parallel programs using some APIs such as OpenMP, CUDA, or MPI. In several applications, most of the parallelism is exploited in the loop level. If the loop can be naturally parallelized, then the compiler can rearrange the code to parallelize the code. This loop level parallelism is the predominant area of parallelization in the scientific programs. This can be rather straightforward and several researches have already been done.The other form of parallelism is that, which can be found in the non-loop level, where, each activity can be grouped as a task to be executed in parallel. So the task level parallelism tries to find number of tasks available in a program and all the tasks are scheduled in a queue for different processors to pick these tasks from a queue to execute them. Task level parallelism, which can be stated as unstructured or thread parallelism in different granularity, such as coarse or fine granularity, is becoming more and more important in parallelizing compilers. Task level parallelism can also be considered as another form of parallelism which can be used in recursive functions that are aimed at collections of asynchronous tasks. Even though it can be used in the place of data level parallelism, it is better suited to exploit the task level parallelism when the functions are called recursively where the return values are unpredictable. It is also suitable when there is a while-loop with an unpredictable end point and there exists a task level parallelism.However, parallelizing an existing program almost has some overheads due to extra and unnecessary computations involved during parallelization. These overheads can be caused due to various reasons such as synchronization, communication, load-imbalance, etc. Besides, it can also reduce the speedup of a parallel program. When the speedup is much less than our expectation, profiler can point to us accurately where the overheads are and what are the reasons that cause this degradation. Hence, we can try to fix the program according to the profiler that pinpoints the overhead that occurs unnecessarily. OpenMP task level parallelism also creates a lot of overheads in many programs. There are researchers who have discussed these overheads[1]. Olivier and Prins run programs with unbalanced task graphs and evaluate the Open MP run-time overheads[2]. Duran, Corbalan and Ayguade increase the granularity of a task by a method called Adaptive Task Cut-off[3] and evaluate the efficiency of the OpenMP task scheduling strategies[4-5]. Other people focus on the tools for measuring the overheads of OpenMP task level parallelism, such as Intel Thread Profiler, Sun’s performance tool and Nanos OpenMP run-time library. However, no profiler supports profiling GCC’s (GNU Compiler Collection) OpenMP run-time performance. Hence, we build a particular OpenMP profiler for a specific compiler GCC, and it only focuses on monitoring the latest features of OpenMP task level parallelism. For this purpose, we design an instrumentation library and modify the OpenMP run-time library to collect the performance data. Thus, it is named as GNU OpenMP (GOMP) profiler. In addition, we also construct a visualization tool for presenting these performance data. Finally, we use a collection of benchmarks with this profiler and find the overheads which are pinpointed by the features of this profiler. The rest of the paper is organized as follows: section 2 presents the background in evaluating the performance and explores the related profilers which measure the OpenMP task level parallelism. Also in section 2, the special features of this particular profiler are explained. Section 3 describes the implementation steps of this particular profiler and the special characteristics of this profiler as well as how it differs from other profilers in detail. Section 4 presents the experimental results by presenting the capability of this particular profiler. Section 5 presents the conclusion of the whole research and how it can be improved in this area of research in the future.
2. Background and Related Research
- This section will present some background information about OpenMP’s two different modes of profiling programs, i.e., instrumentation and sampling. Secondly, it presents some profilers those are currently in use for performance measurements of OpenMP 3.0[6]. Finally, the special features about this particular profiler as well as how it differs from other existing profilers, including some information about how this profiler was developed will be explained. Instrumentation is to modify the binary by inserting some sort of probes while entering and exiting a function or a method which would in turn collect performance of data in every step of the way while the program is executing. It would have some overheads because the additional instructions used for the probes would have some extra computations added to the overall performance of the program. The sampling is to periodically check the states of the system or running of programs. Thus, the sampling would have less overhead, since it does not interfere with the programs. For example, by querying cache miss counter first 10ms and it would note that there were 3 cache misses, then the following 10ms the cache miss counter could note 8 cache misses and so on. Thus, the sampling can notify the user the number of cache misses encountered each 10ms and so on. So the property of sampling is that, it can not monitor all the events when the time taken is less than the period of the time expected in our system. There are several profilers such as, profiling OpenMP performance[7] or tracing the behavior of OpenMP program, Tuning and Analysis Utilities (TAU)[8], Intel thread profiler, OpenMP Profiler (ompP)[9-10], Nanos OpenMP run-time library[11] and Sun’s performance tool[12]. There are various performance tools[13-14] where each tool has its purpose and it supports a specific platform or programming language. TAU aims to parallelize MPI and OpenMP programming API, and it can profile the programs written by OpenMP or MPI or both of these together. The special features of TAU are the architecture compatibility and having varied analysis tools. The first feature they implemented is the general computation model to reflect the real world parallel computing architecture. The second feature of TAU provides many tools[15] for different purposes such as, discovering parallel overheads, tracing program’s call-graphs and analyzing workload of distributed parallel systems.Intel thread profiler is a plug-in to VTune Performance analyser. It supports threaded applications written by OpenMP, POSIX threads and Windows API. You can either use VTune graphical analyser tool or the tools integrated with the Visual Studio. It can identify the limitations of parallel programs and show what type of limitations, synchronization, load imbalance or thread creation/ destroying time occuring during the execution. The only drawback of this profiler is that, it is just compatible with Intel multi-core processors, but does not support any other processors developed by other vendors.Rest of the three profilers, ompP, Nanos OpenMP run-time library and Sun’s performance tool are designed to measure the programs written by OpenMP specification version 3.0. The ompP and Nanos use instrumentation library to profile, however, the Sun’s performance tool uses sampling technique to measure OpenMP performance.
2.1. Features of GOMP Profiler
- This particular profiler that has been implemented has the ability to detect the run-time events and special implementation events. The run-time events are meant to monitor the run-time cut-off, accessing global queue and insufficient task events. The special implementation event is the task-wait pending overhead in GOMP. These four types of events can only be captured by instrumenting GOMP run-time library. Hence, this instrumentation method will be explained in detail in the following section. The differences between this particular profiler and the others are the following: 1). OmpP cannot detect the run-time events and special implementation events. The reason is that it instruments in source code level instead of run-time library level. 2). Nanos has the ability to measure the run-time events but is unable to capture the implementation events, because they do not instrument GOMP run-time library. 3). Sun’s performance tool also does not capture the implementation events, and it is not accurate because of the sampling method.
3. Implementation Method
- Four main parts of the Implementation:There are four main portions that are involved in implementing GOMP Profiler. The major parts of this implementation are: 1) Designing data structures to store some necessary data or representation of states of a program in those data structures; 2) Designing the functionality and the prototypes of instrumentation library calls; 3) Inserting instrumentation library calls in appropriate places for instrumentation; 4) Getting data and then visualizing those data. The following paragraphs will continue to present the detailed explanations of each of the components mentioned here.The main purpose of this profiler is to capture the states of a program. Hence, the event types for distinguishing between different states are shown in figure 1. There are some important event types which are related to task level parallelism. How the events are instrumented is shown in figure 2 above.
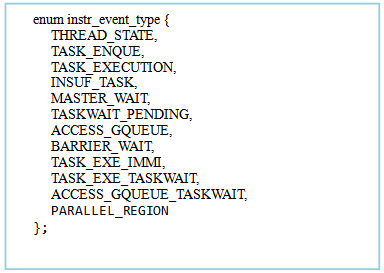 | Figure 1. Instrumented Event Types |
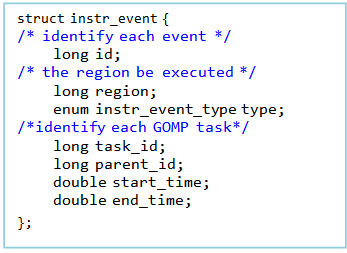 | Figure 2. Instrumented Events |
3.1. Data Structures
- The details of the event types are as follows:TASK_ENQUE: Assign a task to the global task queue.TASK_EXECUTION: Threads get tasks from the global task queue and execute them.INSUF_TASK (insufficient task): No task in the global task queue, so some threads have no tasks to do which results in wasting time to wait for more tasks. TASKWAIT_PENDING (pending in task-wait region): Wait for other children tasks to finish their work.ACCESS_GQUEUE (access global queue): The time taken by accessing the global queue. BARRIER_WAIT (barrier waiting): Wait for other threads to arrive at the synchronization point.TASK_EXE_IMMI (task execute immediately): Instead of enqueuing a task, execute the task directly. TASK_EXE_TASKWAIT (task execution in task-wait region): Execute the child task.
3.2. Instrumentation Library and User Library
- There are two types of libraries designed for different purposes, i.e., run-time and user library. The first one is for the instrumentation and the second one is for the users to use. The run-time library has get_event_id, instr_event_start, instr_event_end, instr_set, instr_profile_all_write, set_task_id, and set_parent_id. The user library call set_profiled_filename is used to set the name of a file which stores the profiled data and let the users specify the destination file for different profiled programs. The set_sequential_start and set_sequential_end library calls let the users specify the locations of the start point and end point in the sequential code and calculate the time cost in the sequential code. After knowing the time taken off by the sequential part and the parallel part of the code, we can understand the speedup of this parallelization of a program.
3.3. Instrumenting GNU Open MP Run-time Library
- The above mentioned instrumentation library is directly inserted into the OpenMP run-time library. Directly instrumenting GOMP run-time library has the following advantages: 1). It can capture the run-time events, run-time cut-off, accessing global queue and insufficient tasks; 2). Capture special implementation events i.e., task-wait pending; 3). It adds instrumentation functionality to GCC, so users can enable the instrumentation option while compiling an OpenMP program. Any OpenMP program that is compiled by this modified GCC, the users can get the performance data after executing the OpenMP programs.
3.4. Visualization Tool
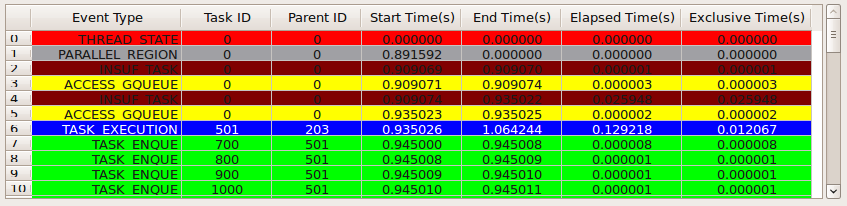
- The collected data of profiled OpenMp programs are stored as a list of events which are sorted at the end of the program. Just listing them on the console would be hard to understand the behaviour of a program. Qt framework is a tool developed for high performance cross-platform applications especially for GUI design. It matches the characteristics of GCC which is an open source and cross-straight platform library. Figure 3 shows a visualization tool for profiled viewer.Figure 4 shows an overview area. This area lists the following data: 1). profiled file name, 2). custom sequential time, 3) the custom parallel time, 4) speedup, 5) start time of the parallel region, 6) the end time of parallel region, 7) the elapsed time of the parallel region and 8) total task execution time. Speedup entry is calculated by the custom sequential time / custom parallel time. Total task execution time is the accumulation time of each task’s execution time.Figure 5 shows the table where each column represents different types of information of events, and each row represents an event at a specific time. The first column shows the type of event; second and third columns show the task ID and parent ID of an event respectively; fourth and fifth columns show the starting and ending time of an event; sixth column is the elapsed time of an event, it is defined by the “end time of an event – start time of the event”; the last column shows the exclusive time of an event and this time is calculated by the elapsed time minus the time of children events executed during this event. An example for exclusive time:- event B executed in event A, event B took 3 seconds and event A took 4 seconds. So the exclusive time of event A is 4-3 =1sec. By observing the parent ID, we can understand which events were executed during a particular event. Events that have the same parent ID means these events are the children of the same parent event. Looking at the exclusive time, we can note that the exact time taken by that event which does not include the time taken by the children events.
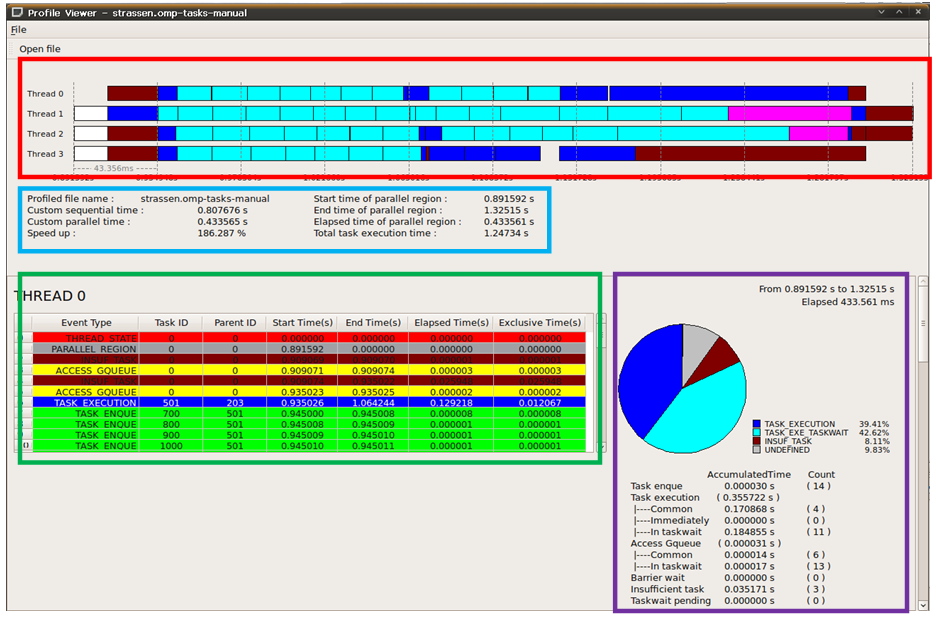 | Figure 3. Visualization Tool Profile Viewer |
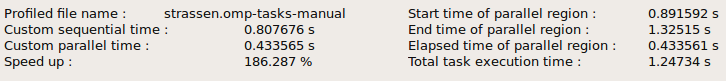 | Figure 4. Overview of Profiled Program |
 | Figure 5. Table Lists Events which Were Executed by Threads |
4. Experiments and Analysis of GOMP Profiler
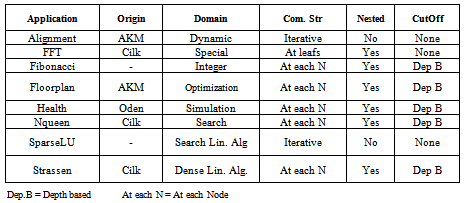
- In order to evaluate the efficiency of this profiler and how well this profiler can help the programmer to improve performance, we have chosen a set of benchmarks which use OpenMP tasks to achieve parallelism. These benchmarks are different from general loop-level parallelism, thus they are commonly used to parallelize the recursive programs or while-loop structures. There are many benchmarks available for analysing loop level parallelism[16]; however, few are available for task level parallelism.Barcelona OpenMP Tasks Suite (BOTS)[17] is a collection of applications that exploit task level parallelism in particular, and it aims to evaluate the OpenMP implementation. For the experiment purpose, we use BOTS version 1.0 as our benchmark tool. The summary of 8 benchmarks is listed in table 1. Before describing each application, we will elaborate the detailed characteristics of each of these applications as shown in table 1.
4.1. Barcelona OpenMP Tasks Suite
4.2. Using GOMP to analyse BOTS Benchmarks
- The experimental environment was as follows: Operating system was Linux distribution Ubuntu 10.04 with kernel 2.6.32-22; benchmark programs were as mentioned above, Barcelona OpenMP Task Suite (BOTS); OpenMP compiler was GCC compiler 4.4.1 modified version that was the GOMP with additional instrumentation library implemented for this research; CPU used for this research was Intel Core 2 Quad Q6600 2.4GHz; memory was DDR2 and the size was 2GB. Since this platform used quad-core, the ideal speedup comparison with the original sequential version would be 4 times. In addition, we implemented these benchmarks with all 4 cores, not 2 or 3, and found the behaviour of each benchmark via GOMP Profiler. In the last part of this section, the relationship between experimental results and the program’s algorithm will be presented.
4.3. Visualization Tool
- The special features of the GOMP Profiler from various aspects are as follows; speedup, run-time cut-off, task overhead, extra parallel computation and synchronization overheads.First, the speedup of the parallel program is a basic metric to analyse how fast the parallel version of the program is compared to the sequential version. When the speedup is significantly lower than the number of processors, it would mean that the parallelization has not achieved its maximum goal and has some problems in the parallelization part which needs to be improved. This metric informs the user as to how one must carefully analyse the detailed aspects of parallelization in relation to task level parallelism, if the metric does not come close to linear speedup as expected by the user.Secondly, run-time cut-off which indicates a region of a program that is marked with “#pragma omp task” should be treated as an OpenMP task, but it is executed directly by a thread. This can be judged by the results of run-time scheduler or scheduled directly by the user. If the tasks are inserted into a global/local task queue, it has a tradeoff. Hence, without inserting tasks to a global/local queue and scheduling tasks, tasks take less time during run-time cut-off phase.Third, average task time indicates the average time cost by a task. Less time means that, it spends more time in creating and scheduling which can be considered as overhead time. Generally, time taken by creating and scheduling a task is constant and it is the time taken by each task. If creating and scheduling a task takes 100 ns, then the average task time of a program is 900 ns, the overhead is 10% that it is shown below as to how to calculate the creating and scheduling overhead of a task.
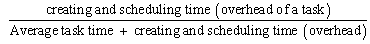 If the average task time is 100 ns, then the overhead would be 50% of the program. Thus, when the average task time is too small, the creating and scheduling overhead would be large.The fourth aspect is the extra parallel computation. In general, parallel version of a program must do more work than the sequential version. So the extra parallel computation just refers to such works, but does not include the types of synchronization overheads we defined. Hence, it would indicate to us the need to decrease it when there is a large amount of extra parallel computation. Thus, the profiler helps the users to analyse and to decrease the extra parallel computation involved in the parallel version of the application to achieve maximum parallelism.Finally, the synchronization overheads would indicate what percentage of the total execution time is taken by synchronization. In this research, synchronization overheads are categorized by four different types of synchronization; accessing global task queue, barrier waiting, insufficient task and task-wait pending. Accessing_global_task_queue overhead is normally caused by task scheduler, while OpenMP task enqueue and thread dequeue task must do synchronized operations and thus it will be serialized rather than the parallelization of this portion. Barrier waiting will happen at the beginning of each parallel region or at the end of parallel region. At the beginning of a parallel region, OpenMP will create a team of threads and set a barrier to synchronize these threads, waiting until the last thread is finished by the creating process. After the parallel region, each thread except the master thread will wait for the barrier until the next parallel region is reached.Insufficient task directive is that, there are no more tasks to be executed in the queue during a particular time, so it notifies that the task required by the processor is greater than the tasks executed in the queue. Task-wait pending is an implementation overhead. GOMP uses a simple method to implement the task-wait directive, so it can not do the load-balance of tasks in the task-wait region. However, by using a simple method, this research proposes a solution and discusses them at the later part of the experiment results. In order to precisely measure the speedup of each application for accuracy, each program was run 10 times and the average sequential and parallel time for speedup was taken. The other types of characteristics such as run-time cut-off, average task time, extra parallel computation and synchronization overhead, were also observed 10 times, and the best observation was chosen to represent that particular program when all the observations were similar. Otherwise, we present the differences between various observations. The following paragraphs present the characteristics of each application that resulted from using GOMP Profiler.
4.4. Alignment Program
- This benchmark aligned 100 protein sequences that were run in sequential as well as parallel version. The sequential version took 52.234803 secs and the parallel version took 13.1954 secs as shown in table 2. Thus, the speedup achieved for this application was 3.95 by using four processors. Even though it shows an excellent parallelism, it is important to note why this program achieves parallelism close to maximum number of processors. Since the profiler can clearly indicate to us the details of how the time spent in different parts of the program, we can note the special characteristics of this program using the task level parallelism. By using this profiler, one can note that the average task time was 52.6186secs and the total time of enqueuing and scheduling time was only 0.789ms. Hence, one can point out that the task overhead is nearly zero. Run-time cut-off rate has reached the maximum of 94.77% (Table 3), which is due to the program’s iterative structure.
|
|
4.5. FFT Program
- This particular application processes a vector size of 33554432 by FFT which can be seen from table 4. It was an example of a very fine grain program, where the average task time was only 8.64 μsec as shown in table 5, which resulted from the workload of each recursive function that was too small. Each recursive function was scheduled by an OpenMP task. However, it had a very high run-time cut-off rate, i.e., 99.26% (Table 5), which helped to reduce the overall overhead, and had a significant improvement. However, there was a slight performance degradation that was mainly due to extra parallel computation, i.e., 3.2557secs; this parallel computation time was about 22.85% that exceeded the sequential code time. As a result, the speedup of FFT benchmark which can be calculated as 100% /[(100% + 22.85%) / 4 cores] = 325% only, it was mainly due to extra parallel computation overhead. The speedup was 311%, however, it could have achieved the speedup of 325% with only little bit extra parallel computation overheads.
|
|
4.6. Fibonacci Program
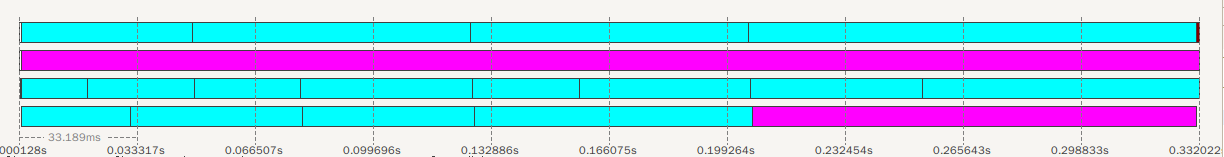
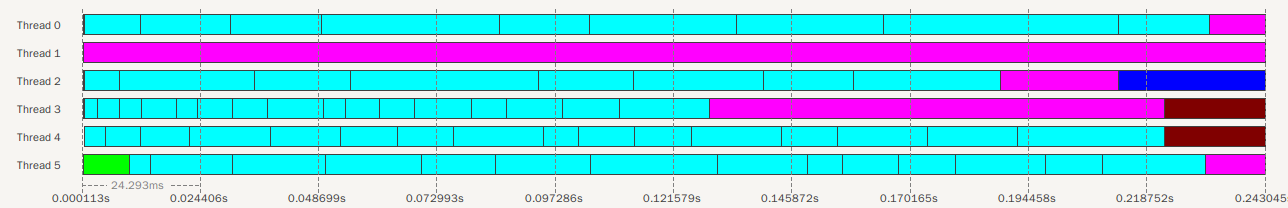
- This is a common application that is used for calculating Fibonacci number. For our experiment, the Fibonacci number 40 was chosen. The timeline which can be noted from figure 6, generated by the profiler for Fibonacci program that clearly showed that thread1 had almost 100% task-wait pending overhead (pink color-second row) and the other thread shown on the fourth row had roughly one third overhead (pink color). There was 34.37% synchronization overhead which can be seen from table 7, was due to the total task-wait pending time, i.e., 0.456257sec. and the total parallel computation time was 1.327692secs. (parallel time * number of processors). It can be noted that the high level of synchronization operation took large amount of time in the total parallel computation. Hence the speedup for this benchmark was only 262%.
|
|
 | Figure 6. Timeline of Fibonacci Program with 4 Threads |
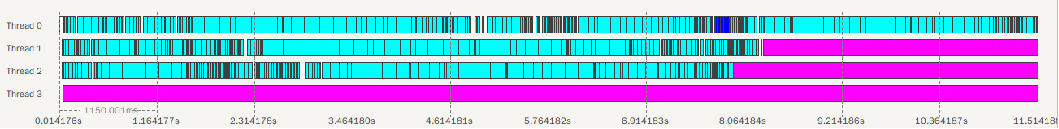
 | Figure 7. Timeline of Fibonacci Program with 6 Threads |
4.7. Floorplan Program
|
|
4.8. Health Program
|
|
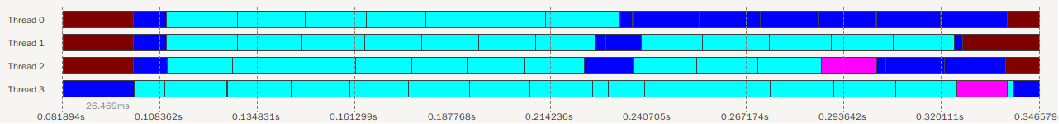
 | Figure 8. Timeline of Floorplan Program with 4 Threads |
4.9. N-Queen Program
- For this N-Queens’ problem as shown in table 12, we try to solve 14 N-Queens. As described by N-Queens, the extra computation is from the operation of the parent task which copies its chessboard to the children tasks. It is also considered the fine grain task problem and uses a manually cut-off method to increase the task time. However, it did not consider reducing the memory allocation together. Consequently, it had little synchronization overhead and 11.98 % extra computation as can be seen in table 13.
|
|
4.10. SparseLU Program
|
|
4.11. Strassen Program
|
|
 | Figure 9. Timeline for Strassen Program with 4 Threads |
5. Conclusions and Future Work
- GOMP Profiler focuses on the OpenMP task level parallelism and aims to achieve a specific platform GNU OpenMP. We have shown the capability of this particular profiler in section 4. It provides several metrics to pinpoint the problems of Barcelona OpenMP Task Suite. The simplest way to figure out the parallelism is the speedup metric. If the speedup is significantly less than the number of processors, it indicates that there could be some extra overheads in the program. Among all the benchmarks used, the alignment and SparseLU benchmarks had rather promising speedups. The rest of the benchmarks, the speedup metric showed that they had some problems in parallelizing the benchmarks. Other metrics such as run-time cut-off metric using GOMP showed that it had good cut-off rates in the following benchmarks: alignment and FFT. It reflected that those benchmarks had reduced the creating and scheduling overheads by run-time cut-off, vice versa. Extra parallel computation metric showed almost every benchmark had 0~20% extra parallel computation except the health benchmark which had 216%. All this information helped us to find out the synchronization overhead that occurred in health benchmark. These types of synchronizations are the following: accessing global queue, barrier waiting, insufficient tasks and task-wait pending. Every program normally has 2% of global access queue and barrier waiting overheads. However, insufficient task and task-wait pending overheads varied for different benchmarks. Fibonacci and floorplan had large amount of task waiting overhead, and Strassen had many insufficient tasks. All of these metrics represent that the GOMP Profiler has the ability to pinpoint the extra overheads in task level parallelism of any OpenMP task programs. From the results of GOMP Profiler, we can analyse and optimize these programs. In the future, these four overheads can be individually measured in all the benchmarks run on parallel version.
ACKNOWLEDGEMENTS
- Our Research group greatly appreciates Fu Jen Catholic University’s office of Research and Development for their constant support and help in accomplishing our goal to complete this research. Our sincere thanks, also to the Ministry of Education (MOE) in Taiwan for their support and assistance.