-
Paper Information
- Paper Submission
-
Journal Information
- About This Journal
- Editorial Board
- Current Issue
- Archive
- Author Guidelines
- Contact Us
Computer Science and Engineering
p-ISSN: 2163-1484 e-ISSN: 2163-1492
2012; 2(6): 118-128
doi:10.5923/j.computer.20120206.06
Modeling Metrics for Service Interpretation
 Abstract
 Reference
 Full-Text PDF
 Full-text HTML
G. Shanmugasundaram1, V. Prasanna Venkatesan1, C. Punitha Devi2
1Department of Banking Technology, Pondicherry University, Puducherry, 605014, India
2Department of Computer Science & Engineering, Pondicherry University, Pondicherry, 605014, India
Correspondence to: G. Shanmugasundaram, Department of Banking Technology, Pondicherry University, Puducherry, 605014, India.
| Email: |  |
Copyright © 2012 Scientific & Academic Publishing. All Rights Reserved.
Information plays a major role in various application domains like library, financial, HealthCare and so on. Information as a service in these domains is achieved by applying Service Oriented Approaches. Handling information about those services are important in discovering the appropriate services for exact matching of consumer requirements. So the available information about these services needs to be organized in a better way for efficient access. Interpreting the appropriate service from the service registry needs complete information of the service. Researchers have discussed basic forms of representing information about services through functional aspects that help in identifying the required web service. This information addressed does not fulfil the consumer requirements normally; hence an extended registry has to be provided with additional details of non-functional aspects in order to locate the exact service. The effect of these attributes on discovering a required service has to be measured. This paper focuses on formulating metrics for interpretation of services based on functional and non-functional aspects of a service. From the literature we have identified features for interpretation. These features have been considered as a focal point and a metric suite is proposed to address those features. Based on these metrics, a measure for service interpretability is proposed. To verify the effectiveness of our proposed metrics, an experiment has been designed and carried out. The result of the proposed metrics shows the effectiveness and improvement of service discovery which gives exact matches to consumer requirements.
Keywords: Service Interpretation, Interpretability Metrics, Discoverability Measures, Service Functional Measures, Non-Functional Metrics
Cite this paper: G. Shanmugasundaram, V. Prasanna Venkatesan, C. Punitha Devi, Modeling Metrics for Service Interpretation, Computer Science and Engineering, Vol. 2 No. 6, 2012, pp. 118-128. doi: 10.5923/j.computer.20120206.06.
Article Outline
1. Introduction
- Applications in all fields are being developed as Service oriented applications and have acquired dominance among development styles. Services portray either single or multiple functionalities. Addressing multiple functionalities could be achieved through service composition. Service composition comprises of identifying the required services and combining one or more services to obtain a composite service. In order to compose the exact service, service discovery plays a major role in identifying that required service. Service discovery is concerned with identifying the appropriate services for fulfilling consumer requirement [1][3]. Effective service discovery is achieved through better interpretation. Interpretability deals with understanding of service with reference to functional and quality of service Meta data. Hence service Interpretation needs sufficient documentation and relevant Meta data which are used to interpret appropriate services. Functionalities rendered by a service are described through interface definition and details about syntax and semantics of services available in the service registry. Quality of service information is required to enhance discovery to suit the consumer requirements. The Qos information dwells with Availability, Compliance, Response Time, Throughput, Latency and Doc. Significance of service interpretability can be obtained from[20][23][26][46]. A need for measuring interpretability becomes vital.Much of the research contribution is towards addressing the metrics for functional aspects which measures the interface and semantics of the web services. Other researchers have proposed measures for certain quality of service aspects like availability and response time. Hence the measures to corresponding interpretability are in primitive stage.In this paper we are focusing on identifying the features for both functional and non-functional aspects of services interpretation. We have proposed metrics for the aspects identified and finally we have defined a new metric for service interpretation based on the proposed metrics. In order to study the proposed metrics, an experiment was designed and conducted. The rest of the paper is organized, section 2 gives review of measures contributed for service interpretation, and section 3 elaborates the proposed work. The experiment design was illustrated in section in 4. The experimentation was carried out and results are reported in section 5. The conclusion is presented in section 6.
2. Related Works
- One or more services provide related or common functionalities. It’s hard to find out the exact service. There arises a need to define the information relevant to service which leads to easy identification of required services. Service interpretation supports in searching and identifying the required service and also the measures corresponding to this component plays major role in service discovery. Our study concentrates on service interpretation of discoverability. The review has been categorized into three parts. The initial part address the aspects related to service interpretation and the second part focuses on the measures contributed by researchers that have some relevance to interpretability aspects. The final part of survey delivers the existing measures specific to interpretability aspects.The aspects addressed by various researchers relate to interpretation of services are shown in table in 1. Functional attributes such as syntax and semantics of services are discussed by[45][19]. The non-functional aspects addressed by contributors are price, availability, response time, and throughput, reliability and network distance[24][25][34][45]. Some of the authors focus on enhancement or enriching the service registry additional attributes for better discovery[17][34]. The aspects specific to interpretation of services are addressed. It emphasis need for measures and metrics, in order to verify the attributes.The literature presented in table 2 delivers the existing works pertaining to measures proposed by different authors, which have some relevance towards interpretation of services.
|
|
3. Proposed Work
- Discoverability is the process of searching the individual service based on the service description and to invoke or interpret those services based on the purpose and its capabilities[2]. Here the definition of discoverability indicates that the two components or items, discovery and interpretability are involved in the entire process of service discoverability[5][10][23][25][32]. The discovery deals with the searching or finding the service and interpretability deals with usage or invocation of those services. So discoverability has to address these two components to offer better discovery. To address discovery and interpretability components we need to identify the features supporting these two items. In this paper our focus is to propose measures for interpretability component of discoverability.
3.1. Service Interpretability
- Interpretability of services deals with clarity or communication which uses the functional and quality of service data for invocation. To invoke or use the services efficiently the functional and non- functional aspects i.e. quality of service data of each registered services has to be defined or represented clearly[11][12][13]. From the study we have found out the factors or features which listed below are essential for the invoking the services.
3.1.1. Functional Specification
- Normally the functional data of service depicts the purpose and capabilities of the services in the service registry [14]. The two components which are used to represent functional data are [22][31]• Semantic Elements – The semantic elements are used to represent the purpose of the service (i.e. This defines the scope of the services)• Service Operation - The syntax or interface, which depicts the operation or capabilities of services (i.e. it clearly represents what functionalities are offered by services)
3.1.2. Quality of Service Meta Data
- The Quality of Service data is used for finding the suitable service from the group of services which meet out consumer requirements. The Quality of Service data used by consumer for evaluating and filtering relevant service from group of services because it gives the behavioral characters, Operational thresholds and policies of the each service in the Service Registry[2]. We have identified the various quality data which are used by consumer for assessing or filtering their service are listed below [10][12][13][33]:• Availability• Compliance • Response Time• Throughput• Latency• Doc• Reliable messaging and best practices The attributes describing functional and non-functional aspects are listed in the table 4. We have defined the value range and corresponding units for each attributes and which are explained in section 4. We have designed a service registry based on the aspects listed in table 4.
3.2. Interpretation Metrics
3.2.1. Functional Data Measures
- • Check for Described Semantic ElementsChecking for Described Semantic Elements (DSE) is measured by assessing the ratio of matching semantic elements to total matching and mismatching semantic elements of Service. This metric check whether purpose or scope of the services are described properly or not.
 Here the value range of DSE is 0...1. Higher the value of DSE metric indicates purposes of the service are clearly defined. The value of this metric is zero if no matches found• Check for well Defined Service OperationsChecking for defined Service operations (DSO) is measured by assessing the ratio of structural matching (Service operation matching) to total matching and mismatching Service operations of Service. The metric uses the additional factor called versioning of services. Here we have fixed values for each version of service. The versioning of service takes the maximum up to 3 versions. This metric checks whether capabilities of the services are described properly or not.
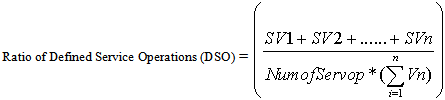 The versioning of services are named as V1, V2 and V3 and the values of V1=1, V2=2 and V3=3.Here the value range of DSO is 0...1. Higher the value of DSO metric indicates operations of the service are well defined. The value of this metric is 0 if no matches found.The functional data value measure is calculated by using the values of two metrics. FDV is computed as
  Here W1 and W2 is the weight factor whose value is 0.5. We are giving the equal weights to both factors because the two factors are essential. Service operation is important component to expose the functionalities of service. Semantic elements are not a mandatory but it’s used to increase the usability of services.
3.2.2. Quality of Service Measures
- The Qos attribute measures for each quality are described below, here we have found out the expected minimum and maximum values for each quality attribute. The minimum value is calculated as ratio of min value of each QoS attribute to maximum value of each QoS attribute. The maximum value for each data is obtained from max of value of each quality attribute to max range of each quality attribute.
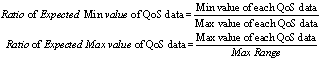 The value of numerator and denominator are taken from the service registry. Expected minimum metrics values are used only when the particular quality of service data is not available in the service registry. The value range for these metrics falls from 0 to 1. In case of response time and latency ratios only we use expected max value (response time and latency) remaining ratio’s we have used expected minimum only.• Ratio of Availability (Avail) Availability of services is measured by using this metric, RA= Max (Measured Quality attribute Value, Expected Min Quality attribute Value)
 Where, Desired (Avail) is expected availability of service,Agreed (Avail) is the availability offered by the serviceMax (Avail) is the maximum availability value for serviceHere value range of Availability is from 0 to 1. Higher the value of this ratio indicates high availability of services. • Ratio of Compliance (Comp)
 Where, Agreed (comp) is the compliance offered by the serviceMax (comp) is the maximum compliance value for serviceHere value range of Compliance is from 0 to 1. Higher the value of this ratio gives high compliance of services.• Ratio of Response time (rt)
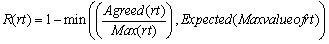 Where, Agreed (rt) is the number of seconds taken by service to respond requestMax (rt) is the maximum number of seconds taken by service to respond request Here value range of Response time is from 0 to 1. Lower the value of this ratio depicts better response from services. We are normalizing the value to 1 because all the ratios are in max value except two.• Ratio of Throughput (tp)
 Here value range of throughput is from 0 to 1. Higher the value of this ratio indicates the services can handle more number of user requests. • Ratio of Latency
 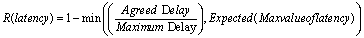 Where, Agreed Delay is the number of second’s delay of service to respond requestMax. Delay is the maximum number of second’s delay of service to respond requestHere value range of latency is from 0 to 1. Lower the value of this ratio indicates the services offer less delay in processing requests. We are normalizing the value of latency to 1• Ratio of Doc
 Here value range of Doc is from 0 to 1. Higher the value of this ratio indicates the services offer more documents for better usage. • Ratio of Reliable Messaging (RM)
 Here value range of Reliable message is from 0 to 1. Higher the value of this ratio indicates the services can handle more Error messages. • Ratio of Best Practices (BP)
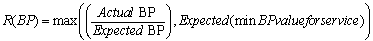 Here value range of best practices is from 0 to 1. Higher the value of this ratio shows the services adopted good practices. The overall quality of Service data Measure (QDM) is computed as
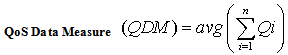 Where, Qi gives ratio of each quality data We have used eight qualities of Service data, the maximum value of i is 8.
3.2.3. Interpretation Metrics
- Finally, the interpretation of service (IoS) is computed by the values of Functional Data measure and quality of Service data measure (i.e. FDV and QDM).
 Here value range of IoS is from 0 to 1. Higher the value of this measure gives better invocation of Service.
4. Experiment Design
- To demonstrate the usability of the proposed metrics, we have designed and implemented three different service registries. Each registry contains three different ranges of data (i.e. registry with 1000, 2000 and 3000 entries)[14][23][27][28]. We derived complete list of attributes which describes functional and non-functional aspects of Services. The value ranges of each attribute (i.e. from minimum to maximum) chosen for the service registry as shown in table 4. The naming of the registry is based on attributes chosen for the registry i.e. minimum set of attributes, next level or medium set of attributes and full set of attributes. The attributes for each service registry have been chosen from table 4. The registries are named as SR1, SR2 and SR3.• SR1- Service Registry 1 is the basic registry which contains limited number of attributes• SR2 – Service Registry 2 extended version which contains additional attributes when compared to SR1.• SR3 – Service Registry 3, Optimum registry which contains complete attributes
4.1. Service Registry Attributes
- The attributes chosen are based on the review of various works and the values for each attributes are defined with help of the references and few attributes are defined by our self that are checked for its optimum. The information given below gives description about each attributes and corresponding values for them.• Registry attributes listed in table 4 describes the complete information of each registered service. Here the attributes are differentiated based on functional and quality of service data. The primitive attribute is service name usually represented using the string type. Service category provides the support for better organization of services and to avoid the misplace of services falls under string type, service version is a number type attribute allowing for simultaneous deployment of multiple versions of the same service and allowing the consumer to choose the version he wants to use. An interface is a fully qualified name of the service, ensuring that a consumer refers to the interface what the services actually expose. The Consumer Type parameter allows us to assign different service endpoints/bindings to different types of consumers for example platinum/golden/etc. The other fields or attributes like semantic elements and service operation falls under type number and are used to represent the purpose and capabilities. The Semantic elements give the described semantic elements matching to consumer demands or requirements. The attribute value is set to max of 5 and min of 3 for our experimental purpose. We have checked the optimality for these values. Service Operation gives the number of operation defined for the service. The attribute value is set to max of 6 and min of 3 for our experimental purpose.• The quality of Service data list out the various fields and their values for the services in the registry to filter and use appropriate services that matches the service consumer demands. The values for each attributes and units are chosen based on the references[6][10][11][24][25].The Service registry SR1 is designed with minimum or basic fields and SR2 with additional fields other than SR1 and SR3 is the complete set which consists of the all fields defined in the table which is explained separately in section 4.2, 4.3 and 4.4. Here we have considered the banking and financial services (B&F Services) as specific category for conducting the experiment towards interpretation.
4.2. Interpretation Metrics on Service Registry1 (SR1)
- The Service Registry (SR1) contains limited attributes. It contains basic attributes like service name, category, service ID, service operation, availability and compliance. Here we formulated 12 queries for our experiment. i.e. Query1 contains Category, Query2 contains Category + Compliance, and likewise remaining queries contains the fields from previous queries in addition to its own field.Out of 12 queries, SR1 gives response for first three queries and for the remaining queries values of query 3 will be repeating as it is a primitive registry and contain basic fields. Proposed functional and non-functional measures applied to result of Query 3 values. In SR1 versioning of Services and semantic descriptions are not available. So the metric DSE value gives zero for all the services. The Functional data measures values (FDV) of SR1 are shown in table 5.
| |||||||||||||||||||||||||||||||||||||||||||||||||||||||||||||||||||||||||||||||||||||||||||||||||||||||||||||||||||||||||||||||||||||||||||||||||||||||||||||
|
|
4.3. Interpretation Metrics on Service Registry2 (SR2)
- The Service Registry 2 (SR2) is the extended version of SR1 with additional attributes like version, interface name, Response time and throughput. Out of 12 queries, SR2 gives response up to the sixth query and the remaining there is no response, the values of the query 6 will be repeating because it is an extended version which contains additional fields compared to SR1. In case of SR2 the DSO metric will be high when compared to SR1 because it has an additional attribute versioning of services. The versioning of services will have an impact on these defined service operation. Hence the FDV values of SR2 are high.
|
|
|
|
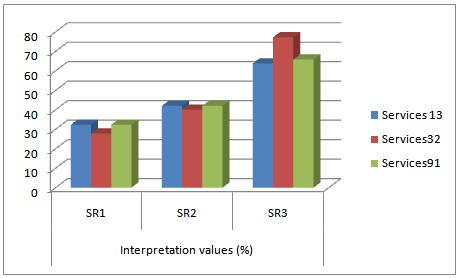
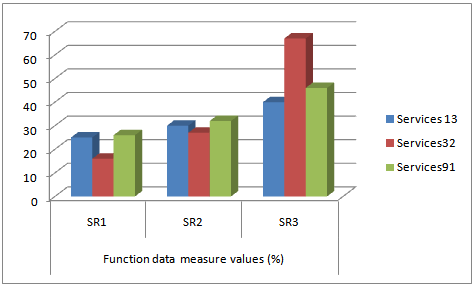 | Figure 1. FDM values of SR1, SR2 and SR3 for various Services |
4.4. Interpretation Metrics on Service Registry3 (SR3)
- The Service Registry 3 (SR3) contains the all attributes listed in the table 1 because it is a complete registry and gives output for all the 12 queries. The FDV is computed based on two factors but in the case of SR1 & SR2 it uses only defined service operation (DSO). Similarly in the case of QoS data measure value is calculated by using the values of all quality of service data measures.
5. Findings & Discussion
- The experiment was conducted against the three different registries that have been formed with B& F services, by using certain queries which supports interpretation. In analysis, we focus on each metric value that is applied in the experiment. The table 11 displays the result of FDM values of three different registries. High value FDM shows that the services contain more functional data i.e. the semantics and syntax of services are clearly defined. Consider the B&FI services 13 , the FDM value upon three different registries indicates there is a gradual increase because the clear representation of syntax and semantics of the service. In the case of B&F Service 32 there is a sudden increase in FDM value on service registry3 because semantics are expressed more precisely when compared to other two registries. So the complete/essential information about syntax and semantics has greater importance in FDM value as shown in figure 1. This indicates that high value of FDM gives better interpretation of Services.Table 12 depicts the results of the QDM values of three registries for various Services. Here QoS data measures values shows an impact of presence of more quality attributes (i.e. service registry contains more quality attributes acts as the filter provide effective interpretation). Here the services 13, 32, 91 gives the gradual increase in the QDM value due presence of various additional QoS attributes in different service registries. QDM value for all services considered is high in case of service registry SR3 as shown in figure 2.
| ||||||||||||||||||||||
| ||||||||||||||||||||||
| ||||||||||||||||||||||
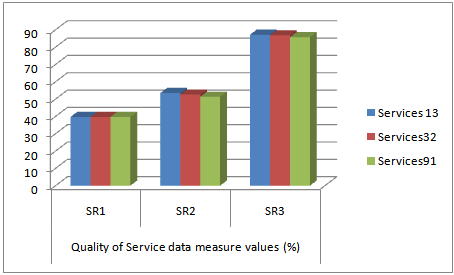 | Figure 2. QDM values of three registries for various Services |
 | Figure 3. Interpretation of Service (IoS) values of three registries for various Services |
6. Conclusions
- We have designed the metric for Interpretation of Services (IoS) by proposed measures for functionality aspects and qualities aspects of Services. These measures are used in the experiment which was designed and conducted. The results are used to compute the IoS value of services. From the cases, it is evident that service registries contain essential information about the service have higher impact on the IoS value. Higher IoS value indicates better interpretation of services. This has been experimentally proved from the values of metrics obtained for various service registries (SR1, SR2 & SR3). The Service Registry 3 (SR3) gives better response towards interpretation of services as proved by the values of the metrics. This metric will help the Service Provider to quantify the effective providing the essential information about the services which will in turn enhances the discoverability of SOA systems.
References
| [1] | T. Erl, “Service-Oriented Architecture, concepts, Technology and design”, The Prentice Hall service-oriented computing series, 2006. |
| [2] | T. Erl, "SOA principles of Service Design”, the prentice Hall Service-Oriented Computing Series, 2009. |
| [3] | Liam O’Brien, Paulo Merson, and Len Bass, “Quality Attributes for Service-Oriented Architectures", IEEE International Workshop on Systems Development in SOA Environments, 2007. |
| [4] | Bingu Shim, Siho Choue, Suntae Kim, Sooyong Park, "A Design Quality Model for Service-Oriented Architecture", IEEE 15th Asia-Pacific Software Engineering Conference, 2008. |
| [5] | R. Deepa, S. Swamynathan, ”A Service Discovery Model for Mobile Ad hoc Networks”, IEEE International Conference on Recent Trends in Information, Telecommunication and Computing, 2010. |
| [6] | Si Won Choi, Jin Sun Her, and Soo Dong Kim," Modelling QoS Attributes and Metrics for Evaluating Services in SOA Considering Consumers’ Perspective as the First Class Requirement”, IEEE Asia-Pacific Services Computing Conference, 2007. |
| [7] | Si Won Choi, Jin Sun Her, and Soo Dong Kim, (2007) "QoS Metrics for Evaluating Services from the Perspective of Service providers”, IEEE International conference on e-Business Engineering, 2007. |
| [8] | Si Won Choi and Soo Dong Kim, "A Quality Model for Evaluating Reusability of Services in SOA”, 10th IEEE Conference on E-Commerce Technology and the Fifth IEEE Conference on Enterprise Computing, E-Commerce and E-Services, 2008. |
| [9] | Lixin Zhou,”An Approach of Semantic Web Service Discovery”, IEEE International Conference on Communications and Mobile Computing, 2010. |
| [10] | Hong-Linh Truong et al., "On Identifying and Reducing Irrelevant Information in Service Composition and Execution",WISE, LNCS 6488, pp. 52–66, 2010. |
| [11] | Aliaksandr Birukou, Enrico Blanzieri, Vincenzo D’Andrea, Paolo Giorgini, and Natallia Kokash," Improving Web Service Discovery with Usage Data ",IEEE software, 2007. |
| [12] | Chen Zhou, Liang-Tien Chia, and Bu-Sung Lee ,”Semantics in Service Discovery and QoS Measurement”, IT Professional Technology solution for Enterprise, IEEE Journal, volume 7 issue 2, 2005. |
| [13] | Eyhab Al-Masri and Qusay H. Mahmoud, ”Toward Quality Driven Web Service Discovery”, IT Professional Technology solution for Enterprise, IEEE Journal, volume 10 issue 3, 2008. |
| [14] | Qi Yu Manjeet Rege, et al.,” A two-phase framework for quality-aware Web service selection”, SOCA 4:63–79, Springer, 2010. |
| [15] | Benjamin Kanagwa and Agnes F. N. Lumaala, "Discovery of Services Based on WSDL Tag Level Combination of Distance Measures”, International Journal of Computing and ICT Research, Vol. 5, Special Issue, December 2011. |
| [16] | Jyotishman Pathak Neeraj Koul Doina Caragea Vasant G Honavar, "A Framework for Semantic Web Services Discovery", WIDM’05, 2005. |
| [17] | Alexander Wahl et al., "An Architecture to Measure QoS Compliance in SOA Infrastructures”, The Second International Conferences on Advanced Service Computing: Service Computation, ISBN: 978-1-61208-105-2, 2010. |
| [18] | Kee-Leong Tan, S.M.F.D. Syed Mustapha,"Measuring Availability of Mobile Web Services", Available online at: http://ww1.ucmss.com/books/LFS/CSREA2006/SWW4876.pdf, 2006 - retrieved April 2012. |
| [19] | Natallia Kokash, (2012)"A Comparison of Web Service Interface Similarity Measures", 2006 accessed April 2012. |
| [20] | Meng Li, Hao-peng Chen, Nan Wang, (2009)" The Description and Calculation of Quality of Composite Services", IEEE. |
| [21] | Natallia Kokash, "Web Service Discovery with Implicit QoS Filtering" Available online at :http://homepages. cwi.nl/ ~kokash/documents/PhDICSOC.pdf 2006 - retrieved March 2012. |
| [22] | B. Medjahed and A. Bouguettaya, “Context-based Matching for Semantic Web Services”, Service Composition for the Semantic Web, Springer Science and Business Media, LLC, 2011. |
| [23] | Michael Rambold, Holger Kasinger, Florian Lautenbacher and Bernhard Bauer, “Towards Autonomic Service Discovery – A Survey and Comparison” , IEEE International Conference on Services Computing ,2009. |
| [24] | Youngkon Lee, ” Web Services Registry implementation for Processing Quality of Service”, IEEE International Conference on Advanced Language Processing and Web Information Technology, 2008. |
| [25] | Yannis Makripoulias et al., ” Web Service discovery based on Quality of Service", IEEE 2006. |
| [26] | Ding Ding, Lei Liu, Hartmut Schmeck, "Service Discovery in Self-organizing Service-oriented Environments” IEEE Asia-Pacific Services Computing Conference, 2010. |
| [27] | http://help.eclipse.org/indigo/index.jsp?topic=/org.eclipse.jst.ws.consumption.ui.doc.user/tasks/tuddiexp.html Retrieved on February 2012. |
| [28] | http://www.infoq.com/articles/rest-discovery-dns Retrieved on February 2012. |
| [29] | http://xmpp.org/extensions/xep-0030.html Retrieved on February 2012. |
| [30] | http://docs.oracle.com/cd/B31017_01/integrate.1013/b31008/wsil.htm Retrieved on March 2012. |
| [31] | James E. Powell et al., "A Semantic Registry for Digital Library Collections and Services", doi:10.1045 /november2011-powell, Retrieved on March 2012. |
| [32] | Kyriakos Kritikos and Dimitris Plexousakis Semantic,” QoS Metric Matching” Proceedings of the European Conference on Web Services (ECOWS'06)”, IEEE 2006. |
| [33] | Elena Meshkova, Janne Riihijärvi, Marina Petrova, Petri Mähönen , ” A survey on resource discovery mechanisms, peer-to-peer and service discovery frameworks’, Computer Networks 52 2097–2128, Elsevier, 2008. |
| [34] | Ahmed Al-Moayed and Bernhard Hollunder, "Quality of Service Attributes in Web Services", IEEE Fifth International Conference on Software Engineering Advances, 2010. |
| [35] | Ali ShaikhAli, Omer F. Rana, Rashid Al-Ali, David W. Walker, " UDDIe: An Extended Registry for Web Services", Proceedings of the IEEE Symposium on Applications and the Internet Workshops, 2003. |
| [36] | Eyhab Al-Masri and Qusay H. Mahmoud, "Discovering the Best Web Service: A Neural Network-based Solution",Proceedings of the IEEE International Conference on Systems, Man, and Cybernetics,2009. |
| [37] | Marc Oriol Hilari, "Quality of Service (QoS) in SOA Systems. A Systematic Review", Master Thesis, Available at: http://upcommons.upc.edu/pfc/bitstream/2099.1/7714/1/Master%20thesis%20-%20Marc%20Oriol.pdf- Retrieved on February 2012. |
| [38] | Bill Inmon, "Making the SOA Implementation Successful", published in TDAN.com, Available at: http://www. tdan.com/view-articles/4593, 2006 - retrieved on February 2012. |
| [39] | Rickland Hollar, (2003)" Moving toward the Zero Latency Enterprise" SOA World Magazine Article, 2003 Available at: http://soa.sys-con.com/node/39849 retrieved on February 2012. |
| [40] | Eyhab Al-Masri and Qusay H. Mahmoud, "Discovering the Best Web Service: A Neural Network-based Solution", Proceedings of the IEEE International Conference on Systems, Man, and Cybernetics, 2009. |
| [41] | Ruben Lara, Miguel Angel Corella, Pablo Castells, “A flexible model for service discovery on the Web, Semantic Web Services with WSMO”, Special Issue on Semantic Matchmaking and Resource Retrieval, International Journal of Electronic Commerce, Volume 12, Number 2, 2008. |
| [42] | http://www.membrane-soa.org/soa-registry/ - Retrieved on February 2012 |
| [43] | Daniel Schall, Florian Skopik, and Schahram Dustdar,” Expert Discovery and Interactions in Mixed Service-Oriented Systems”, IEEE Transactions on Services Computing, 2011. |
| [44] | Yu-Huai TSAI, San-Yih, HWANG, Yung TANG, “A Hybrid Approach to Automatic Web Services Discovery”, IEEE International Joint Conference on Service Sciences, 2011. |
| [45] | Andreas Wombacher,” Evaluation of Technical Measures for workflow similarity based on Pilot study”, LNCS, Springer, 2006. |
| [46] | Ehsan Emadzadeh et al., Quality Attributes and Classification of Schema matchers”, Second IEEE International conference on computer Engineering and Applications”, 2010. |
| [47] | Minghui Wu, Fanwei Zhu, Jia Lv, Tao Jiang, Jing Ying, "Improve Semantic Web Services Discovery through Similarity Search in Metric Space", Proceedings of the Third International Symposium on Theoretical Aspects of Software Engineering, IEEE, 2009. |
| [48] | Bensheng Yun, "A New Framework for Web Service Discovery Based on Behaviour", IEEE Asia pacific Services Computing Conference, 2010. |
| [49] | Stefan Dietze, Alessio Gugliotta and John Domingue, “Exploiting metrics for similarity-based semantic web service discovery", IEEE International Conference on Web Services, 2009. |