-
Paper Information
- Paper Submission
-
Journal Information
- About This Journal
- Editorial Board
- Current Issue
- Archive
- Author Guidelines
- Contact Us
Clinical Medicine and Diagnostics
p-ISSN: 2163-1433 e-ISSN: 2163-1441
2018; 8(4): 63-68
doi:10.5923/j.cmd.20180804.02

Measurement of Serum Vitamin D25 Level in Normal Egyptian Population
 Abstract
 Reference
 Full-Text PDF
 Full-text HTML
Sabila Gomaa Mousa1, Sahar Mohamed Ismail1, Nagwa Abd El Ghaffar Mohamed2, Omima Ahmed Abd Allah Hassan3
1Internal Medicine Department, Faculty of Medicine (for girls), Al-Azhar University, Cairo, Egypt
2Clinical and Chemical Pathology Department, National Research Center, Cairo, Egypt
3Internal Medicine Department, Al-Haram hospital, Ministry of Health, Cairo, Egypt
Correspondence to: Sahar Mohamed Ismail, Internal Medicine Department, Faculty of Medicine (for girls), Al-Azhar University, Cairo, Egypt.
| Email: |  |
Copyright © 2018 The Author(s). Published by Scientific & Academic Publishing.
This work is licensed under the Creative Commons Attribution International License (CC BY).
http://creativecommons.org/licenses/by/4.0/

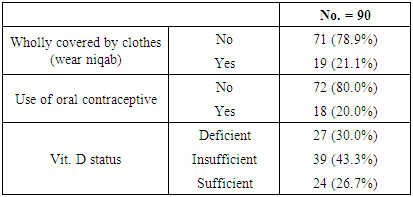
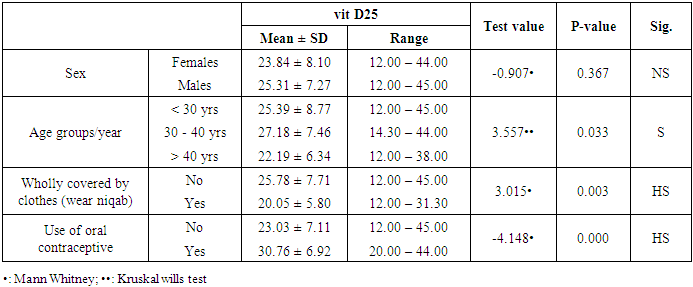
Background: Vitamin D deficiency is a common problem in the world. Leading to osteopenia, osteoporosis, and bone fracture. Objective: we amid to measure serum vitamin D level in healthy Egyptian individuals. Subjects and Methods: Ninety healthy individuals with 45 males (50%) with age ranged 20-59 with mean (35.69 ± 10.64) and 45 females (50%) with age ranged 18-58 years with mean (38.20±11.80) participant in this study, all participants allocated from outpatient clinic for routine checkup of internal medicine department of Al-Zahraa University Hospital of Al-Azhar University and Al-Haram Hospital, Cairo, Egypt. Results: 27 (30.0%), 39 (43.3%) 24 (28.7%) had deficient, insufficient and sufficient vitamin D (vit D), respectively. There was a highly significant reduction in mean (20.05 ± 5.80) of vit D25 in peoples wholly covered by clothes (wear niqab) when compared to mean (25.78 ± 7.71) of vit D25 in peoples not wholly covered by clothes (not wear niqab) (p<0.01). There was a highly significant elevation in the mean (30.76 ± 6.92) of vit D25 of peoples used contraception vs. mean (23.03 ± 7.11) of vit D25 in peoples not used contraception (P<0.01). There was a significant difference between age groups as regard vit D25 individuals with age more than 40 have lowest one (22.19 ± 6.34) followed by age less than 30 (25.39 ± 8.77) while age between 30 to 40 have the highest one (27.18 ± 7.46) (P<0.05). Whereas there was an insignificant reduction in females vs. males. Conclusion: we noticed that the deficiency of vitamin D increased among healthy Egyptian populations, also vitamin D deficiency more common in females, in peoples older than 40 years and peoples wear the niqab.
Keywords: Normal populations, Vitamin D25
Cite this paper: Sabila Gomaa Mousa, Sahar Mohamed Ismail, Nagwa Abd El Ghaffar Mohamed, Omima Ahmed Abd Allah Hassan, Measurement of Serum Vitamin D25 Level in Normal Egyptian Population, Clinical Medicine and Diagnostics, Vol. 8 No. 4, 2018, pp. 63-68. doi: 10.5923/j.cmd.20180804.02.
Article Outline
1. Introduction
- Vitamin D is a fat-soluble vitamin, found in much food as Cod-liver oil, meat, egg, milk products, and mushrooms. It is also produced endogenously when ultraviolet radiation of wavelength 290-320 nm from sunlight stimulates photolysis of 7 dehydrocholesterol [1]. Vitamin D that is coming from sunlight exposure, food, or by drugs supplementation is inactive provitamin, and so it is activated by two hydroxylation processes. The first occurred in the liver by 25 hydroxylase enzymes into 25 hydroxyvitamin D (25(OH) D) and the second hydroxylation by the 1αhydroxylase enzyme to active form 1, 25 hydroxyvitamin D in the kidney [2].The most important roles of vitamin D is to maintain calcium homeostasis in the body by increasing intestinal calcium absorption, increasing resorption of bone by increasing osteoclast activity, maintaining blood calcium and phosphate levels for bone formation, and regulate parathyroid hormone production to keep on blood calcium levels [3].Vitamin D increase intestinal calcium and phosphate absorption; stimulate phosphate reabsorption at renal tubule; stimulate secretion of calcium into the blood from bone. Vitamin D is metabolized in the liver and excreted in urine [4].Vitamin D3 (VD3) is a potent immunomodulatory steroid hormone, and it has paracrine, autocrine action. The activation of the cellular transcriptional process resulting in the production of beta-defensin and cathelicidin, activating the Th1 pathway, associated with innate immunity against bacteria. Also, the action of vitamin D is associated with adaptive immunity, Th2 response, and production of cytokines as interleukin 4, interleukin 5, and with suppression of Th17 and B lymphocyte [5].Vitamin D has a role in the regulation of adipogenesis and adipocyte apoptosis by interacting with m VDR. Through it is genomic action; also has a role in the regulation of energy metabolism by controlling the production of uncoupling proteins and the appetite suppressing hormone leptin [6].Deficiency of vitamin D is usually due to sunlight unexposure (by topical sunscreen uses, increased melanin pigment, change in latitude, and winter season). Also, due to inadequate diet, malabsorption due to a variety of disease (such as in inflammatory bowel disease, celiac diseases, liver disease, kidney disease and after cholecystectomy), increased requirement, or increased excretion of vitamin D. Keep on blood vitamin D3 at 30 ng/mL or more is mandatory to maintain normal health; by increase vitamin D containing food and by increase sunlight exposure [7].Vitamin D deficiency is leading to osteopenia, osteoporosis, and increase the risk of bone fracture because of vitamin D deficiency change the mineral metabolism of the body and stimulation of bone resorption [3].Vitamin D deficiency is related to insulin resistance, impairment in insulin secretion, and impaired glucose homeostasis, and thus increased the risk for type 2 diabetes mellitus (T2DM) [8]. So, we aimed to measure serum vitamin D level in healthy Egyptian individuals.
2. Subjects and Methods
2.1. Subjects
- A total of 90 healthy individuals with 45 males (50%) with age ranged 20-59 with mean (35.69 ± 10.64)) and 45 females (50%) with age ranged 18-58 years with mean (38.20 ± 11.80) participant in this study, all participants allocated from outpatient clinic for routine checkup of internal medicine of Al-Zahraa University Hospital of Al-Azhar University and Al-Haram Hospital Cairo, Egypt. Informed oral consent was obtained from every individual after explaining the content and implication of the study, which was approved by the local ethical committee at Al-Azhar University.
2.2. Methods
- Clinical assessment: full medical history and clinical examination were performed to all participants in the study. Also, anthropometric measurement as height, weight, and body mass index was measured for every individual.Laboratory assessment: laboratory test including, complete blood count (CBC), liver function test (Serum albumin, bilirubin, Aspartate aminotransferase (AST), Alanine aminotransferase (ALT) and Alkaline phosphatase), serum urea, and serum creatinine were done for all participant. Also, serum calcium (total and ionized) and serum level of vitamin D25 were done.
2.2.1. Exclusion Criteria
- We exclude any causes can affect the level of vitamin D such as;Ÿ Patients are taking vitamin D supplementation.Ÿ Obesity.Ÿ Diabetes mellitus patients.Ÿ Autoimmune diseases.Ÿ Hyperlipidemia.Ÿ Cardiovascular diseases patients.Ÿ Chronic kidney and chronic liver disease.Ÿ History of malignancy.Ÿ Thyroid and parathyroid disease.
2.2.2. Sample Collection
- Five ml of venous blood was collected by venipuncture into plastic serum tubes. Care was taken to avoid hemolysis. Each blood sample was divided into two portions as follows: The first portion (2 ml) blood sample was collected from each patient into EDTA containing tube for estimation of CBC, AND the second portion should be separated from the cells as soon as possible by centrifugation at 3000 xg for 5 minutes. Part of the sera was used immediately for routine laboratory tests (ALT, AST, liver function test, urea, and creatinine). The second part of separated serum was stored at -20°C until analysis of total and ionized calcium and vitamin D. Determination of serum albumin, serum total, and serum ionized calcium were carried out on Dimension RxL Max analyzer (Siemens Healthcare GmbH-Henkestr, Erlangen, Germany) by colorimetric techniques.Serum vitamin D25 was measured by using electro-chemiluminescence binding assay (ECLIA) on Cobas e411 immunoassay analyzer (Roche Diagnostics GmbH, D-68289 Mannheim, Germany). If the vitamin D25 level ≤20 ng/ml recognized as vitamin D25 deficiency, while the level ranged between 21-29 ng/ml defined as vitamin D25 insufficiency, while the sufficient level of vitamin D ≥30 ng/ml [9].
2.2.3. Statistical Analysis
- We calculated sample size according to Raosoft, and all statistical calculations were done using SPSS (statistica package for the social science version 25.00) statistical program. At 0.05, 0.01 and 0.001 level of probability [10] was done using non-parametric tests, Mann withny, chi-square (X2) test, Kruskal wills test, and Spearman correlation. The confidence interval was set to 95% and the margin of error accepted was set to 5%. The p-value was considered non significant (NS) at the level of > 0.05, significant at the level of < 0.05, 0.01 and highly significant at the level of < 0.001.
3. Results
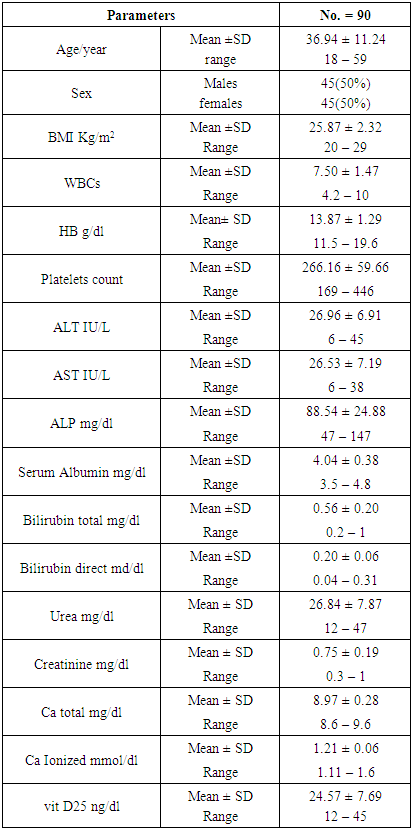
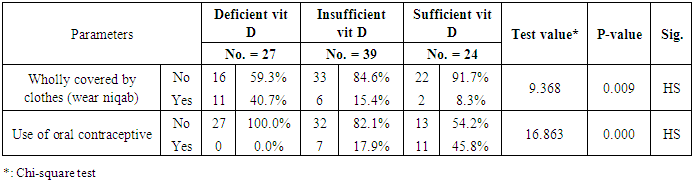
- The clinical and laboratory features are summarized in table (1). A total of 90 normal peoples were included in the study among them, 45 (50%) were males and 45 (50%) were females; the mean vitamin D was (24.75 ± 7.69 ng/ml), the mean Ca was (8.97 ± 0.28 mg/dl), and the mean ionized Ca was (1.21 ± 0.06 mmol/dl) for all peoples.
|
|
|
|
|
|
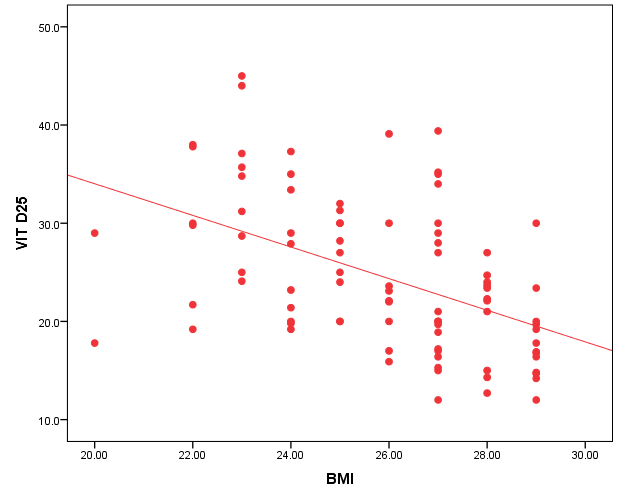
 | Figure 1. Correlation between vit D25 and BMI |
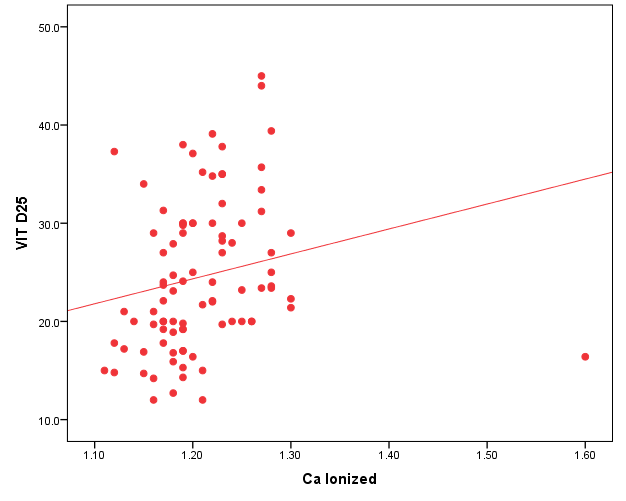
 | Figure 2. Correlation between vit D25 and ionized Ca |
4. Discussion
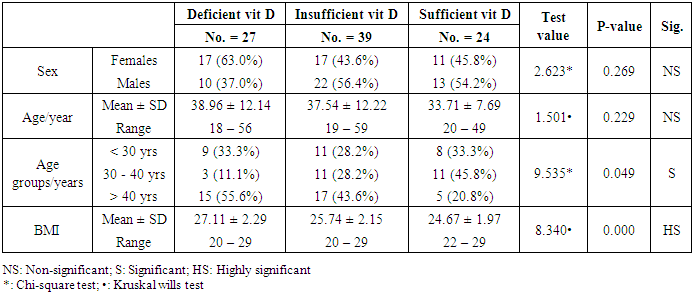
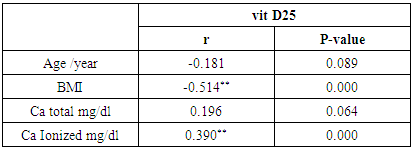
- In the current study, we found vitamin D deficiency [27 (30%)] and insufficiency [39 (34.3%] increased among normal populations, 66 persons from totally 90 studied healthy individuals were within vitamin D deficiency and insufficiency range. Also, we found vitamin D deficiency more common in women’s than men’s. Similar observation has been shown by Hovsepian and his colleagues [11], they were reported the increased prevalence of vitamin D deficiency (50.8%) and insufficiency (19.6%) between adult peoples and also increase between women and younger adult, also they were noticed those females were more exposed to vitamin D-deficient than males, especially for severe vitamin D deficiency whereas no significant difference. Also, Scharla and Scheidt [12] noticed the prevalence of vitamin D among adult population 14-59% with high prevalence in Asian countries.Also similar to our results a study done by Fawzi and his colleagues [13], they found a prevalence of vitamin D deficiency is 79.2% among females, another study done on 75 adolescent females with a mean age of 14–17 years revealed a prevalence of vitamin D deficiency and insufficiency are 21.3% and 24%, respectively [14].Botros and his colleagues [15] reported the high prevalence of vitamin D deficiency between healthy Egyptian females. 72.6% of the nursing group, 54% of the pregnant group, 72% of the childbearing age group, 39.5% of the elderly group, and 77.2% of the geriatric group. Also, other study noticed the prevalence of decrease vitamin D25 concentration was highly significant in females in comparison to males in Chinese and Malay peoples while in Indians prevalence of decrease vitamin D25 concentration was similar among males and females [16].Hashemipour et al. [17] reported the prevalence of severe and moderate vitamin D deficiency was 9.5% and 57.6%, respectively. Mild vitamin D deficiency had a prevalence of 14.2%.Furthermore our study showed vitamin D deficiency and insufficiency is increased in all age group but more increase in subject older than 40 years old, the percentage of vitamin D deficiency and insufficient was 15 (55.6%) and 17 (43.6%) the previous study reported the prevalence of vitamin D deficiency ranged between 1.6-14.8% in different age groups in the USA and some Scandinavian countries were vitamin D fortified foodstuffs are available but in other countries where vitamin D supplementation not available, the deficiency more prevalent [18].Similar results were reported Souberbielle previously and his colleagues [19], they showed that vitamin D deficiency prevalence 14-59.6 in middle age and elderly people. Also, another study was showed increased vitamin D deficiency in elderly [20].In the current study, we found there was a highly significant decrease of vit D25 in subjects wear the niqab compared to non-wear (p<0.01). Similar results previously reported by Botros and his colleagues [15], they noticed vitamin D was significantly lower in veiled females (16.7 ng/dl) in comparison to non-veiled females (23 ng/dl).Our results showed there was a highly significant increase of vit D25 of subjects take oral contraception compared to subjects not take contraception (P<0.01). Similar results previously reported by Wyon and his colleagues [21], they reported that the contraception that contains estrogen increase serum vitamin D25 level in premenopausal women with a magnified effect in those taking vitamin D supplementation.As regarding BMI, we found when BMI increase the vit D deficiency increase (P<0.01). This is similar to study by Parikh et al. [22] and Lagunova et al. [23], they were found that obesity leads to decrease vitamin D25 levels, increased PTH levels and decreased 1, 25 hydroxyvitamin D levels. Also, Man et al. [16] reported that obesity was related to both vitamin D25 insufficiency and deficiency.Also, we noticed there was a highly significant negative correlation between BMI and vitamin D (r=-0.515, P=0.000). Similar to our finding Ramel et al. [24], they reported that BMI was a significant negative correlation with serum vitamin D25 in hospitalized elderly patients.Obesity decrease fat-soluble vitamin D due to multifactorial causes, accumulation of vitamin D in fatty tissue, and another cause the obese person prefer to stay more time in the home and not exposed to sunlight, hence decrease the production of vitamin D from the skin. Vitamin D deficiency leads to weight gain and obesity due to reducing the leptin which is appetite suppressing hormone [25, 26].Vitamin D deficiency is increasing among the Egyptian population although Egypt is sunny country this may be due to many factors, uses of topical sunscreen, most women prefer to wear scarf and another cover the face, atmospheric pollution, and increased skin pigmentation in some peoples, insufficient intake of food containing vitamin D, and there is no fortification of food by vitamin D.
5. Conclusions
- We noticed that the deficiency of vitamin D increased among healthy Egyptian populations, also vitamin D deficiency more common in females, in peoples older than 40 years, and peoples wear the niqab.
6. Recommendations
- 1. Another large study in different areas of Egypt to confirm our results.2. Routine checkup of vitamin D.3. Fortification of food stuff by vitamin D.