-
Paper Information
- Paper Submission
-
Journal Information
- About This Journal
- Editorial Board
- Current Issue
- Archive
- Author Guidelines
- Contact Us
Clinical Medicine and Diagnostics
p-ISSN: 2163-1433 e-ISSN: 2163-1441
2018; 8(3): 45-52
doi:10.5923/j.cmd.20180803.02

Drinking Water Fluoride and Intelligence Quotient in School Children
 Abstract
 Reference
 Full-Text PDF
 Full-text HTML
Asmaa Abd EL Wakeel El Sehmawy1, Safaa Mahmoud Hammouda2, Gamil E. Ibrahim3, Samia S. Barghash4, Reham Y Elamir5
1Department of Pediatrics, Faculty of Medicine, Al-Azhar University, Cairo, Egypt
2Department of Psychiatry, Faculty of Medicine, Al-Azhar University, Cairo, Egypt
3Chemistry of Flavour & Aroma Department, National Research Center, Dokki, Egypt
4Department of Forensic Medicine and Clinical Toxicology, Faculty of Medicine, Al-Azhar University, Egypt
5Department of Public health, Faculty of Medicine, Cairo University, Egypt
Correspondence to: Asmaa Abd EL Wakeel El Sehmawy, Department of Pediatrics, Faculty of Medicine, Al-Azhar University, Cairo, Egypt.
| Email: |  |
Copyright © 2018 The Author(s). Published by Scientific & Academic Publishing.
This work is licensed under the Creative Commons Attribution International License (CC BY).
http://creativecommons.org/licenses/by/4.0/

Background: Fluoridation of drinking water, being regarded as one of the top ten public health achievements of the twentieth century. Excessive fluoride intake during infancy and early childhood, causes a number of irreversible structural and functional changes in the CNS leading to memory, learning and intellectual deficits. Aim: The present study was conducted to detect the fluoride, arsenic and cadmium levels in drinking water of six different locations in Egypt (Beheira Governorate), and compare the IQ levels of children aged 4.6-11 years of the same locations, with fluoride levels. Materials and Methods: A cross–sectional study was conducted among 1000 children aged 4.6-11 years. From each area sample (1000 cc) of tap water was collected in clean glass. After collection of water samples, they were sent to and transmitted to laboratory in National Research Center in Cairo for the estimation of fluoride, cadmium and arsenic. IQ evaluation was done using Draw-A-Person (DAP) test. Results: Highly significant increase fluoride level in the tap water than the WHO and the Egyptian allowed level. Significant decrease in average IQ level in group of children with high fluoride level more than 1.5 mg/dl than the group of children with low fluoride level. Conclusion: Areal relationship between fluoride exposure and intelligence with the average IQ of high fluoride group was lower than those with lower fluoride level.
Keywords: Fluoride, Arsenic, Cadmium, Tap water, Egypt, Intellectual quotient
Cite this paper: Asmaa Abd EL Wakeel El Sehmawy, Safaa Mahmoud Hammouda, Gamil E. Ibrahim, Samia S. Barghash, Reham Y Elamir, Drinking Water Fluoride and Intelligence Quotient in School Children, Clinical Medicine and Diagnostics, Vol. 8 No. 3, 2018, pp. 45-52. doi: 10.5923/j.cmd.20180803.02.
Article Outline
1. Introduction
- Exposure of the children to chemicals during growth and development of their cognitive and physical stages may have serious consequences with the majority focusing on the adverse effects on the Central Nervous System (CNS) [1].Water is essential natural resources for maintaining life. Though water is suitable to be used for domestic, industrial or agricultural purposes, it is majorly decided by its chemical composition [2]. Fluoride is a naturally occurring compound derived from fluorine. It is found in air, rocks, soil, fresh water and sea. [3] Fluoride causes bioaccumulation significant effects on human health through drinking water and on other living organisms. Fluoride has beneficial effects on teeth at low concentrations and is detrimental at higher ones [4].Water fluoridation has been shown to be an important public health measure for reducing caries prevalence around the world [5] and has been recommended by the World Health Organization on account of its effectiveness and safety [6]. It is important that water fluoridation occurs at appropriate levels; otherwise, it can cause fluorosis [7].Fluoride is often described as a “double-edged weapon” as inadequate ingestion is associated with dental caries, where as excessive intake also has detrimental neurological effects. Fluoride has the ability to form lipid soluble complexes that can penetrate the blood brain barrier in the fetus and accumulates in cerebral tissues before birth thereby affecting intelligence [8]. Some studies reveal that fluoride can induce structural changes in the brain physics and biochemistry which affect the mental development, learning disorders, and decrease intelligence and hyperactivity in children during critical cognitive stages, such as learning and memory, specifically in the fetal and first 8 years of life [9].Fluoride toxicity may be due to (i) As the fluoride comes in contact with moisture result in the formation of hydrofluoric acid and this acid formation results in burning of tissues due to low pH. (ii) Calcium forms chemical complexes with fluoride leading to hypocalcemia that can cause inhibition of the physiological neve impulse and function. (iii) Inhibition of enzymes required for the physiological functioning of cells may result from cellular poisoning (iv) Electrolyte imbalance as hypocalcemia and hyperkalemia may result in disturbances in cardiac rhythm and other cellular function. (v) Fluoride attacks oxygen and disrupt the metabolism resulting in the production of hydrogen peroxide, decrease the activities of superoxide dismutase and glutathione peroxidase the consequences being increased free radicals that disrupt the antioxidant formation [10].Excess fluoride in blood may cause altered brain lipid metabolism and concentrations of protein, free amino acid, and RNA in the brain. Animal studies on rabbits found that sodium fluoride injection stimulated the hydrolysis of phosphoinositide by activation of a G protein (Gp). This protein acts as a transducer between receptors and phospholipase C. G protein-coupled receptors mediate the release of many neural transmitters including the catecholamines, serotonin, acetylcholine, and the excitatory amino acids. They also are involved in regulating glucagon, vasopressin, neuropeptides, endogenous opioids, prostaglandins, and other important systemic influences on the brain and behavior [11].Arsenic is one of the most common environmental toxins. Drinking water is considered the most important route of exposure in millions of children in countries with high levels of arsenic in water, such as Argentina, Chile, Mexico, China, Hungary, India, Bangladesh and Vietnam. Other sources of exposure are inhalation of polluted air and dust have been reported [12].Elevated concentration of naturally occurring fluoride (F) or arsenic (As) in drinking water is a worldwide problem. Many countries have a water level for the fluoride and arsenic above the World Health Organization (WHO) guideline values which is 1.5mg/L and 10μg/L, for fluoride and arsenic respectively [4, 13]. The recommended optimal fluoride level in community water systems by US Public Health Service (USPHS) for fluoride concentrations is 0.7 mg/l. [14]. The allowed range of fluoride levels in drinking water is in EPA is 0.6 to 0.8 mg/l, with a target of 0.7 mg/l [15]. Cadmium is a soft, silver-white metal. Cadmium chloride and cadmium sulfate are soluble in water. Cadmium is a common environmental pollutant in food, especially in cereals, vegetables, root crops, sea food, and meat offal, and also in tobacco smoke [16, 17]. Cadmium can enter into the drinking water by the penetration of industrial waste products containing cadmium into water distribution network and also penetration via polyethylene tubes and containers (water bottles) [18].High doses of cadmium, a common contaminant in cereals and vegetables [19] caused neurotoxicity in experimental animals [20, 21] and some early studies reported associations of childhood cadmium exposure with mental retardation, learning difficulties, dyslexia and deficits in visual motor tasks, IQ and behavior in young children [22].The aim of the current study was to detect the fluoride, arsenic and cadmium levels in drinking tap water of six different locations in Egypt (Beheira Governorate) and to compare the Intelligence quotient levels of school children aged 4.6 -11years of the same locations with the fluoride levels.
2. Material and Methods
2.1. Study Design
- This is a cross-sectional study carried out on six different areas in Egypt, Beheira Governorate, two different towns (urban) and four village (rural), the towns are Itay Elbaroud Center and two villages belong to it, the second town is Shubra Khit Center and two villages belong to it. The town and the belonging villages are supplied by the same water station.From each area sample (1000 cc) of tap water was collected in clean glass. After collection of water samples, each glass containing a sample was identified in its area and was sent within 42 hours to the laboratory in National Research Center in Cairo for the estimation of fluoride and arsenic. The water samples were analysed for fluoride content by using the sodium-2-arasulphophenylazo-1-8-dihydroxy-3, 8 naphthalene disulphonate (SPADNS) by UV-Vis Shimadzu (UV-1601, PC) spectrophotometer [23]. Inductively couple plasma mass spectrometer (ICP, Perkin Elmer, ELAN DRC-e) was selected for the analysis of arsenic and cadmium [24]. The duration of the study was 8 months, and the sample collection was carried out during the first and second semesters in Egyptian schools.
2.2. Study Population
- Across-sectional study was carried out among 4.6 – 11year-old school going children in the mentioned area and their numbers were (1000 children). The applied questioner was given to the child parent including the following data (socioeconomic level, education degree, residence in the same areas since child birth, the general health of the child). Informed consent was obtained from the parents and respective school authorities.Inclusion Criteria: Children enrolled in the study were 4.6 – 11 years of age and had:Ÿ Similar socio-economic status.Ÿ Normal birth history.Ÿ Continuous residents of the study area since birth and drinking water from the same source.Ÿ No history of chronic illness specially CNS problem, trauma to the head and not taking any medications. Ÿ Paternal education of the children range from high institute graduation to faculty graduation. Exclusion Criteria:Children excluded from the study had:Ÿ History of head trauma or other CNS disorders.Ÿ Any congenital or acquired diseases affecting intelligence.Ÿ Children who had a change in the source of drinking water since birth.
2.3. IQ Evaluation was Done Using
- The Draw-A-Person (DAP) test is a valuable instrument for the assessment of IQ, not only because it is easy to administer, but also for its multiple uses [25]. The children’s drawings reflect their intellectual development, not just their visual-motor skills, therefore DAP test is useful for assessing children IQ between the age of four and thirteen [26].The DAP test is a stable instrument, easily scored as the intra-rater reliability is 0.95, and it is little influenced by the internal (such as the culture background) and external (such as different time and place) factors of the scorer [27, 28].To administer the DAP: IQ, the student is asked to draw the very best picture for the most beautiful man who sees in his life if possible. Take your time and work carefully. Now go ahead. Raise your hand if you have a question or when you have completed your drawing. And the allowed time not determined but range from 10-15 minutes. Be sure to draw the whole body, not just head and draw it from the front not from the side. Do not draw a cartoon or stick figure [25]. Each part takes a score; the scores are collected and converted to the mental age (MA). IQ= Mental Age\ age in months x 100 [30].
2.4. Statistics
- Data were collected, revised, coded and entered to the Statistical Package for Social Science (IBM SPSS) version 20. Statistical Analysis Software. The statistical tools used include – Mean, Standard Deviation and T test.
3. Results
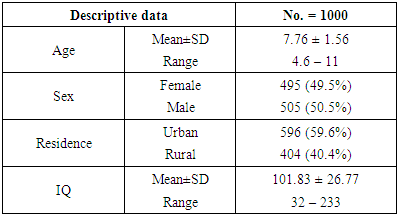
- Table (1): Descriptive data of the studied children, shows that the mean age was (7.76 ± 1.56), 49.5% were female and 50.5% were male (59.6%) were resident in rural areas while 40.4% in urban areas and the mean IQ of them was (101.83 ± 26.77).
|
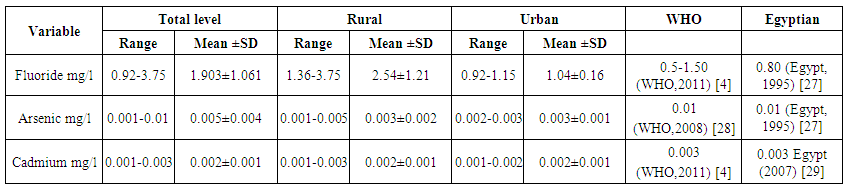 | Table (2). Total, rural and urban fluoride arsenic and cadmium levels in drinking (tap) water and guidelines standard for all |
|
|
|
|
4. Discussion
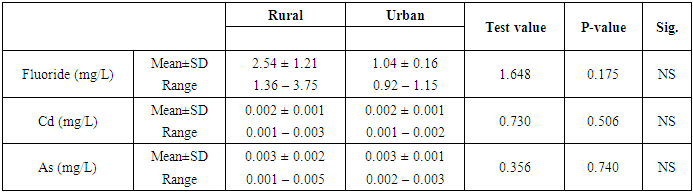
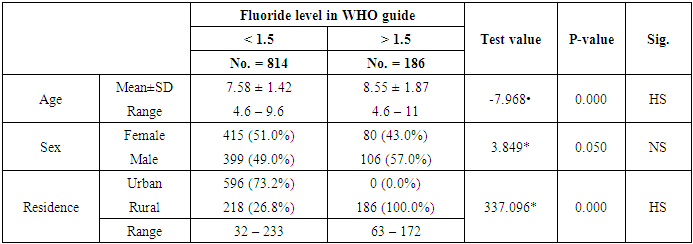
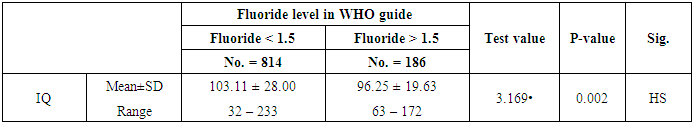
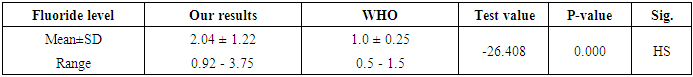
- The present study was a cross-sectional study conducted on a stratified random sample of 1,000 schools going children selected from 6 different areas in Elbehira government two towns and four villages each town and the belonging village are supplied by the same Water Station. They were 495 (49.5%) female and 405(50.5%) male their age range 4.6 – 11years (59.6%) were resident in rural areas while 40.4% in urban areas and the mean IQ of them was (101.83 ± 26.77). According to the World Health Organization (WHO) guideline values for fluoride and arsenic was 1.5mg/L and 0.01mg/L, respectively, We classify the fluoride level according to this level in two groups one below 1.5 mg/dl and group above 1.5 mg/dl also we classify it to rural and urban level. In the present study the fluoride level was (1.903 ± 1.06) mg/l which is highly statistically significant higher than the WHO level and the Egyptian level which was (0.5 ± 1.5) mg/l and (0.8) mg/l respectively.In a study done by Hassan et al. [34], the tap water samples were taken from ten governorates around Egypt (Cairo, Giza, Kaliobia, Fayoum, Menia, Mansoura Alexandria and Ismailia), he found that the higher water fluoride level was in the groundwater coming from artesian wells in the two governorates of Marsa Matrouh and Arish with its range 0.761 and 0.926 mg/L for Marsa Matrouh and Arish respectively, while the range of fluoride content in the tap water was 0.330 - 0.377 mg/L with an average of 0.36 mg/L for the other areas.Salem et al. [35] in a study of the estimation of some chemical pollutants in drinking water and surface water in upper Egypt, it was found out the fluoride level in drinking water is (0.13 ± 0.06), (0.068 ± 0.03), (0.093 ± 0.048) and (0.093 ± 0.03) in Aswan, Qena, Assuit and Beni Suef respectively their results revealed that fluoride levels were below all the maximum contaminant levels (MCLs) for fluoride in drinking water of human-being and livestock.Walia et al. [36] in a study of the estimation of fluoride concentration in drinking water and common beverages in United Arab Emirates (UAE) in four different emirates, they revealed that higher fluoride content in the tap water was in Ajman while lower one was in water samples of Abu Dhabi and Dubai with the fluoride range between 0.04 and 0.3 mg/L.The study done on Africa by Dirisu et al. [37] on drinking water supplies, Omoku, Nigeria and its fluoride content was analyzed, revealed that the mean fluoride level obtained was (0.86 ± 0.30 mg/L), they conclude that fluoride content of public tap water within the minimum limit of WHO.In the present study we found that the mean arsenic and cadmium levels in tap drinking water was (0.005 ± 0.004mg/l) and (0.002 ± 0.001 mg/l) for arsenic and cadmium respectively which are below the recommended WHO and the Egyptian level for all.In consistent with these results, El-Harouny et al. [38] they found that the mean arsenic level in tap drinking water was (0.29μg/L) which are below the recommended WHO (10 μg/L) and USEPA (50μg/L) levels. In a study of chemical quality of tap water versus bottled water: evaluation of some heavy metals and elements content of drinking water in Dakhlia Governorate -Egypt. Also, Al Fraij et al. [39] in Kuwait revealed that arsenic level in drinking and bottled water was below WHO recommended levels.Saleh et al. [40] also revealed that arsenic in tap drinking water could not be estimated in Cairo and Giza by inductively coupled plasma mass spectrometry (ICP/MS) because it was below the instrument detection limit which is (0.06 μg/L).Salem et al. [35] in a study of the estimation of some chemical pollutants in drinking water and surface water in upper Egypt. They revealed that Cadmium can’t be detected in drinking water in many samples from Aswan and Qena cities and from the other water sources. Badr et al. [41] in study of heavy metals in drinking water and human health, Egypt (Shebin El-Kom city, Menoufiya Governorate) they were found that low cadmium level in tap drinking water below the WHO and the Egyptian stander. El-Harouny et al. [38] found the mean cadmium level in tap water in their study was (0.45 ± 0.16 μg/L) which within the accepted recommended levels by WHO (3 μg/L) and USEPA (5 μg/L). Also, our result was in agreement with those of Mohamed and Osman [42] in Greater Cairo. Al Fraij et al. [39] in Kuwait, Saleh et al. [40] in Cairo and Giza and Tayyeb et al. [43] in Saudi Arabia.In this study there’s an increase in drinking water fluoride level in rural than the urban areas but not reach the significant level with mean level which was (2.54 ± 1.21) and (1.04 ± 0.16) for rural and urban respectively and no difference between the arsenic and cadmium level in rural and urban areas and all below the allowed level.In this study there’s a highly significant decrease in average IQ level in group of children with high fluoride level more than 1.5 mg/dl than the group of children with low fluoride level less than 1.5 mg/dl with the mean IQ was (96.25 ± 19.63) and (103.11 ± 28.00) for both groups respectively with p value (p < 0.001).The impact of fluoride on IQ has been reported in several studies in Iran Karimzade et al. [44] and Poureslami et al. [45] the mean IQ of children living in low drinking water fluoride region was higher than that of children living in higher drinking water fluoride regions. Also, Seraj et al. [8] showed that the average IQ scores decreased from the normal fluoride group (97.77 ± 18.91) to medium fluoride group (89.03 ± 12,99) to high fluoride group (88.58 ± 16.01).Similarly in India, Nagarajappa et al. [9], Shivaprakash et al. [46] and Sudhir et al. [47] they reveal that chronic exposure to high levels of fluoride and water is associated with lower IQ, also Eswar et al. [48] They arrived at the result that 63.2% of children in high fluoride village had IQ less than 90 versus 47.7% of children in low fluoride village but this difference was not found to be statistically significant. Also in India Aravind et al. [49] they found out that IQ level was negatively correlated with fluoride level in drinking water. In a study of the effect of fluorinated water on intelligence in 10-12-year-old school children. Sebastian and Sunitha [50] they found out that significant relationships were found between water fluoride levels and Intelligence Quotient of school children (P < 0.05). In across-sectional study to assess the intelligence quotient (IQ) of school going children aged 10-12 years in villages of the Mysore district, India with different fluoride levels. Khan et al. [51] showed that the overall IQ of the children exposed to low fluoride levels in drinking water was higher than those exposed to high fluoride level and suffering from dental fluorosis in across–sectional study conducted among 429 children aged 6 – 12 years in and around Lucknow district India. In Durango Mexico Amador et al. [52] showed that both fluoride in urine and fluoride in water were significantly correlated with lower IQ in children.The impact of Fluoride on IQ also been reported in several studies by Chinese researchers. Xiang et al. [53], Lu et al. [54], Wang et al. [55] and Li et al. [56] they concluded that a real relationship exists between fluoride exposure and intelligence with the average IQ of high Fluoride group was lower than in control group.Possible mechanisms for the neurotoxic effects of fluoride may be explained by several animal studies. In which there is decreased thickness of post-synaptic density, increased width of synaptic cleft and high cholinesterase activity in brain tissues of rats exposed to high fluoride level [57] [58].Once absorbed in the blood through diet, fluoride forms lipid soluble complexes which cross the blood brain barrier to accumulate in the cerebral tissues and affect the neurological development by different neurotoxic mechanisms, such as free radical generation, inhibition of anti-oxidants and mitochondrial energy enzymes and inhibition of glutamate transporters [59, 60]. Studies in aborted human foetuses have shown a disruption of neurotransmitters, receptors in nerve cells, an increased density of neurons and undifferentiated neuroblasts. There has also been an evidence of reduction in number of mitochondria, rough endoplasmic reticulum (RER) and free ribosomes. The structural and functional changes in the CNS, specifically in the foetal period and the first 8 years of life, may lead to learning and intellectual deficits and cognitive dysfunction [60].
5. Conclusions
- Significant increase fluoride level in the drinking tap water than the WHO and a real relationship exists between water fluoride content and intelligence with the average IQ of high fluoride group was lower than those with lower fluoride level. Millions of children around the world are exposed to high concentrations of fluoride in water and are potentially at risk. Therefore more researches are needed on large scale in Egypt, a close monitoring of fluoride levels in local water supplies and implementing public health measures, such as defluoridation (water treatment by reverse osmosis, combining the use of a natural and biodegradable coagulant with microfiltration processes or water distillation) to reduce the fluoride exposure levels in high fluoride regions seem necessary.
ACKNOWLEDGEMENTS
- This work was supported by pediatric, psychiatric and toxicology department of faculty of medicine for girl-Alazhar university and Cairo-National research center - The authors declare they have no actual or potential competing financial interests. We thank the local school districts for their support in coordinating these efforts and the families who gave their time in participating.