-
Paper Information
- Paper Submission
-
Journal Information
- About This Journal
- Editorial Board
- Current Issue
- Archive
- Author Guidelines
- Contact Us
Clinical Medicine and Diagnostics
p-ISSN: 2163-1433 e-ISSN: 2163-1441
2018; 8(2): 33-39
doi:10.5923/j.cmd.20180802.03

Role of Liver Stiffness Measurement in Prediction of Esophageal Varices in Chronic Hepatitis C Virus Infected Egyptian Patients
 Abstract
 Reference
 Full-Text PDF
 Full-text HTML
Fatma M. El-Senosy, Walaa F. El-baz, Hatem H. Mohammed
Departments of Internal Medicine, Faculty of Medicine (Girls) Al-Azhar University, Cairo, Egypt
Correspondence to: Fatma M. El-Senosy, Departments of Internal Medicine, Faculty of Medicine (Girls) Al-Azhar University, Cairo, Egypt.
| Email: |  |
Copyright © 2018 The Author(s). Published by Scientific & Academic Publishing.
This work is licensed under the Creative Commons Attribution International License (CC BY).
http://creativecommons.org/licenses/by/4.0/

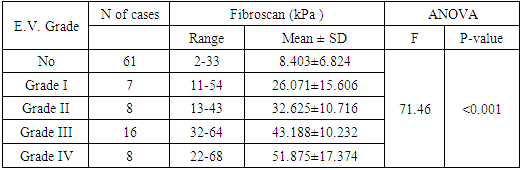
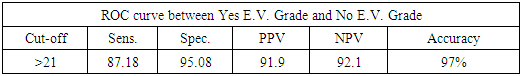
Background; Hepatitis C virus (HCV) infection is a public health problem worldwide. It is estimated more than 185 million people around the world have been infected with it according to the world health organization (WHO). The highest prevalence is in Egypt and constitute about 10-20% of the general population. Bleeding from esophago-gastric varices is the most important complication of cirrhosis. Fibro Scan is a non-invasive device that assesses stiffness of the liver via the technique of transient Elastography. Objective; to evaluate the role of fibro scan in prediction of esophageal varices in chronic HCV infected patients. Patients and methods; A cross sectional prospective study was conducted on 100 Egyptian patients with chronic HCV infection, Studied patients were subjected to full medical history, Routine laboratory investigations, Hepatitis markers including HBsAg, HCV antibody and HCV RNA by real time polymerase chain reaction (PCR), an Abdominal ultrasonography, upper gastrointestinal endoscopy and assessment of liver fibrosis by fibroscan which, was obtained using fibroscan device (Echosens, Paris, France) by an expert fibroscan operator who was not aware by patients data, abdominal ultrasound and upper gastrointestinal endoscopy results were done for all studied patients. Results: liver stiffness measurement revealed patients with values (2-33 kPa with mean ± SD of 8.40 ± 6.82) had no esophageal varices (EV) and patients with values of (11-68 kPa) had EV. And disturbed as the following; (11-54 kPa with mean ±SD of 26.071 ±15.606) for patients with grade I, (13-43 kPa with mean ±SD of 32.625 ±10.716) for patients with grade II, (32-64 kPa with mean ± SD of 43.188 ± 10.232) for patients with grade III and (22-68KPa with mean ±SD of 51.875 ±17.374) for patients with grade IV esophageal varices respectively (P<0.001). Also there was significant positive correlation between Fibro scan and each of serum ALT, AST, AST/PLT ratio, total bilirubin and INR. Conclusion; Liver stiffness measurement with Transient Elastography is a good alternative for liver biopsy and patients with values >21 kPa have an accuracy of presence of EV.
Keywords: HCV, Liver stiffness, Transient Elastography
Cite this paper: Fatma M. El-Senosy, Walaa F. El-baz, Hatem H. Mohammed, Role of Liver Stiffness Measurement in Prediction of Esophageal Varices in Chronic Hepatitis C Virus Infected Egyptian Patients, Clinical Medicine and Diagnostics, Vol. 8 No. 2, 2018, pp. 33-39. doi: 10.5923/j.cmd.20180802.03.
1. Introduction
- Hepatitis C virus (HCV) infection is a public health problem worldwide. It is estimated more than 185 million people around the world have been infected with it according to the world health organization (WHO) [1]. The highest prevalence is in Egypt and constitute about 10-20% of the general population [2].Cirrhosis is a consequence of almost all progressive chronic liver diseases, approximately 10%-20% of patients with chronic hepatitis C virus infection have cirrhosis at first clinical presentation, and as many as 20%-30% of those who don’t have cirrhosis will eventually develop this condition and its complications within one or more decades [3].Approximately half of patients with cirrhosis have esophageal varices (EV), and one-third of all patients with varices will develop variceal hemorrhage which is a major cause of morbidity and mortality in cirrhotic patients [4].Esophago gastro duodenoscopy (EGD) is the gold standard for EV detection, but a generalized program of periodical EGD in patients with chronic liver disease might result in a heavy economic burden even for developed countries. Furthermore, repeated examinations when not performed under profound sedation are often poorly accepted by patients who may refuse further follow-up [5].Transient Elastography (TE) is a noninvasive, ultrasound technique-based technology that assesses liver stiffness measurement (LSM). Established evidences indicated that TE has good sensitivity and specificity for fibrosis, significant fibrosis, and cirrhosis, and it became popular over the last few years [6]. A good correlation between LSM and the presence of portal hypertension (PHT) and EV has been reported, suggesting that LSM could be an interesting tool for predicting the presence of large EV and selecting patients for endoscopic screening. [7] Aim of the work; the aim of this study was to evaluate the role of fibro scan in prediction of esophageal avarices in chronic HCV infected patients and selection of patients for endoscopic screening.
2. Patients and Methods
- This a cross sectional prospective study was carried out on100 chronic HCV patients presented to the outpatient clinics at the internal medicine department, Al-Zahraa University hospital and Shebien Elkom Teaching Hospital during the period from June 2016 to Febreuary 2017.All patients were diagnosed definitely to have a chronic HCV infection by HCV PCR testing as they were submitted to new antiviral therapy. Our Study included 100 patients (69 males and 31 females). Their age ranged from 18 to 70 years with a mean age of (41.58± 13.330) years.Exclusion criteria:Patients with BMI more than 35 kg/m2, ascites, history of schistoniasis or alcohol intake co infection with HIV or hepatitis B virus (HBV), Patients with history or evidence of any malignancies, autoimmune diseases and Patients suffering from any organ failure, Diabetes mellitus. Haemolytic anaemia, Cytopeni, Age < 18 and >70 years were excluded from the study and History of upper GIT bleeding or hepatocellular carcinoma, and Patients with abdominal collaterals in abdominal ultrasound.Methods:All patients in this study were subjected to the following:1. Full medical history and complete physical examination.2. Measurement of body mass index (BMI): weight divided by the square of the height (Kg/m2)3. Laboratory investigations: Sample collection and storage:Five ml of venous blood were withdrawn under complete aseptic technique from the fasting patients in a sterile vacutainer tube 1ml for complete blood picture were taken on EDTA solution,3ml of the samples were taken in plain tube, left to clot, centrifuged at 2000×g for 10 minutes and sera were separated without delay. Complete blood picture (CBC) were done on sysmex KN21, Fasting and post prandial blood sugar, Liver function tests (Serum albumin, bilirubin, alanine transaminases (ALT) and aspartate transaminase (AST), Kidney function tests including serum urea and creatinine All of them were done on cobas 311 clinical chemistry auto-analyzer from ROCH diagnostic company and Hepatitis markers including (HBsAg), HCV antibody and HCV RNA by real time polymerase chain reaction (PCR) were done.4. Esophago gastro duodenoscopyEGD was done using Pentax EG-2990i Gastroscope (Pentax Medical, HOYA Corporation, Tokyo, Japan) by a single expert endoscopist blinded for the detailed clinical and laboratory data of the patients. EV was classified according to modified Thakeb classification as follow:Grade I: Small straight cords of varices confined to the lower third of esophagus.Grade II: Moderate-sized clubbed varices confined to the lower half of the esophagus, with well-defined areas of normal mucosa in-between.Grade III: Gross varices extending into the upper half of the esophagus, with dilated capillaries in-between and normal mucosa might not be visible unless the esophagus is fully distended with air.Grade IV: Gross varices extending into the upper half of the esophagus with dilated capillaries on top or in-between and encroaching on esophageal lumen [8-9].5. Radiologic investigations:A-Abdominal ultrasonography with special emphasis on: Liver size, echo pattern and presence of focal lesion, splenic size and echo pattern, portal vein diameters, and presence or absence of ascites.B-Fibro scan: Fibro Scan was obtained using fibroscan device (Echosens, Paris, Farance) by an expert fibroscan operator who was not aware by patients’ data, US and EGD results. Liver hardness is evaluated by measuring the velocity of a vibration wave (also called a ‘shear wave’) generated on the skin. Shear wave velocity is determined by measuring the time the vibration wave takes to travel to a particular depth inside the liver [10]. Interpretation of results of Fibroscan:1. Up to ten successful acquisitions were performed on each patient. Success rate was calculated as the ratio of the number of successful acquisitions over the total number of acquisitions.2. The median value of successful measurements was kept as representative of the liver stiffness.3. Only LSM obtained with 10 successful acquisitions and a success rate of at least 60% was considered reliable. The METAVAIR scoring system is an algorithm for grading of activity in chronic hepatitis C;The stage of fibrosis varied from 0 to 4 (F0 = no fibrosis; F1 = portal fibrosis without septa; F2 = portal fibrosis with few septa; F3 = septal fibrosis, without cirrhosis; F4 = cirrhosis [10].In Hepatitis C: 2 to 7 kpa mean f0-f1 stage.8 to 9 kpa mean f2 stage.9 to 14 kpa mean f3 stage.14 or higher kpa means f4 stageStatistical Analysis:Data were collected, revised, coded and entered to the Statistical Package for Social Science (IBM SPSS) version 20. Qualitative data were presented as number and percentages while quantitative data were presented as mean, standard deviations and ranges when parametric. The comparison between two groups with qualitative data were done by using Chi-square test and/or Fisher exact test was used instead of Chi-square test when the expected count in any cell was found less than 5.The comparison between two groups regarding quantitative data with parametric distribution was done by using Independent t-test..Spearman correlation coefficients were used to assess the correlation between two quantitative parameters in the same group. The confidence interval was set to 95% and the margin of error accepted was set to 5%. So, the p-value was considered significant as the following: P > 0.05: Non significant. P < 0.05: Significant. P < 0.01: Highly significant. ROC-curve: Receiver Operating Characteristic curve analysis.Sensitivity: Probability that the test results will be positive when the disease is present (true positive rate, expressed as a percentage). Specificity: Probability that the test results will be negative when the disease is present (true negative rate, expressed as a percentage).PPV: Positive Predictive value (probability that the disease is present when the test is positive). NPV: Negative Predictive value (probability that the disease is present when the test is negative). Accuracy: the ratio of the true positive and true negative on all patients.
3. Results
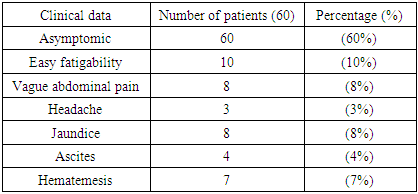
- Demographic data of studied patients showed; This study was conducted on 100 chronic HCV Egyptian patients, 69 (69%) males and 31 (31%) females. Their ages ranged between 18-70 years with a mean ± SD of (41.58± 13.330) years and BMI ranged from (19-25) with mean± SD of (22.89±1.6). Al patients were examined by upper gastrointestinal endoscopy with full special emphasis on presence or absence of esophageal or gastric varices and quantification of liver fibrosis by Fibro scan.The Main clinical presentations of the HCV patients as regard easy fatigability, abdominal pain, headache, jaundice, ascites and Hematemesis are shown in (table 1).
|
|
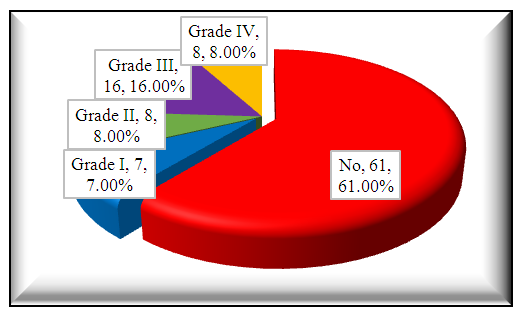 | Figure 1. Endoscopic examination of 100 HCV patients |
|
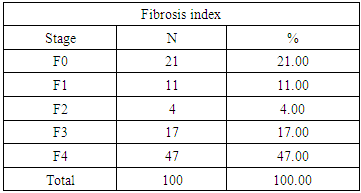
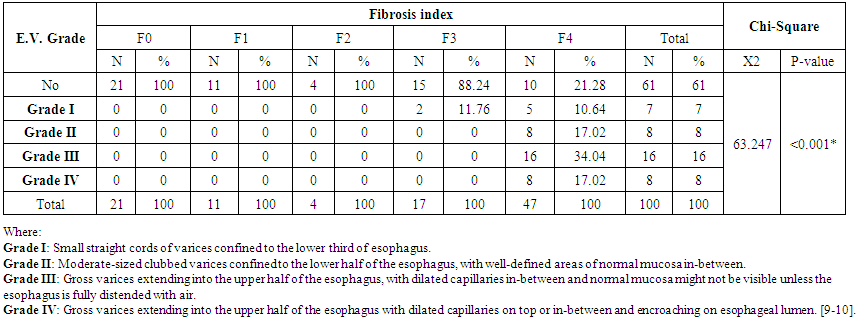 | Table 4. Endoscopic findings of HCV patients with different degree of fibrosis index |
|
|
|
|
4. Discussion
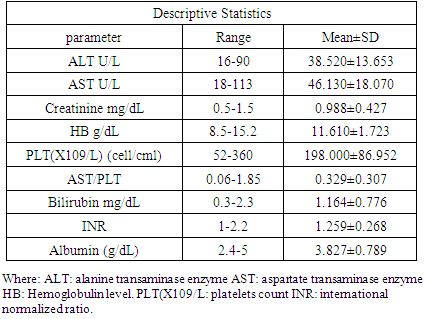
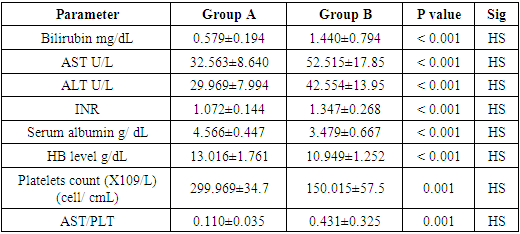
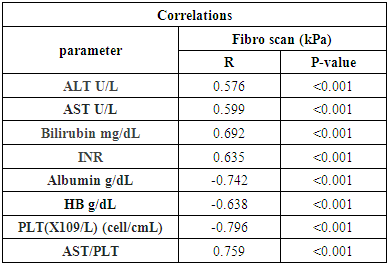
- Portal hypertension is the hemodynamic abnormality associated with the most severe complications of cirrhosis, including ascites, hepatic encephalopathy, and bleeding from gastroesophageal varices [11].Bleeding from esophago-gastric varices is the most important complication of cirrhosis [12]. The first crucial step in prevention is to identify the patients at risk for bleeding by endoscopic screening, in order to select them for prophylactic treatment [13].Several studies in the past have shown independent parameters like splenomegaly or ascites [14].Spider naevi [15], Child's grade [16], prothrombin time/activity or portal vein diameter [17], platelet count/ spleen diameter ratio [18] as significant predictors for the presence of esophageal varices.Liver stiffness (LS) measured by Transient Elastography has been reported to be well correlated with histologically assessed liver fibrosis stage [19].Our study was carried to evaluate the role of fibro scan in prediction of esophageal varices in chronic HCV infected Egyptian patients and selection of patients for endoscopic screening.Our results revealed that patients with values (2-33 kPa with mean ± SD of 8.40 ± 6.82) had no EV and patients with values of (11-68) kPa had EV. And disturbed as the following; (11-54 KPa with mean ± SD of 26.071 ± 15.606) for patients with grade I, (13-43 Kpa with mean ± SD of 32.625 ± 10.716) for patients with grade II, (32-64 Kpa with mean ± SD of 43.188 ± 10.232) for patients with grade III and (22-68KPa with mean ± SD of 51.875 ± 17.374) for patients with grade IV esophageal varices respectively. Thus only patients with 11 kPa or above should be screened for EV. (P<0.001) And patients with values less than 11kPa should be ruled out from endoscopic screening for E.V and a cut –off value of ≥21 KP had 87.1% sensitivity and 95% specificity for presence of esophageal varices.Also our results showed there was significant positive correlation between Fibro scan in kPa and each of ALT, AST, AST/PLT ratio, total bilirubin and INR. However, there were significant negative correlation between Fibro scan in kPa and each of hemoglobin level, platelet count and serum albumin.In agreement with our results A study was done by Beom Kyung Kim, (2017) [20] suggested that TE adequately reflects the findings of hepatic venous pressure gradient (HVPG), indicating that it is a useful modality for evaluating portal hypertension and cirrhotic complications. They found that TE value<13 kPa reliably excludes any increase in HVPG, while values >21 kPa have an accuracy equal to that of HVPG ≥10 mmHg.In previous study was done by Sporea et al., (2011) [21] who studied value of Transient Elastography as a predictor for Variceal bleeding, they established a value of 31 kPa for the presence of EV and 50.7 kPa as a value for bleeding EV.In consistent with our study another previous study done by Sebastian Mueller et al., (2010) [22] suggested that LS highly correlates with portal pressure, and esophageal varices are likely at values >20 kPa.In A study done by Romanas Zykus et al., (2015) [23] both Liver and spleen transient Elastography were used to predicts Portal hypertension. The study suggested that Liver and spleen stiffness correlate with HVPG and could be used to predict clinically significant portal hypertension (CSPH) or severe (SPH). Spleen Elastography was not superior to liver Elastography in predicting portal hypertension.Also Kumar A and his colleagues (2017) [24] studied the diagnostic accuracy of TE for detecting clinically significant portal hypertension (CSPH) in Indian patients with cirrhotic portal hypertension. The study was conducted on 326 patients with liver cirrhosis and reported that TE has a fair positive correlation with HVPG thus; TE can be used as a non-invasive modality to assess the degree of portal hypertension. A cut-off TE value of 21.6 kPa identifies CSPH with a positive predictive value of 93%.Another study was done In South Korean by Hong WK et al., (2013) [25] LS measurement with transient Elastography in 59 cirrhotic patients who underwent hemodynamic heptic venous pressure gradient (HVPG) measurement. Their results suggested that LS measurement exhibited a significant correlation with HVPG in patients with cirrhosis with a cutoff value 24.25 kPa with 82.9% sensitivity and 70.8% specificity. Also in agreement with our results Yasmin et al. (2013), [10] who reported that liver stiffness measurement was significantly higher in patients with esophageal varices and at the best cut off value 29.7 Kpa, LSM sensitivity was 95% and 67% specificity.In a similar Egyptian study was done by Tag-aden et al, (2017) [26] who studied Liver stiffness measurement in 123 egyptian patients with chronic HCV and revealed that LSM cut off ≥ 17 Kpa was a good predictor for the presence of esophageal varices with 93.6% sensitivity and 95% specificity.Moreover, studies carried out by Vizzutti et al., (2007) [27] a cut-off value for prediction of esophageal varices was 17.6 kPa, these cut off values are lower than we obtained this can be explained by the different demographics and patients characteristics as well as the type of fibroscan machines were used . In contrary to our study Castera L et al., (2009) [28] showed that Transient Elastography could be a valuable tool in diagnosis of cirrhosis but cannot replace endoscopy for variceal screening.The main limitation of our study was the inclusion of a small number of patients with the same etiology for liver disease (CHC). Also, despite TE was accurate for detecting clinically significant PHT with a mean area under the receiver-operating curve (AUROC) of 0.93 in a meta-analysis, [29] it has certain limitations in ascetic and obese patients. [30] However, newer methods like point shear-wave elastography, 2-dimensional real-time shearwave elastography, and magnetic resonance elastography show promising results [31-33] and could represent future research.
5. Conclusions
- Liver stiffness measurement with Transient Elastography is a good alternative for liver biopsy and could be used in clinical practice as a non invasive tool for prediction of esophageal varices and patients with values >21 kPa have an accuracy of presence of EV.