-
Paper Information
- Paper Submission
-
Journal Information
- About This Journal
- Editorial Board
- Current Issue
- Archive
- Author Guidelines
- Contact Us
Clinical Medicine and Diagnostics
p-ISSN: 2163-1433 e-ISSN: 2163-1441
2017; 7(5): 113-119
doi:10.5923/j.cmd.20170705.02

Effect of Childhood Obesity on Immune Cell Frequency and Serum Leptin Level
 Abstract
 Reference
 Full-Text PDF
 Full-text HTML
Radwa S. Shahin1, Rasha M. Gouda2
1Clinical Pathology Department, Faculty of Medicine (for girls), Al-Azhar University, Cairo, Egypt
2Pediatric Department, Faculty of Medicine (for girls), Al-Azhar University, Cairo, Egypt
Correspondence to: Radwa S. Shahin, Clinical Pathology Department, Faculty of Medicine (for girls), Al-Azhar University, Cairo, Egypt.
| Email: |  |
Copyright © 2017 Scientific & Academic Publishing. All Rights Reserved.
This work is licensed under the Creative Commons Attribution International License (CC BY).
http://creativecommons.org/licenses/by/4.0/

Background: Childhood obesity is one of the most serious public health challenges of the 21st century. The problem is global and the prevalencehas increased at an alarming rate. Obesity is associated with chronic inflammation and alteration in immune responses. Objective: was to investigate the effect of childhood obesity on immune cell frequency and serum leptin level in relation to insulin resistance. Method: iNKT (CD3&CD56) cells, CD4 T cells and CD56 (NK) cells were detected by flow cytometry, Leptin serum level was measured by enzyme-linked immunosorbent assay (ELISA) in 30 obese and 20 non obese children matching in age and sex. Results: invariant natural killer T cells (CD3&CD56), CD4 T cells and CD56 (NK) cells were significantly decreased in obese children compared to control group (p= 0.000). Leptin level, was significantly higher in obese children compared to control group (p=0.000). There was the significant negative correlation between (CD3&CD56), CD56 and BMI & serum Leptin levels and significant positive correlation between CD4 and BMI & serum Leptin levels. There was the significant positive correlation between serum Leptin level, BMI, LDL and homeostasis model of assessment for insulin resistance (HOMA-IR) Conclusion: childhood obesity was associated with alteration in immune cell frequency and increase serum leptin level, concomitant with increase the insulin resistance. These finding demonstrated that childhood obesitymight lead to future development of type 2 diabetes and premature cardiovascular disease in adulthood.
Keywords: Obesity, iNKT cells, Insulin resistance, Leptin
Cite this paper: Radwa S. Shahin, Rasha M. Gouda, Effect of Childhood Obesity on Immune Cell Frequency and Serum Leptin Level, Clinical Medicine and Diagnostics, Vol. 7 No. 5, 2017, pp. 113-119. doi: 10.5923/j.cmd.20170705.02.
Article Outline
1. Introduction
- Obesity is a state of excess body fat as a result of a disruption of energy balance that leads to weight gain and metabolic disturbances [1]. The problem is global and the prevalence of childhood obesity has increased at the alarming rate. Nowadays, childhood obesity has become an epidemic all over the world, 200 million school-age children are overweight/obese and 40–50 million of them are obese [2].The overweight and obesity causes various abnormal effects on body metabolism which increases the risk of several diseases as., coronary heart disease, ischemic stroke and type 2 diabetes mellitus, breast cancer, colon cancer [3].Insulin resistance plays a major pathophysiological and cluster of metabolic and endothelial dysfunction with elevated markers of inflammation [4].Long stable positive imbalance between energy intake and requirements leads to obesity, and impairment of immune responses mediated by both humoral and cell mediated mechanisms. The epidemiological and clinical data show that the incidence and severity of specific types of infections are higher in obese people as compare to lean individuals. The excessive lipid intake is also linked to impaired immune responses [3].The innate and adaptive immune responses require activation and propagation of immune cells and synthesis of molecules requiring DNA replication, RNA expression, and protein synthesis and secretion, all of which consuming considerable anabolic energy. So, the immune-competence is dependent on nutritional status and can be easily dysregulated in states of imbalanced nutrition such as under nutrition (malnutrition) or over nutrition (obesity) [5].Invariant Natural Killer T cells (CD3&CD56) (iNKT) are a rare subset of innate T cells which bridge innate and adaptive immunity and may act as a link between the immune and metabolic systems. Murine and adult human studies have demonstrated that iNKT cells are highly enriched in adipose tissue but as adipose tissue expands in obesity, iNKT cells become depleted [6].Leptin is a plasma protein involved in the regulation of food intake and is able to exert pro-inflammatory effects on dendritic cells (DCs), NK cells, T cells, B cells, and Tregs (regulatory T) cells [2].Leptin plays important roles in metabolism and immunity. Under healthy conditions, leptin acts as a satiety hormone to reduce energy intake and increase energy expenditure. Leptin deficiency is associated with reduced hematopoiesis, T cell production, and impaired immunity, as leptin plays a regulatory role in bone marrow hematopoiesis, while also exerting T cell generation and development in the thymus and determining T cell subsets in lymph nodes [1].The aim of the study was to investigate the effect of childhood obesity on immune cell frequency, particularly T cells and NK cells and to determine serum leptin levels in obese children and to assess their relationship with insulin resistance.
2. Subjects and Methods
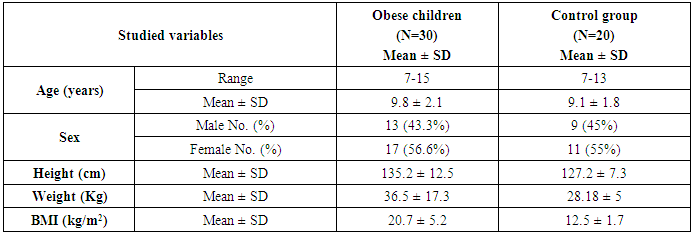
- This study was carried out on thirty obese children selected from Al-Zahraa University Hospital, pediatric outpatients clinic. Their ages ranged from 7 and 13 years old (9.8 ± 2.1), there were 13 males and 17 females. Twenty samples were collected from age and gender matched apparently healthy children, to be used as control, their ages ranged from 7 and 13 years old (9.1 ± 1.8), there were 9 males and 11 females. Subjects were categorized obese and non obese using body mass index B.M.I. (WHO) centile charts for children (5-19 years) for boys and girls. The study was conducted according to the rules of Ethics Committee by the Institutional Review Board (IRB) of Al-Azhar University and a written informed consent was obtained from children's guardians.
2.1. Body Mass Index (BMI)
- Body mass index (BMI) is a simple index of weight for height that is commonly used to classify overweight and obesity. The body mass index (BMI) was calculated by dividing the weight (kg) by the squared value of height in meters (kg/m2), According to the WHO classification, a BMI of <18.5 kg/m2 is under weight, 18.5-24.9 kg/m2 is normal, while 25-29.9 kg/m2 is overweight. A BMI of >30 kg/m2 is classified as obese [3].
2.2. Sample Collection
2.2.1. Serum and Blood Samples Collection
- Venous blood samples were collected aseptically from all patients in two separate test tubesa) One sterile serum separator tube was used for biochemical analysis by putting into plain tube without anticoagulants. After coagulation, sample was centrifuged (for 15 minutes at 1000 ×g) and serum was harvested, divided into aliquots and stored at -20°C until analysis. b) One sterile tube containing EDTA was used for hemoglobin analysis and flow cytometric analysis.
2.2.2. Laboratory Investigations
- I. Complete blood count (CBC) using SYSMEX KX 21-N Cell Counter.II. Biochemical analysis using Cobas c311 (Germany) and Kits of Roche (Germany) for Lipid profile [Cholesterol, triglyceride (TG), High-density lipoprotein (HDL), and low-density lipoprotein (LDL)].III. Serum leptin was detected by ELISA immunoassay Kits from DRG diagnostics, EIA-2395, Germany. The DRG leptin ELISA kit a solid phase Enzyme linked immunosorbent assay based on the sandwich principle. The micro titer wells were coated with a monoclonal Ab directed towards a unique antigenic site on a leptin molecule. An aliquot of patient sample containing endogenous leptin is incubated in the coated wells with a specific biotinylated monoclonal anti leptin Ab. A sandwich complex is formed. After incubation the unbound material is washed off and a steptavidin peroxidase enzyme complex is added for detection of the bound leptin. Substrate solution then added and the intensity of the color developed was proportional to the concentration of leptin in patient sample.IV. Serum Insulin was measured by quantitative ELISA using DRG Kit (kit was supplied by DRG Instrument GmbH, Germany) for measurement of insulin in serum of all patients and controls using ELISA system (Reader Aз 1851 & Washer 909 from das (Italy). The Homeostasis Model Assessment (HOMA-IR) method was used for the calculation of insulin resistance. This method has been validated as a reliable measurement of insulin resistance in vivo in humans [7].
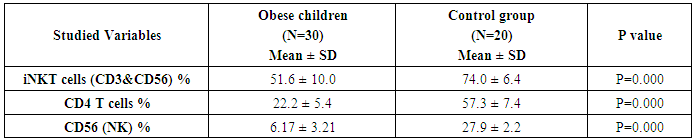
 V. Flow cytometric analysis: The detection of iNKT cells (CD3&CD56), CD4 T cells and CD56 (NK) cells were done by Flow cytometry in Allergy and immunology Center, Al-Azhar University using Becton Dickinson FACS caliber (BD, Biosciences, San jose, USA). Data were analyzed using Cell quest pro software. Briefly, for each patient sample, three tubes (A, B and C) 12×75-mm were labeled with sample identification number and one tube for control. A volume of 50 ul of venous blood was dispensed into each tube; 10 ul of each monoclonal antibody was added, (anti-CD3-FITC), (anti-CD4-PerCP), and (anti-CD56-PE) in tubes A, B and C, respectively. The tubes were vortexed and then incubated for 20-30 min in dark at room temperature. A volume of 1 ml of lysing solution (NH4Cl 1.5 m.mol/1, KHCO3 100 m.mol/1, and tetra sodium EDTA 10 m.mol/1, made up to 11 with distilled water and pH 7.2) diluted to 1 X 10.2 ml of lysing solution was added to each tube and mixed well by vortexing; the tubes were then incubated for 10 min in dark at room temperature. The tubes were centrifugated at 1200 rpm for 5 min, and then the supernatant was discarded. A volume of 2 ml of PBS (NaCl 8.5 m.mol/1, NaHPO4 1.07 m.mol/1, and NaH2PO4 0.39 m.mol/1, made up to 11 with distilled water, and pH 7.4) was added as a wash buffer, to each tube and mixed well. The tubes were centrifuged at 1200 rpm for 5 min, and then the supernatant was discarded. 0.2 ml of cell sheath was added to each tube, put in dark until analysis by flowcytometry [8]. Acquisition and analysis was performed on scatter gating. Scatter gating (gating on forward scatter FSC and side scatter SSC). Results were expressed as percentage (%) and mean florescence intensity (MFI).
2.3. Statistical Analysis
- Data were analyzed using SPSS (Statistical Package For Social Science) version 16.0. Parametric data was expressed as mean± SD and non-parametric data was expressed as number and percentage. Student’s t test was done to compare between two groups. Pearson Correlation Coefficient was done to correlate between different parameters among groups. p value of >0.05 considered non significant, p value of ≤0.05 considered significant, p value of <0.01 was considered highly significant.
3. Results
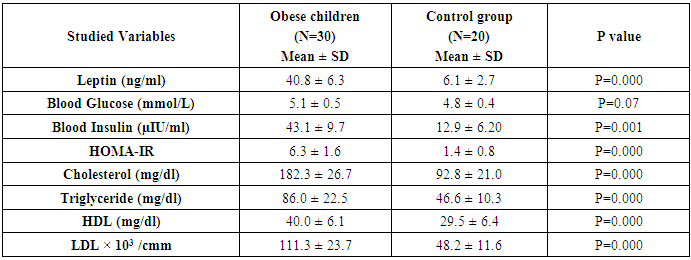
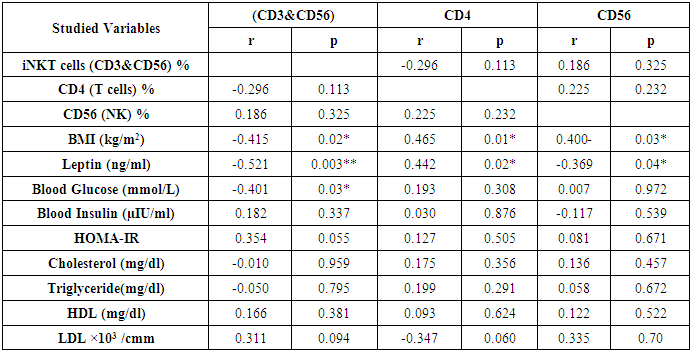
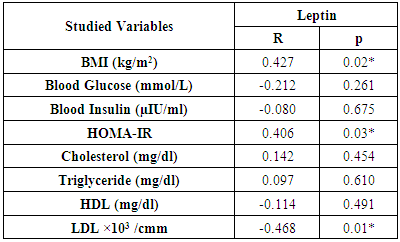
- The study was performed on thirty obese children including 13 males and 17 females with an age range of 7 and 13 years old (9.8 ± 2.1). Twenty age and gender matched apparently healthy children was used as control, BMI and demographic data of studied groups were presented in table (1).iNKT cells (CD3&CD56), CD4 T cells and CD56 (NK) cells were significantly decreased in obese children compared to control group (p= 0.000) (Table 2 & Fig. 2).Laboratory parameters for obese and control group were presented in table (3). As expected, there was highly significant increase in CH, TG, HDL, LDL, insulin and HOMA-IR in obese children compared to control group (p= 0.000). No significant difference was observed between studied groups regarding glucose level.Leptin level was significantly higher in obese children compared to control group (p= 0.000).Correlations between (CD3&CD56), CD4 and CD56 and other lab parameters in obese children are presented in table (4) and Fig. (1). There was significant negative correlation between (CD3&CD56), CD56 cells and BMI & serum Leptin levels and significant positive correlation between CD4 T cells and BMI & serum Leptin levels, while no correlation was encountered between (CD3&CD56), CD4 and CD56 and other parameters.Correlations between serum Leptin level and other lab parameters in obese children are presented in table (5) and Fig. (1). There was significant positive correlation between serum Leptin level BMI, LDL and HOMA-IR while no correlation was found between serum Leptin level and other parameters.
|
|
|
|
|
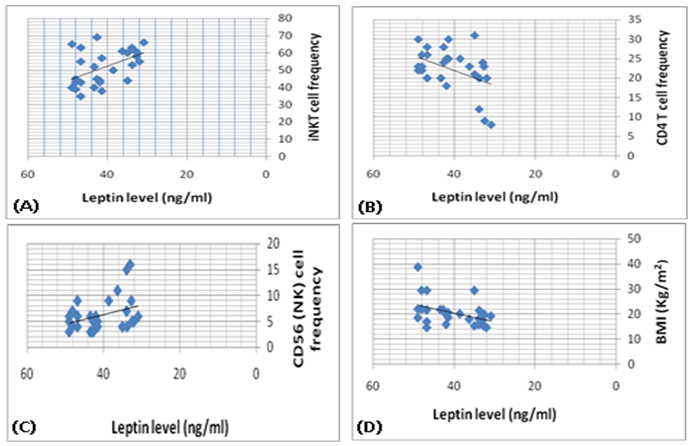 | Figure (1). Scatter plot show correlation between (A) serum leptin level & iNKT cell frequency, (B), serum leptin level & CD4 T cell frequency, (C) serum leptin level & CD56 (NK) cell frequency and (D) serum leptin level & BMI |
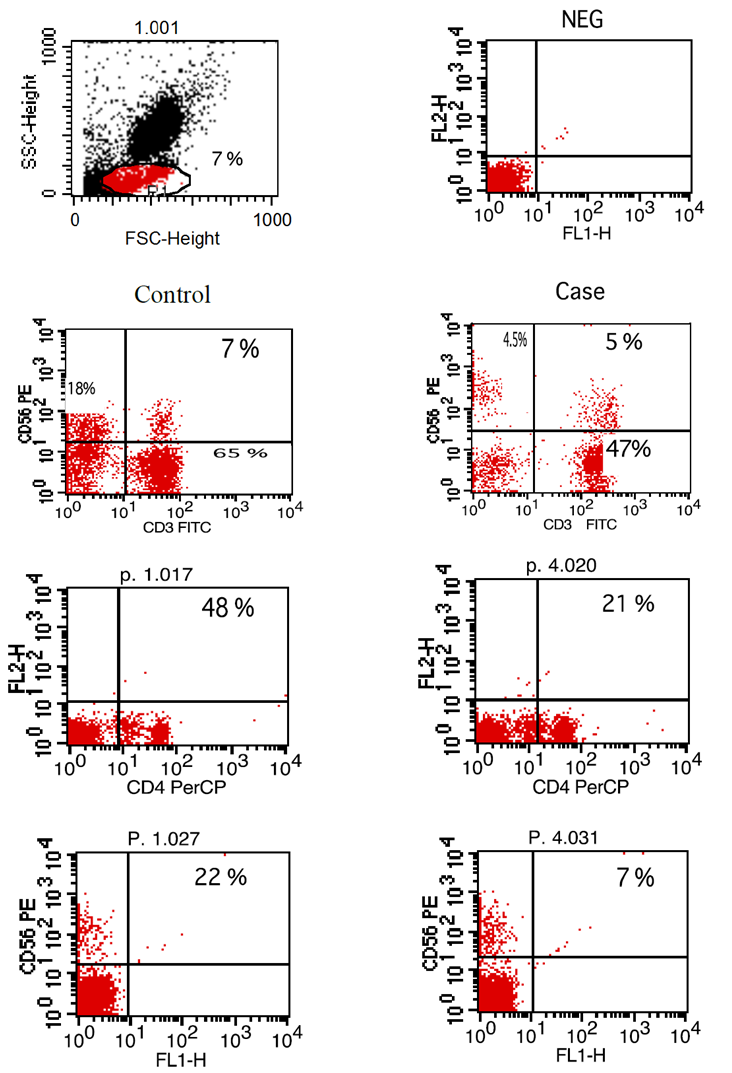 | Figure (2). Flow-cytometry scatter plot showing percentage of iNKT cells (CD3, CD56), T cells (CD4) and NK cells (CD56) in both control and case |
4. Discussion
- Obesity is a significant public health concerns because of its high global prevalence that affect growing children, adolescents and young adults and associated with an increased risk for developing chronic diseases. Besides causing the non-communicable diseases, obesity impairs the immune function also. There is a strong correlation between obesity and immune response and that’s why the obese individuals always get suffered the common viral and bacterial diseases [3].iNKT cells are a highly specialized subset of T cells that can recognize lipids presented by CD1d molecules instead of peptides presented by MHC molecules [9].iNKT cells may bridge the innate and adaptive immune systems. Indeed, iNKT cells can mount specific responses to antigen with cytokine production and cytotoxic activity. They can produce rapidly large amount of cytokines when appropriately stimulated without a clonal expansion, they represent and interesting pharmacological target to modulate the immune response [10].The present study demonstrates reduced number of circulating iNKT cells in obese children as compared to control group (p= 0.000), which in agreement of Carolan et al. [11] study that demonstrated reduced frequency of circulating iNKT cells in obese children.Lynch et al. [6] also reported that iNKT cells were depleted in adipose tissue of obese individuals compared with age-matched lean controls. This results have also been confirmed by other studies, Schipper et al. [12] and Ji et al. [13] suggesting that iNKT cells may play a role in human obesity.Many authors reported dysregulation and alteration in number of immune cells in obese subjects. Obese subjects showed either increased or decreased total lymphocytes in peripheral blood populations and had decreased CD8+T cell population along with increased or decreased CD4+T cells [5, 14].These observations were consistent with current study results as we found significant decreased in CD4 count in obese children compared to control group (p= 0.000).Research work is still trying to determine the exact mechanism by which obesity increases cancer risk. Circulating cells of the innate and adaptive immune system play a critical role in tumor surveillance. Natural Killer (NK) cells are innate effector cells that can induce the death of tumor cells, exercising their potent cytotoxic capacity without previous immunization [15].Present study demonstrated significant decreased CD56 (NK) cells in obese children compared to control group (p= 0.000), which in accordance with O'Shea et al. [16], who reported that both the NK cell number and its cytotoxic activity were diminished in obese individuals, exposing them for increases cancer risk.Our results were supported by previous studies which reported that reduced CD8+ T cells and NK cell populations have been previously described in obesity [14, 17].A prospective study has demonstrated a relationship between the natural cytotoxicity of peripheral blood mononuclear cells and cancer risk showing that those with the lowest cytotoxic activity had the highest cancer risk [18].Also, Renehan et al. [19] demonstrated an association of obesity with 25–40% of certain malignancies in obese individuals. Leptin "the satiety hormone", produced in the adipose tissue where it regulates the energy homeostasis and metabolism. Current study showed that leptin level was significantly higher in obese children compared to control group (p= 0.000). These results were in agreement of Myers et al. [20], who found that obese patients have previously shown resistance to leptin, wherein their adipose tissue shows increased expression of the hormone, but these increased levels don’t reduce body fat.Pan et al. [21] also found that in obesity, a decreased sensitivity to leptin occurs, resulting in an inability to detect satiety despite high energy stores. Present study demonstrated significant negative correlation between (CD3&CD56), CD56 and BMI & serum Leptin levels, and significant positive correlation between CD4 T cells and BMI & serum Leptin levels while no correlation was encountered between (CD3&CD56), CD4, CD56 and other parameters.Regarding to the critical importance of insulin resistance, current study revealed significant positive correlation between serum leptin level and BMI, LDL and HOMA-IR while no correlation was found between serum leptin level and other parameters. In accordance with these findings, many researchers emphasized the presence of insulin resistance (IR) states in their obese subjects [22, 23].
5. Conclusions
- Our findings from current study revealed that childhood obesity was associated with changes in immune cell frequency specially iNKT cells and NK cells and increase serum leptin level, together with increase of the insulin resistance, which may lead to future development of type 2 diabetes and premature cardiovascular disease in adulthood.