-
Paper Information
- Paper Submission
-
Journal Information
- About This Journal
- Editorial Board
- Current Issue
- Archive
- Author Guidelines
- Contact Us
Clinical Medicine and Diagnostics
p-ISSN: 2163-1433 e-ISSN: 2163-1441
2017; 7(4): 91-100
doi:10.5923/j.cmd.20170704.02

Overweight and Obesity in a Market Population in Eastern Nigeria
 Abstract
 Reference
 Full-Text PDF
 Full-text HTML
Ernest Ndukaife Anyabolu 1, 2, Innocent Chukwuemeka Okoye 1
1Department of Medicine, Chukwuemeka Odumegwu Ojukwu University Teaching Hospital, Awka, Nigeria
2Department of Medicine, Imo State University Teaching Hospital, Orlu, Nigeria
Correspondence to: Ernest Ndukaife Anyabolu , Department of Medicine, Chukwuemeka Odumegwu Ojukwu University Teaching Hospital, Awka, Nigeria.
| Email: |  |
Copyright © 2017 Scientific & Academic Publishing. All Rights Reserved.
This work is licensed under the Creative Commons Attribution International License (CC BY).
http://creativecommons.org/licenses/by/4.0/

Background and Objectives: In Sub-Saharan Africa there is increasing incidence of overweight and obesity. Nigerians who are engaged in market activities constitute a very high proportion of the population. The factors which may influence body mass index (BMI) in a populations of market workers in Nigeria have not been completely identified. This study sought to evaluate BMI and the factors which might influence overweight and obesity in market workers in Awka, Eastern Nigeria. Methodology: This was a cross-sectional study carried out in an unstructured market workers’ population. Body mass index and other parameters were determined. The association of variables with BMI and the strength of variables to predict overweight and obesity were determined. Results: For all the subjects, the mean BMI was 28.1 ± 6.0kg/m2. Underweight was prevalent in 2.0% (Males>females), overweight in 35.4% (females>males), normal weight in 29.3% and obesity in 33.3% (females>males) of the subjects. There was significant association between BMI and gender, diastolic blood pressure (DBP), non-smoking, tobacco snuff use, thickened arterial wall, marital status, diabetes mellitus (DM) status, number of children/dependants, nighttime sleep duration, social activity, siesta, as well as age. There was significant correlation between BMI and nighttime sleep duration (p=0.004), meat consumption (p=0.043) as well as eating at home (p=0.022). Only nighttime sleep duration predicted BMI, p=0.005, and obesity, p<0.001. Conclusion: The prevalence of overweight and obesity were high in the study. Cardiovascular risks, having few children/dependants, lengthy nighttime sleep duration, high meat consumption, marriage, siesta, diabetes mellitus and habit of eating at home were common among market workers who were overweight and obese.
Keywords: BMI, Overweight and obesity, Diastolic hypertension, Tobacco snuff, Diabetes mellitus, Siesta, Thickened arterial wall, Nighttime sleep duration, Eating habit, Nigeria
Cite this paper: Ernest Ndukaife Anyabolu , Innocent Chukwuemeka Okoye , Overweight and Obesity in a Market Population in Eastern Nigeria, Clinical Medicine and Diagnostics, Vol. 7 No. 4, 2017, pp. 91-100. doi: 10.5923/j.cmd.20170704.02.
1. Introduction
- Obesity is a devastating healthcare problem around the world. [1, 2] Recently, obesity has been recognized as a seeming peculiar problem of developed economies, directly associated with high socioeconomic status, hypertension and diabetes mellitus, whereas, consigned to developing nations has been underweight with its paraphernalia of infections and under-nutrition. [3-6] The trending epidemiology of obesity, according to studies, has revealed that in the developed nations the incidence of obesity is high among the low and middle income groups, whereas in the developing nations it is observed to be rising among individuals of high socioeconomic status, principally in urban dwellers, but also in rural dwellers, in whom the burden of under-nutrition is seemingly high. [7-11]The World Health Organization (WHO) has put the prevalence of overweight at 62% and obesity at 26% for both genders in the region of Americas, which were high when compared to overweight of 14% and obesity 3% in South East Asia. [12] The range of values for the prevalence of overweight was 20.3% - 35.1% and obesity 8.1% - 22.3% in adults in Nigeria. [7, 13-16] In contrast, the prevalence of underweight of 2.5% and 5.0% were documented in two studies in Nigeria. [14, 17]Studies have shown some factors which are associated with obesity. They include physical exercise, educational level, gender, leisure-time, low physical activity, no livestock, high wealth index, low animal fat consumption, high n-6 polyunsaturated fat consumption, time spent watching television, low rurality index, older age, high caste, rural living, current smoking, lower SBP, urbanization, higher SBP and diabetes mellitus. [7, 11, 14, 18, 19] At the other end, the associated factors of underweight, according to some studies, include low wealth index, low intake of n-6 PUFAs, high rurality index and less urbanization. [11, 19]In Nigeria, there is dearth of studies on the prevalence and factors of overweight and obesity in market workers population. As a result, this study was embarked upon to evaluate BMI and to determine the factors which might influence overweight and obesity in this group of persons with a view to creating awareness for abnormal weight, and identifying those with, overweight and obesity, and putting in place early interventions that would reduce adverse outcomes.
2. Materials and Methods
- This was an unstructured, cross-sectional study consisting of 294 subjects recruited from Eke Awka Main Market, in Awka, Eastern Nigeria. The population was heterogeneous, comprising of artisans, hawkers, clerical staff, and traders, among others. The study was approved by the management of the market. With the assistance of the leadership of the market, the subjects were informed of the study through a gong crier. Every subject that took part in the study gave informed consent, and the purpose of the study was communicated to them. With the aid of a questionnaire, which was pretested on those with different levels of BMI, data were obtained. The factors which were addressed in the questionnaire were biodata, diabetes mellitus status, cigarette smoking, tobacco snuff use, educational status, alcohol use, marital status, eating at home, meat consumption, night-time sleep duration, economic status, annual leave duration, number of persons living in same apartment, number of dependants, social activities, siesta, complexion, length of time spent at work daily. Demographic and anthropometric data were collected. Weight (kg) and height (m) were taken and BMI was determined as weight/height2 (kg/m2). Radial and brachial arteries were examined for thickening, and pulse rate was obtained. Blood pressure (mmHg) was recorded from the non-dominant hand in sitting position, after the subjects had rested for 10 minutes, using appropriate cuff size to cover about 80% of the arm, using Accoson mercury sphygmomanometer. Three blood pressure readings were taken 5 minutes apart, and the average obtained. [20, 21] The variables were graded into groups as follows:Smoking: 1) those who were smokers and 2) those who were non-smokersTobacco snuff use: 1) those who used tobacco snuff and 2) those who did notAlcohol: 1) those who have positive alcohol history and 2) those who have notEducational status: 1) no formal education, 2) primary, 3) secondary, 4) tertiaryArterial wall: 1) those who have thickened arterial wall and 2) those with normal arterial wallMarital status: 1) single, 2) married, 3) divorced, 4) widowedEating at home: 1) those eating at home and 2) those eating outside the homeMeat consumption: 1) those who consumed a lot of meat and 2) those who did notNight-time sleep duration: A) >6 hours, B) 4 – 6 hours, C) <4 hoursDiabetes mellitus: 1) those known to be diabetic prior to the screening and 2) those whose diabetic status was not known prior to the study.Economic status: 1) Artisan, 2) minor retailer, 3) major retailer/importer, 4) hawkers, 5) clerical staff, 6) banker, 7) government worker, 8) transport worker, 9) collectors, 10) othersWeek days spent in business: A) 1 – 3 days, B) 4 – 5 days, C) 6 days, D) 7 daysAnnual leave duration: A) >4 weeks, B) 2 – 4 weeks, C) <2 weeks, D) noneNumber of persons living in same apartment with subjects: A) <5, B) 5 – 8, C) >8Number of children/dependants: A) <5, B) 5 – 9, C) >9Engaged in Social activity: 1) yes and 2) noneSiesta: 1) some siesta and 2) noneComplexion: 1) fair and 2) blackTime spent at work daily: A <8 hours, B 8 – 10 hours, C >10 hoursThe influence of the variables on BMI were compared between the groups for each variable. The potential predictors of BMI, overweight and obesity evaluated were diabetes mellitus, cigarette smoking, tobacco snuff use, educational status, alcohol use, marital status, eating at home, meat consumption, night-time sleep duration, economic status, days spent on business in a week, annual leave duration, number of persons living in same apartment, number of dependents, social activities, siesta, using Akanwu, complexion, length of time spent at work daily, thickened arterial wall. [21]Data AnalysesThe data were analyzed using the Statistical Package for Social Sciences (SSPS Inc, Chicago, IL) version 17.0 statistical software. For continuous variables, mean values and standard deviations were calculated and the means compared using ANOVA or two sample t-test. Categorical variables were compared using the nonparametric tests Chi-square. The distribution and characterization of variables with BMI were analyzed using cross tabulation. Correlation statistics were used to determine the association between BMI and variables, while multivariate linear regression was used to determine the strength of the variables to predict BMI, underweight and obesity. All tests were two-tailed with P < .05 taken as statistically significant. [21]Definition of terms:Hypertension: SBP ≥140mmHg and or DBP ≥90mmHg [22]Mild hypertension: SBP 140–159 mmHg and/or DBP 90–99 mmHgModerate hypertension: SBP 160–179 mmHg and/or DBP 100–109 mmHg;Severe hypertension: SBP ≥ 180 mmHg and/or DBP ≥ 110 mmHg.Body mass index: [21, 23]Underweight: BMI <18,5kg/m2Normal body weight: BMI 18.5 – 24.9kg/m2Overweight: BMI 25.0 – 29.9kg/m2Mild obesity: BMI 30.0 – 34.9kg/m2Moderate obesity: BMI 35.0 – 39.0kg/m2Severe obesity: BMI ≥40.0kg/m2Obesity: BMI ≥30.0kg/m2. In this study Obesity was defined as BMI ≥30.0kg/m2Counselling was given to those subjects who were found to have underweight, obesity and hypertension. They were advised to see clinicians in the hospitals.
3. Results
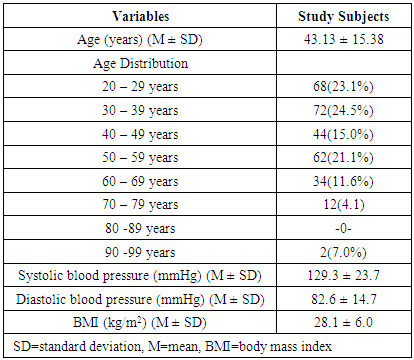
- A total of 294 subjects (males 27.9% and females 72.1%) were studied. Majority (98.6%) of the subjects were Igbos. The mean age of the study subjects was 43 ± 15 years, and mean BMI 28.1 ± 6.0. The mean values of other variables and the age distribution are shown in Table 1. The subjects who have BMI <18.5kg/m2 were 6(2.0%), BMI 18.5 – 24.9kg/m2 were 86(29.3%), BMI 25.0 – 29.9kg/m2 were 104(35.4%), whereas those with BMI ≥30kg/m2 were 98(33.3%).
|
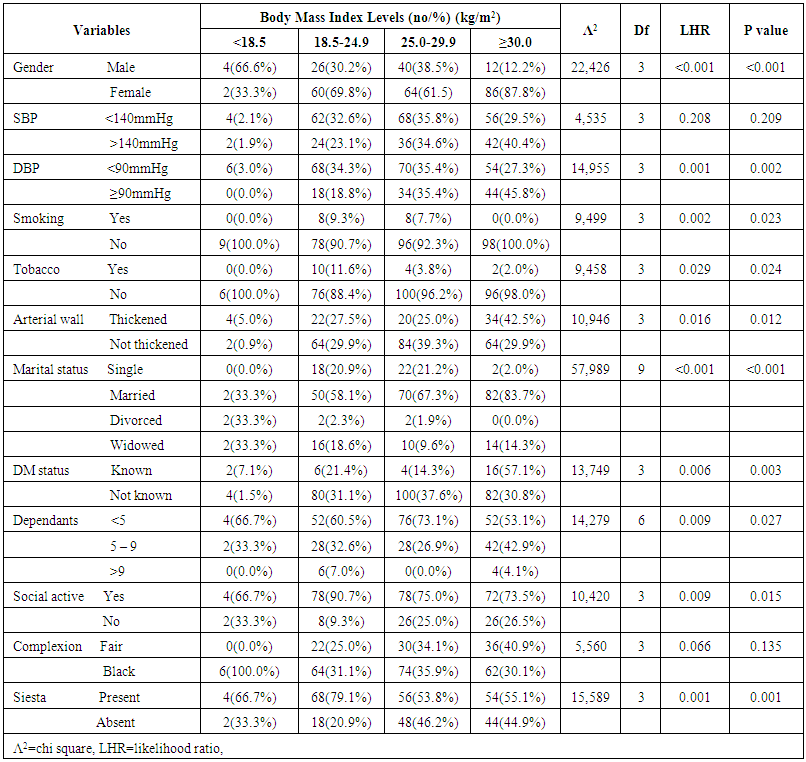 | Table 2. Distribution and characterization of potential risk factors of BMI in study subjects (n=294) |
|
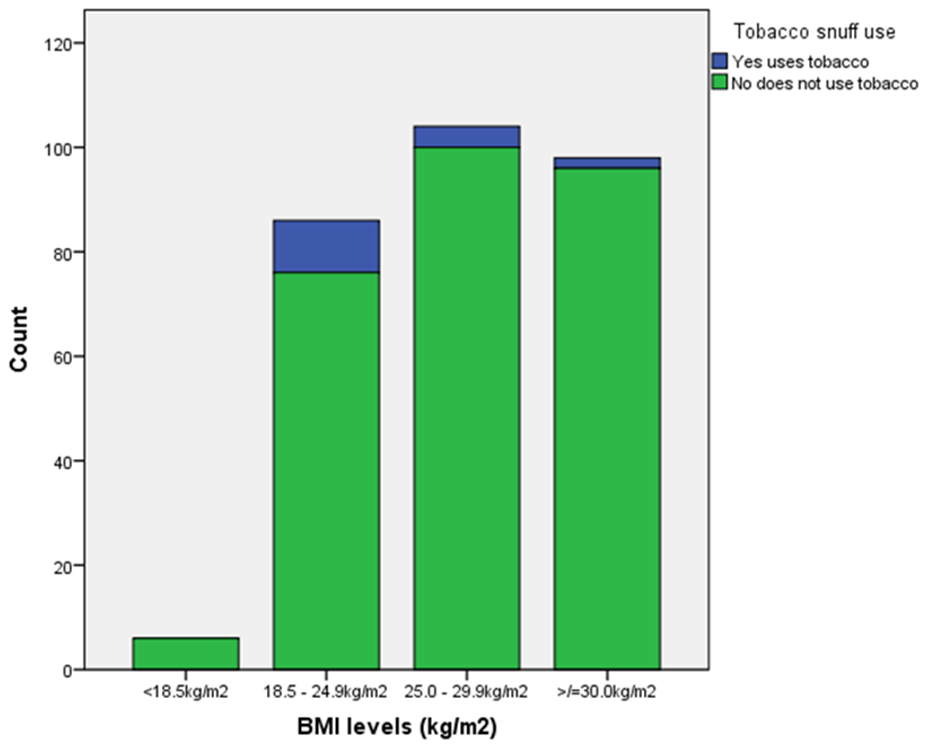 | Figure 1. Association between BMI and tobacco snuff use in market workers |
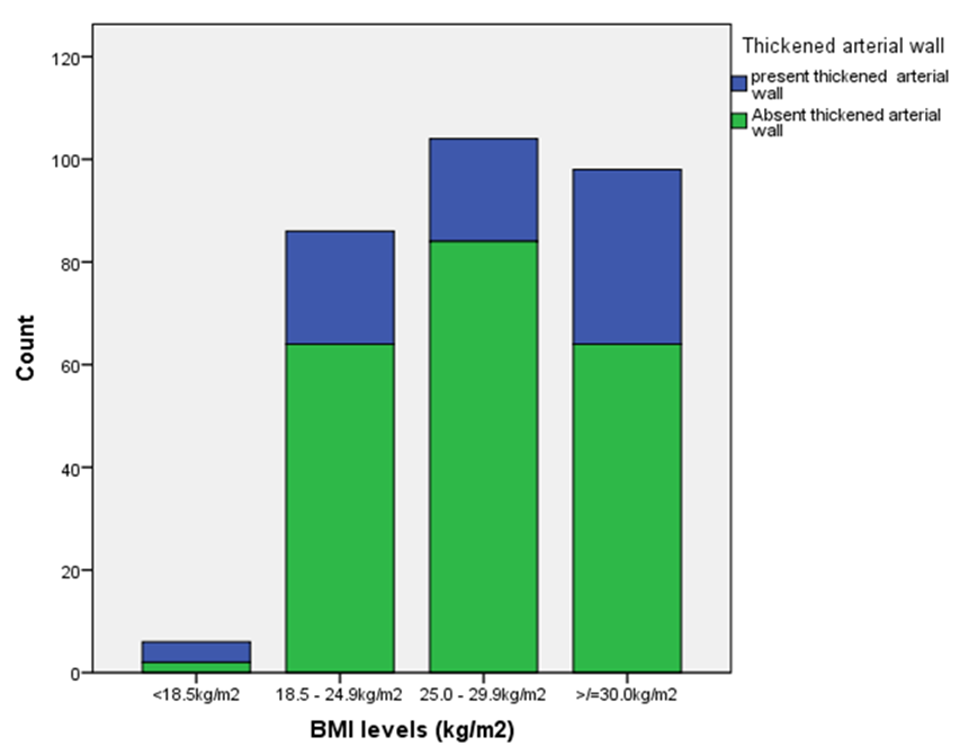 | Figure 2. Association between BMI and thickened arterial wall in market workers |
|
|
|
|
4. Discussion
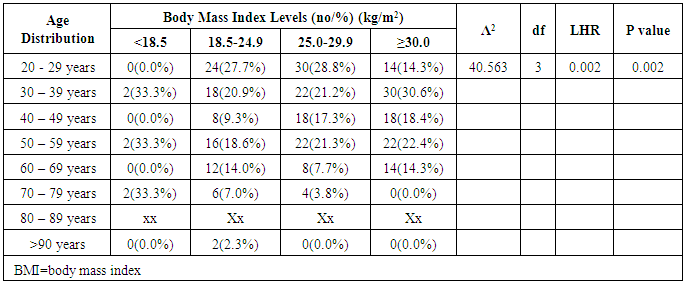
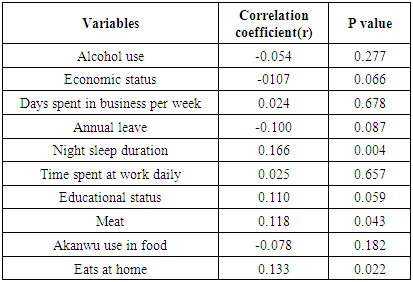
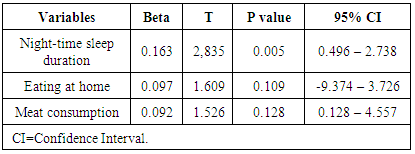
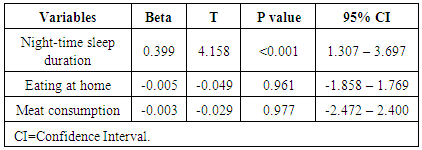
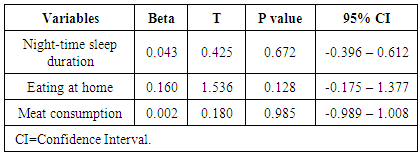
- The prevalence of underweight 2.0% observed in the market workers population in this study is similar to 2.5% reported by Chukwuonye et al [17] in Abia State Nigeria. This similarity still holds despite the difference in the study designs. Our study comprised of market workers whereas theirs was community-based, comprising of both urban and rural dwellers. Nevertheless, as both studies were conducted in the same geopolitical zone of Nigeria, they probably might reflect related features of the population. In contrast, the prevalence of underweight obtained in our study is slightly lower than 6.1% documented by Anyabolu EN [24] in the same geopolitical domain in Nigeria, despite the difference in the HIV status of the subjects, This observed difference could be explained by the fact that his study subjects were HIV-seropositive, whereas ours were not evaluated for HIV status. However, this seems to suggest that our study subjects might not be dominantly HIV-seropositive as underweight has been shown to be associated with infections and malnutrition in HIV population. [25, 26] A polar study in India reported an astoundingly higher underweight prevalence of 22.7% in rural dwellers among a low-resource population. [11] This study observed an overweight prevalence of 35.4% which is in agreement with the prevalence values of 28.2% and 38.4% reported in two studies in Nigeria. [17, 24] despite the differences in the study populations; ours was market-based, the first community-based whereas the second was HIV clinic-based. One study, on the contrary, noted a lower overweight prevalence in a multi-center study that evaluated urban dwellers in Nigeria. [10] In our study, it was observed that the prevalence of obesity of 33.3% was similar to that documented in another study by Anyabolu EN, conducted in a general clinic population. [7] However, a study in Enugu, Nigeria, reported a lower obesity prevalence of 22.6%.in a market workers population, a design that was similar to ours. [20] Perhaps, their study subjects might be more affluent than ours, a variable that could not be ascertained. Affluence in the developing world is associated with obesity. [10] In contrast, obesity prevalence of 33.3% in our study was higher than those observed in some studies in India and Nigeria. [10, 11, 17] These studies were community-based and assessed larger populations than ours.In this study it was observed that the prevalence of both overweight (61.5%) and obesity (87.8%) were higher in females than in males (38.5% and 12.2% respectively). This agrees with the observation made in another study. [10] This observation was not influenced by differences in locality, or rurality, reflecting global trend. [10] Our study, however, noted that the prevalence of underweight was significantly higher in males (66.7%) than in females 33.3%) among market workers. No significant association was observed between BMI and SBP in this study. However, it was found that DBP has a significant association with DBP. This differed from the observation reported in one study which found an association between obesity/overweight and SBP and DBP. Obesity is a risk factor of hypertension. It is also associated with dyslipidemia and atherosclerotic vascular changes that might enhance vascular resistance, reduced vascular compliance and the generation of hypertension. [27] The prevalence of overweight (7.7%) was significantly low in smokers compared to non-smokers (92.3%), in this study. In addition, none of the smokers has obesity. This observation differed from that documented in another study which found that smokers have higher prevalence of overweight and obesity than non-smokers. [28] Cigarette smoking incites the generation of nicotine, a stimulant that may trigger lipolysis, and result in decreasing BMI, as was observed in our study. Tobacco snuff users were observed to have significantly lower prevalence of overweight (3.8%) and obesity (2.0%) than non-users (96.2% and 99.0% respectively) in this study. This disagrees with the observation made in one study. [29] Tobacco snuff powder contains a substantial amount of nicotine and potash which are also lipolytic, [29, 30] and as a result, would cause decreasing BMI as found in our study. It was shown in this study that the prevalence of thickened arterial wall significantly increased as BMI increased - lowest in underweight subjects (5.0%) and highest in obese subjects (42.5%). There was a paucity of studies that evaluated the association between BMI and arterial wall thickening. Obesity is associated with dyslipidemia which leads to atherosclerotic vascular changes that usually result in the thickening and calcification of arterial walls. [27] This tends to, perhaps, suggest that our study subjects who were obese might have some measure of cardiovascular risks. In this study, it was observed that the prevalence of both overweight (67.3%) and obesity (83.0%) were significantly high in those who were married, compared to single subjects, widows and divorced subjects. One study also observed a similar trend. [31] In marriage, especially at onset, there is a tendency for food to be available most of the time. In our setting, couples tend to eat a lot in the guise of family harmony and love. This might explain this high prevalence of both overweight and obesity among married people. Divorced subjects have the lowest prevalence of overweight (1.9%) and obesity (0.0%) The world of divorcees does not, perhaps, create any safe haven for nourishment, at least in our environment. [31] This could, in part, explain these observations in this study. Among those who knew they had diabetes mellitus prior to the screening, the prevalence of obesity (57.1%) observed in this study was significantly high, compared to that of overweight (14.1%) and underweight (7.1%). This finding agrees with the report in one study which also found an association between obesity and diabetes mellitus. [32] Obesity is marked by increasing levels of glycerol, nonesterified fatty acids, hormones, pro-inflammatory markers and cytokines which lead to insulin resistance, reduced peripheral glucose utilization, impaired fasting glucose, pancreatic beta islet cells failure, and subsequently, diabetes mellitus. [33] This, perhaps, could account for the high prevalence of obesity among those subjects whose diabetes mellitus status was known to be positive prior to the screening. It, however, did not exclude the possibility of the presence of diabetes mellitus among those subjects whose status was not known prior to the study. Having a large number of children/dependants could impose a lot of financial strain that may culminate in decreasing availability of food in the family. Added to this night be physical and psychological stress, both of which might be catabolic and expectedly, could result in decreasing BMI. [34] This might explain the significant association observed in this study: significantly high prevalence of both overweight (73.1%) and obesity (53.1%) in those subjects who have <5 children/dependants, compared to those that have higher numbers of children/dependants. There was sparcity of studies that assessed the association between BMI and number of children/dependants. Social activities are a forum that might avail people to being treated to African hospitality, a design which might compel them to eat even when they are not hungry, at times more than the desired number of times in a day. Such an unstructured pattern of eating is very likely to result in excess calories accumulation and subsequently to overweight and obesity. This perhaps, could explain the significantly high prevalence of overweight (75.0%) and obesity (73.5%) observed in those that engaged in social activity, compared to those who did not ((25.0% and 26.5% respectively) in this study.Our study did not find any significant association between BMI and complexion. From literature search, there was a dearth of studies on this association. There has not been any observed differences in genetic or other factors that might proffer a reason for any variation in complexion to account for an observable difference in BMI between skin colors. This study showed that the prevalence of overweight (53.8%) and obesity (55.1%) were significantly high in those who have regular siesta, compared to those who did not (46.2% and 44.9% respectively). Siesta, an activity that provides rest, relaxation and soothing, may enhance life vitality. Admittedly, we did not evaluate the duration of the siesta for each day and so could not assert whether the association of siesta with overweight and obesity was significantly limited to prolonged siesta.This study demonstrated significantly high prevalence of overweight (21.2% each) in those in the age groups 20 – 29 years and 50 – 59 years, compared to other age groups. In addition, the prevalence of obesity (30.6%) in those in the age group 30 – 39 years was high compared to other age groups. This is in sharp contrast to a study that found a comparatively high prevalence of overweight in those in the age group of 40-49 years. [10] However, a study in South Africa observed that varying increases in BMI, with age, were not homogenous. [35] Body mass index increases with age, to peak at variable middle age, but declines thereafter, as was partly shown in our study. Nighttime sleep duration positively correlated with BMI and also predicted the presence of BMI in market workers in our study. This implied that the longer the duration of nighttime sleep the higher the BMI, similar to the observation made in another study. [36] During good night sleep, optimum amounts of growth hormone and insulin-like growth factor (IGF) are produced by the body, which create an anabolic-like effect that promotes weight gain. In addition, stressors are usually in their nadir with adequate night sleep. The absence, or minimal levels, of stressors therefore, would lead to minimal catabolic states that would increase BMI. [34, 36] On the contrary, obesity has been shown to be associated with reduced nighttime sleep duration. [37] Eating at home has positive correlation with BMI, but did not predict it in this study. The habit of eating at home may avail someone to eating much, in a relaxed manner, compared to those with the habit of eating outside the home in places like restaurants and bookers, or not even eating at all. No doubt, with much eating comes increasing BMI.It was observed that meat consumption correlated significantly with BMI but did not predict it in this study. Substantial meat protein consumption may produce excess calories that may be stored in the body, leading to increasing weight, and increasing BMI, as was noted in one study. [38]Alcohol has measurable amounts of calories that can influence positive changes in weight, overweight and obesity, when consumed in high amounts or on a continuous basis. [39] However, our study did not show a significant correlation between alcohol use and BMI.Similarly, the prevalence of overweight and obesity have been shown to increase with rising socioeconomic status. [40] However, this was not observed in this study.The number of days spent in work per week has no significant correlation with BMI in this study. Working every day, all through the week, would probably cause more energy expenditure and so weight loss. This was not observed in our study. Annual leave did not correlate significantly with BMI in this study, in contrast to the assumption that days or weeks of rest in each year might produce some succor that would bolster BMI. No significant correlation was observed between BMI and length of time spent at work per day in our study. On the contrary, spending lengthy time at work might lead to energy utilization and as a result lead to weight loss and a decline in BMI. Perhaps, some of the actual jobs among these market workers might be sedentary, and so might explain the lack of correlation between length of time spent at work and BMI. A similar observation was reported in one US study, which also considered variables such as strenuous and non-strenuous jobs, as well as sedentary and non-sedentary jobs. [41]Akanwu, a substance that contains a substantial amount of potash, is used by our people in facilitating the cooking of stock fish, breadfruit, bitterleaf soup, among others. This study, however, did not find any significant correlation between BMI and Akanwu use.
5. Conclusions
- The prevalence of overweight and obesity were high in the study. Cardiovascular risks, having few children/dependants, lengthy nighttime sleep duration, high meat consumption, diabetes mellitus, marriage, siesta, and habit of eating at home were common among market workers who were overweight and obese. Clinicians should further search for cardiovascular risks in market workers who have overweight and obesity. There is a need for sensitization and awareness creation for market workers to whittle down abnormal weight and their complications.