-
Paper Information
- Paper Submission
-
Journal Information
- About This Journal
- Editorial Board
- Current Issue
- Archive
- Author Guidelines
- Contact Us
Clinical Medicine and Diagnostics
p-ISSN: 2163-1433 e-ISSN: 2163-1441
2017; 7(3): 57-66
doi:10.5923/j.cmd.20170703.01

Field Evaluation of BD FACSPresto™ for Haemoglobin and CD4 Measurement
 Abstract
 Reference
 Full-Text PDF
 Full-text HTML
Leonard Kingwara1, Kipkerich Bera Stephen1, Caleb Ogada1, Linda Chaba2, Henry Muriungi3, Ruth Mumo1, Edward Onkendi1, Geoffrey Kangogo1, David Omondi Okeyo4, Mamo Umuro1, Nancy Bowen1
1National Public Health Laboratories, Nairobi, Kenya
2Strathmore University, Nairobi, Kenya
3Mbagathi County Hospitals Nairobi, Kenya
4Kenya Nutritionists and Dieticians Institute (KNDI), Nairobi, Kenya
Correspondence to: Leonard Kingwara, National Public Health Laboratories, Nairobi, Kenya.
| Email: |  |
Copyright © 2017 Scientific & Academic Publishing. All Rights Reserved.
This work is licensed under the Creative Commons Attribution International License (CC BY).
http://creativecommons.org/licenses/by/4.0/

Background:Measurements of CD4 and haemoglobin are used to determine the immunological state and information about disease progression for HIV-infected patients. Use of BD FACS Presto™ point of care (POC) device for CD4 and haemoglobin (Hb) determination can significantly improve access, uptake and coverage of laboratory services and hence management of HIV-infected patients in resource-limited settings. This study evaluated the relative bias in CD4 and Hb measurements using BD FACSPresto™ system compared to BD FACSCalibur™ CD4 analyser and Mindray BC-5380 haematology analyser respectively based on venous and capillary blood samples in a clinical hospital setting. Methods:Venous and capillary blood samples were used to determine CD4 counts and Hb levels among HIV-1 infected patients. The samples were analysed on the BD FACSPresto™ and results compared against BD FACSCalibur™ and Mindray BC-5380 for CD4 and haematology analyser respectively. Results: Results for absolute CD4 counts in both venous and capillary blood showed a high correlation (R2 = 0.922, P< 0.001) when they were analysed on BD FACSPresto™ and BD FACSCalibur™ machines. Overall, the mean difference in absolute CD4 count was 77.16 cells/mL (95%CI: 49.89, 104.42, p<0.01) when analysed on two platforms. The BD FACSCalibur™ gave a higher mean of absolute CD4 count (834.38 cells/ml) compared to BD FACSPresto™ (757.23 cells/ml) when venous sample type is used. There was a significant mean difference of Hb levels at 0.31 (P <0.001) between the two sample types when analysed on BD FACSPresto™ and Mindray BC-5380 haematology analyser. In addition, there was a high correlation (R2 = 0.920, P< 0.001) of Hb level measurements between the BD FACSPresto™ and Mindray BC-5380 haematology analyser.Conclusion: The BD FACSPresto performed satisfactorily in comparison to the conventional reference standard technologies. Venous and capillary blood sample types showed a high correlation when analysed for absolute CD4 count and Hb using BD FACSPresto™, BD FACSCalibur™ and Mindray BC-5380 haematology analyser. BD FACSPresto capillary platform can be used interchangeably with BD FACSCalibur™ venous platform for CD4 and Mindray BC-5380 for Hb measurement in resource limited settings to increase access and uptake of laboratory services.
Keywords: FACSPresto™, CD4, Immunology, Laboratory services, HIV-1
Cite this paper: Leonard Kingwara, Kipkerich Bera Stephen, Caleb Ogada, Linda Chaba, Henry Muriungi, Ruth Mumo, Edward Onkendi, Geoffrey Kangogo, David Omondi Okeyo, Mamo Umuro, Nancy Bowen, Field Evaluation of BD FACSPresto™ for Haemoglobin and CD4 Measurement, Clinical Medicine and Diagnostics, Vol. 7 No. 3, 2017, pp. 57-66. doi: 10.5923/j.cmd.20170703.01.
Article Outline
1. Introduction
- Infection with HIV is mediated primarily through binding of viral envelope molecule gp120 to the cluster of differentiation (CD) 4 cell surface glycoprotein [1, 2]. A decrease in the number of CD4+ T cells is thus closely related to disease progression and increased risk of contracting opportunistic infections in HIV-infected patients [3]. Reconstitution of the CD4+ T cell population is achieved over time after initiation of antiretroviral treatment [4, 5]. Quantification of CD4+ T lymphocytes in peripheral blood is, therefore, critical for the evaluation and monitoring of patients with HIV. In fact, the WHO recommends CD4 counts be used to enable differentiated care for diagnosis of drug failure where routine viral load is not feasible [6, 7].In Kenya, CD4 measurements are used to support differential care in the national HIV program as stated in the recently launched “Test and Treat” guidelines [7]. The assay is used for determining the immunological stage of HIV infection, to obtain information about disease progression, identification of patients likely to benefit from cotrimoxazole or dapsone prophylaxis, patients most at risk of developing immune reconstitution syndrome, vaccine guidance and ARV regimen selection. In addition, CD4 counts may be used for optimal evaluation of treatment response and early detection of opportunistic co-infections such as Cryptococcus neoformans (CrAg) in patients with <100 CD4 T cells/μl. CD4 measurement tests are thus encouraged by WHO where feasible to improve the quality of HIV prevention, care and treatment programs. The standard method for determination of CD4 percentage and absolute cell counts is flow cytometry.Disease progression in HIV-infected patients also results in haematological abnormalities including anaemia which is caused by various factors including nutritional deficiencies, neoplastic diseases and myelosuppressive medication such as zidovudine (AZT) and dapsone [8]. Low haemoglobin (Hb) levels are associated with increased risk of mortality which is independent of CD4 counts or viral load [9-11]. Anaemia also correlates with low CD4 counts, low body mass indices (BMI) and reduced quality of life [12]. Hb measurements are therefore used in ART regimen selection where AZT is excluded if baseline Hb level is below 9.5g/dL or substituted if subsequent measurements show a decline below baseline levels or less than 8.5g/dL. In addition, where dapsone is used as a substitute for cotrimoxazole for Pneumocystis carinii pneumonia, Hb must be monitored [7]. Thus although the gold standard disease progression markers are viral load and CD4 counts, haemoglobin levels are also used in clinical management of people living with HIV.Unlike haemoglobin level determination, CD4 enumeration remains largely inaccessible in resource-limited settings, including Kenya due to poor health infrastructure and poor laboratory inventory systems resulting in stock-outs of laboratory consumables. Most clinical laboratories in developing countries are often unsuitable for routine determination of CD4. High costs of equipment, reagents and challenges associated with machine maintenance further restrict access [13, 14]. Other limitations include, poor nutritional status of patients making it difficult to obtain adequate venous blood draws for analysis and insufficient numbers of trained staff on venous phlebotomy. Moreover, there is a scarcity of educators and training programs, inadequate logistical support and insufficient monitoring of test quality. To address these shortfalls in resource limited settings, significant investments need to be directed towards improving access to improved laboratory infrastructure. Such measures include developing laboratory capacity and deploying point-of-care technologies (POCTs) such as the BD FACSPresto™ which can measure both haemoglobin levels and CD4+ T cells. These efforts aim to reduce turnaround time for results and present the possibility of CD4 testing as soon as the diagnosis of HIV is confirmed thereby improving patient retention. Introduction of cost effective point-of-care CD4+ cell counters has improved access to quick and reliable CD4+ T-cell counts in HIV-positive patients [15, 16]. In terms of economic evaluation, it’s been indicated using a simulation model of HIV disease, that a POC CD4 strategy of immunological staging results in nearly one full year of additional life expectancy compared to LAB-CD4 and is near the very cost-effective [17-19]. It is, therefore, important to evaluate existing and emerging POC systems for accuracy, reproducibility, sensitivity and specificity in the context in which they are prescribed for use. Most medical laboratory equipment validations in Kenya have mainly been done in an ISO 15189 accredited laboratory without factoring in the actual working dynamics of non-accredited laboratories which comprise of approximately 99% of laboratories in Kenya [20]. In this study, we validated the BD FACSPresto™, point-of-care equipment, in a typical laboratory setting in Kenya (Mbagathi Hospital) against the BD FACSCalibur™ (for CD4) and the Mindray BC-5380 haematology analyser (for Hb) which are standard of care devices. Initial validation in similar settings [20, 21] involved calculation of misclassification around 350 cells/µl as the clinical cut-off as opposed to the normal range of >500 cells/µl as proposed in the new test and treat ART guidelines. This study verified not only the relative bias of BD FACSPresto™ against BD FACSCalibur™ in terms of absolute CD4 and %CD4 but also Hb measurement which was missing in the similar field evaluations [21] using the Mindray BC-5380 haematology analyser as the reference. This verification was done to determine misclassification, sensitivity and specificity of HB and CD4 test around 500 cells/µl; the clinical cut-off recommended for differential care in the new Kenya ART guidelines.
2. Materials and Methods
2.1. Study Design and Population
- This study was conducted at Mbagathi Hospital and was divided into two parts (Equipment validation and sample type validation). The first part involved instrument comparison of the point of care device, BD FACSPresto™, against the gold standard BD FACSCalibur™ and Mindray BC-5380 haematology analyser using venous sample type. The second part was to compare venous against capillary blood sample types using BD FACSPresto™ for CD4 and Hb measurement. Determination of the sample size to use in validation was based on exceeding by 25% the minimum enrolment recommended by the Clinical Laboratory Standards Institute (CLSI) and Good Clinical Laboratory Practice (GCLP) guidelines requirement for laboratory assay method validations.
2.2. Sample Collection and Analysis
- Written consent was obtained from 102 HIV-infected patients attending the Maternal and Child Health (MCH) clinic at the Mbagathi District Hospital for their routine follow-up. Their participation involved volunteering to provide both venous and capillary blood samples. Health care facility staff trained in phlebotomy collected blood specimens as previously described [20]. The samples were collected between 31st October and 23rd November 2015. Capillary specimens were analysed immediately using the BD FACSPresto for research use while EDTA venous blood samples were analysed on the BD FACSCalibur™, BD FACSPresto™ and Mindray BC-5380 haematology analyser. Results obtained from the BD FACSPresto device were intended for research use only and were not used for clinical patient management. All procedures were conducted under Good Clinical Laboratory Practices and Good clinical practice guidelines to ensure quality of laboratory testing, safety and confidentiality of subjects participating in the study and quality of results.
2.3. Statistical Analysis
- The accuracy and precision performance of BD FACSPresto™ system was assessed by comparing its CD4 count results against the FACSCalibur™ results (Gold standard) using venous samples. Further assessment of the new system was done by comparing the performance of the new system using two different sample types; venous blood (Gold) and capillary blood (New) for 102 blood samples. The comparison involved both the CD4 count and percent results. For Hb, we compared results obtained from Mindray BC series hematology analyzer using venous blood samples to those obtained from BD FACSPresto™ system using capillary blood samples.To assess accuracy, correlation and linear regression analyses were reported. Bias was also reported using Bland‐Altman analysis in which the difference between the two methods of measurement was plotted against their mean. The limit of agreement was calculated as the mean ± 1.96 Standard Deviation (SD) of the differences of the results obtained. Misclassification rates around clinical cut-offs were also reported to measure accuracy. The CD4 results were categorized into two categories low CD4 values (<200 and <500 cells/μl) and normal CD4 values (≥500 cells/μl and ≥200 cells/μl) for absolute CD4 count and low CD4% (<25%) and normal CD4 % (≥25%) for CD4 percent [6]. Standard deviation and coefficient of variation (CV) were reported as a measure precision. Paired sample t-test was used to determine if there is a significant difference between the results from the two systems or between the different blood samples on the new system since the sample types are from the same individual. Statistical analysis was done using R program.Stepwise analysis for precision and accuracy measurements were performed as followsa) The first phase was equipment validation at national HIV reference laboratory.Ÿ For precision analysis, we used use venous results from BD FACSCalibur™ to split the sample into low CD4 values (<200 and <500 cells/μl) and samples of normal CD4 values (≥500 cells/μl and ≥200 cells/μl)). Absolute mean of CD4 values, standard deviation and coefficient of variation were then calculated and evaluated for acceptability of the new method (BD FACSPresto™). This was to ascertain the performance of the new equipment. Ÿ For accuracy measurement, we used venous samples to split the sample into low CD4 values (<200 and <500 cells/μl) or percent values < 25% and samples of normal CD4 values (≥500 cells/μl and ≥200 cells/μl) or percent values > 25%). We then compared the data set by graphing; the slope and y-intercept of the best-fit line were then calculated using linear regression. We finally determined the p-value to determine whether there was correlation.b) The second phase was field evaluation which involved deploying the equipment at Mbagathi hospital which is a non ISO accredited laboratory to capture the testing dynamics of using this equipment in a non ISO15189 accredited laboratory and the probable variation that could be observed when capillary sample type was used as opposed to the usual venous blood draw.Ÿ For precision analysis, we used venous samples to split the sample into low CD4 values (<200 and <500 cells/μl) and samples of normal CD4 values (≥500 cells/μl and ≥200 cells/μl). We then determined the absolute mean values for the two sample type, standard deviation and coefficient of variation as a verification process of the suitability of the new sample type. Ÿ For accuracy measurement, we used venous samples to split the sample into low CD4 values (<200 and <500 cells/μl) or percent values < 25% and samples of normal CD4 values (≥500 cells/μl and ≥200 cells/μl) or percent values > 25%). We then compared the data set by graphing. The slope and y-intercept of the best-fit line were then calculated using linear regression. Finally p-value was determined to ascertain whether there was correlation.c) For Hb measurement, we determined the accuracy and precision of the BD FACSPresto™ by comparing its capillary BD FACSPresto™ results to the gold standard venous sample type Mindray BC series hematology analyzer at Mbagathi hospital laboratory.d) Data acceptance criteriaŸ For CD4 and CD8 absolute values, the 95% confidence interval (CI) of the mean difference between the test and the reference systems should be ± 10%.Ÿ For CD4 and CD8 percent values, the 95% CI of the mean difference between test and reference systems should be within an absolute ± 3% or a relative ± 10% of the reference system, whichever is greater.
3. Results
- 102 people were involved each giving both the capillary and venous sample type. All capillary blood specimens had a corresponding venous sample from the same subject. The blood samples were tested on the FACSPresto™ and the FACSCalibur™.a) Comparison between FACSCalibur™ and FACSPresto™ using venous blood sampleTable 1 contains summary statistics for absolute CD4 count analysed on FACSPresto™ and FACSCalibur™. The mean CD4 counts were 757.23 (372.091) and 834.38 (449.561) for FACSPresto™ and FACSCalibur™ respectively. There was a significant difference in the mean of the CD4 count results from the two systems with a mean bias of 77.16 cells/ mL (95%CI (49.89, 104.42), P <0.01). This indicates that the FACSPresto™ generated significantly lower CD4 counts values compared to the FACSCalibur™ especially for the patients with normal CD4 count values. See Table 2 for CD4 count summary statistics at different clinical CD4 count thresholds. Figure 1 shows bias results from the Bland-Altman analysis and correlation and regression results on a scatter plot. The mean bias and limits of agreements were 77.16 cell/μl and -200.47 cell/mL to 354.81 cell/μl respectively. The correlation analysis indicates a strong positive correlation (r=0.96, p < 0.001) between the CD4 values generated by the two technologies. There was 94.11% overall agreement with sensitivity, specificity, PPV and NPV at 94.74%, 92.31%, 97.3% and 85.72% respectively for FACSPresto™ using FACSCalibur™ as the gold standard. Using 200 cells/ μl as a threshold, the overall agreement was 95.1% with sensitivity, specificity, PPV and NPV at 97.8%, 66.67%, 96.8% and 75.00% respectively. These results are shown in Table 3.
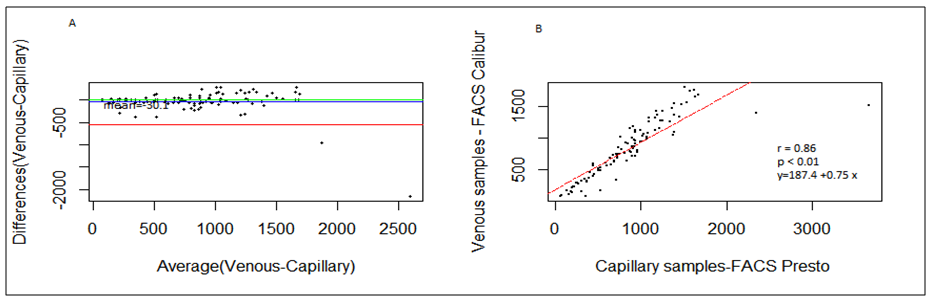
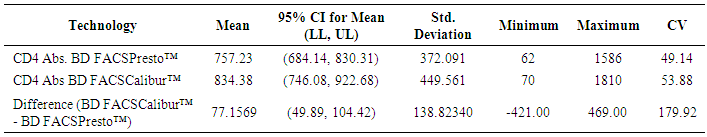 | Table 1. Summary statistics for venous blood results using both BD FACSCalibur™ and BD FACSPresto™ |
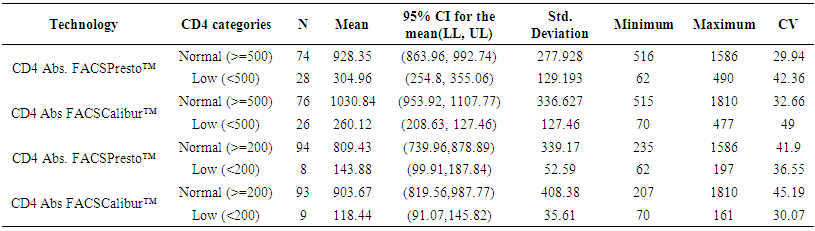 | Table 2. Descriptive venous blood subdivided into various CD4 count ranges using BD FACS Calibur and BD FACSPresto™ |
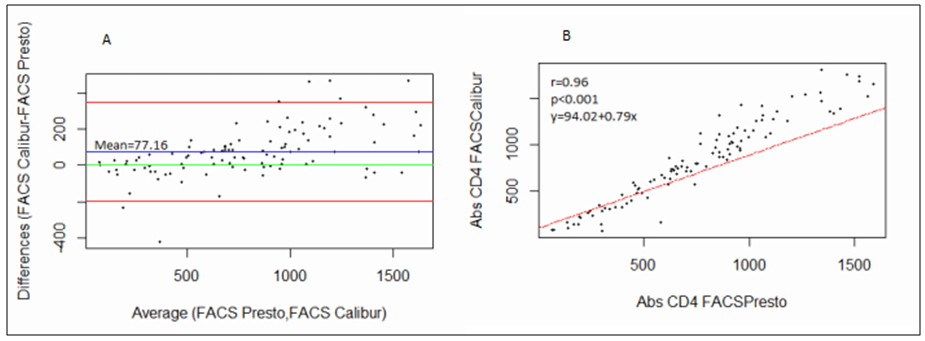 | Figure 1. Comparison between FACSPresto™ and FACSCalibur™. (A) Bland‐Altman indicates mean bias between absolute CD4 counts obtained on FACSPresto™ compared with those obtained on the FACSCalibur™. (B) Regression plot comparison of absolute CD4 count obtained from FACSPresto™ with the FACSCalibur™ as reference standard |
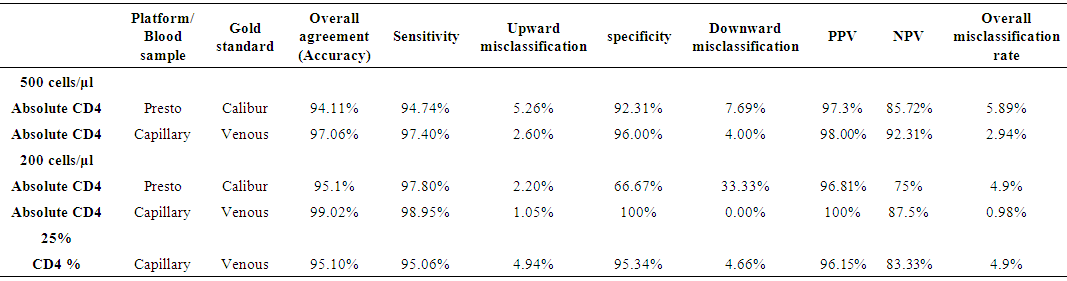 | Table 3. Sensitivity, Specificity, Positive Predictive Value (PPV) and Negative Predictive Values (NPV) and misclassification rates of absolute CD4 count and CD4 % at thresholds of 200 cells/μl, 500 cells/μl and 25% respectively |
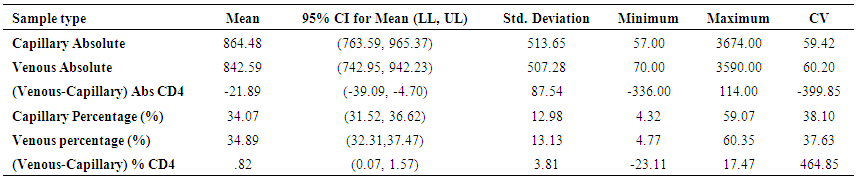 | Table 4. Comparison of results using BD FACSPresto™ on venous and capillary blood for the various CD4 count |
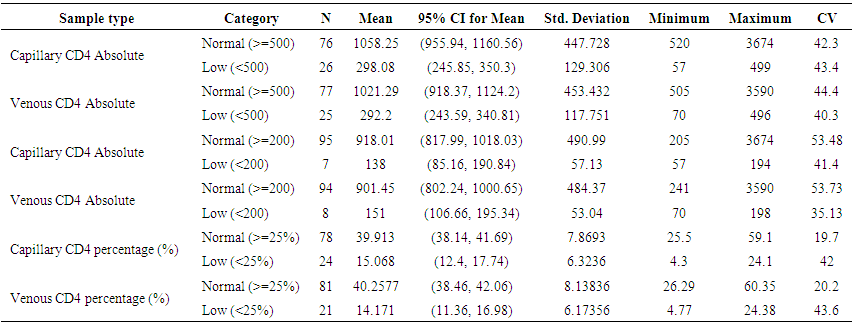 | Table 5. Comparison of results using BD FACSPresto™ on venous and capillary blood for the various CD4 count ranges |
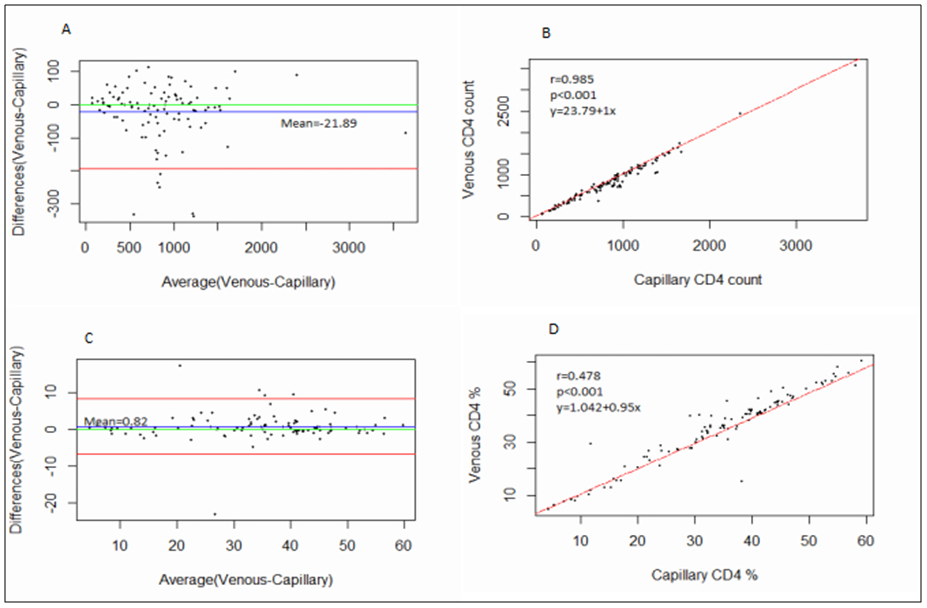 | Figure 2. Comparison between Venous and Capillary samples on FACSPresto™. Bland‐Altman indicates mean bias between absolute CD4 counts (A) and CD4% values (C) obtained on using venous samples compared with those obtained using capillary samples on FACSPresto™. Regression plot comparison of absolute CD4 counts (B) and CD4% values (D) count obtained on using venous samples compared with those obtained using capillary samples on FACSPresto™ |
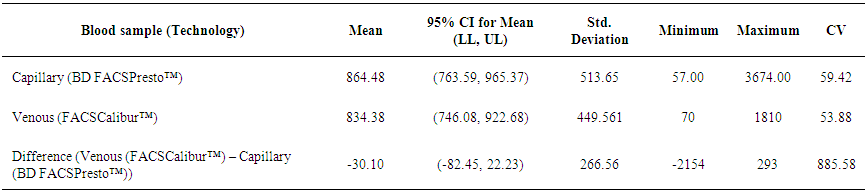 | Table 6. Summarized descriptive statistics for the results from BD FACSCalibur™ on venous blood and BD FACSPresto™ on capillary blood samples |
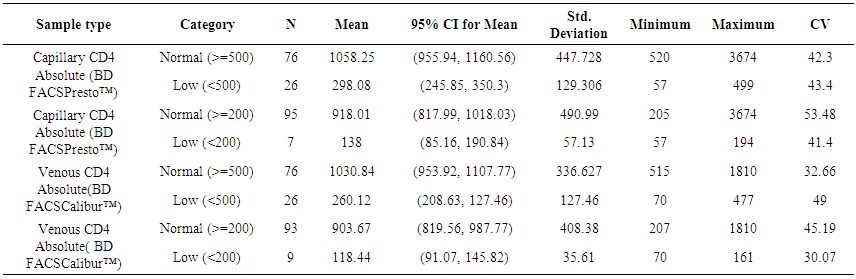 | Table 7. Comparison of results using BD FACSCalibur™ on venous blood and BD FACSPresto™ on capillary blood for the various CD4 count ranges |
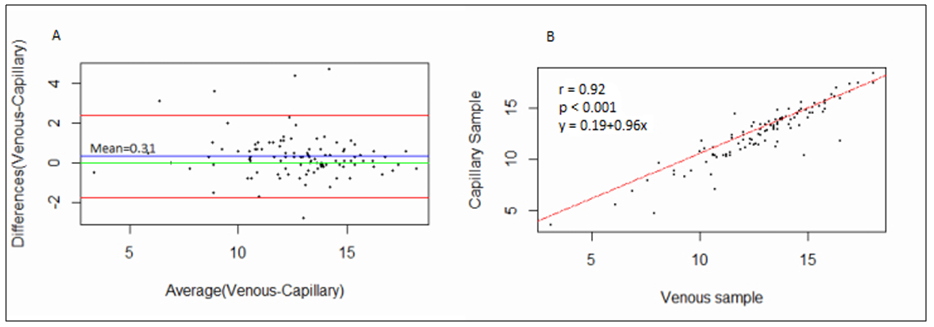
 | Table 8. Sensitivity, Specificity, Positive Predictive Value (PPV) and Negative Predictive Values (NPV) and misclassification rates of absolute CD4 count at thresholds of 200 and 500 cells/μl |
 | Figure 3. Comparison between Venous (FACSCalibur™) and Capillary (FACSPresto™). (A) Bland‐Altman indicates mean bias between absolute CD4 counts using venous samples on FACSCalibur™ compared with those obtained using capillary samples on FACSPresto™. (B) Regression plot comparison of absolute CD4 counts values obtained on venous samples on FACSCalibur™ compared with those obtained using capillary samples on FACSPresto™ |
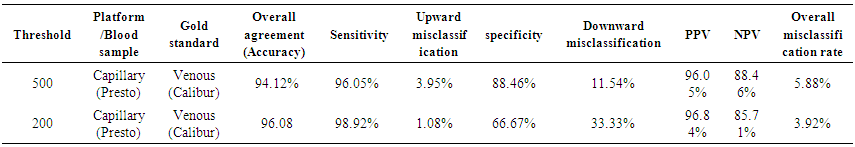
 | Figure 4. Comparison between Mindray BC Venous sample result and FACSPresto™ capillary samples results on (A) Bland‐Altman indicates mean bias between HB concentrate values obtained on using venous samples on Mindray BC to those obtained using capillary samples on FACSPresto™. (B) Regression plot comparison of HB concentrate values count obtained on using venous samples on Mindray BC compared with those obtained using capillary samples on FACSPresto™ |
 | Table 7. Summary statistics of the HB results using BD FACSPresto™ on venous and capillary blood |
4. Discussion
- BD FACSPresto™ is a new point of care testing equipment meant to support CD4 testing program in Kenya. Initially the country had FACSCalibur™. We found that there was a significant difference in mean CD4 absolute values between BD FACSPresto™ and FACSCalibur at p<0.01. In terms of sample type interchangeability within BD FACSPresto™, there was a significant difference between venous and capillary sample type at p<0.013 with capillary giving higher values as compared to venous (-21.89 cells/ μl (95%CI -39.09, -4.70)). For sample type comparison within BD FACSPresto™, we found that sensitivity, specificity, upward misclassification, downward misclassification, PPV and NPV were 94.40%, 96.0%, 2.60%, 4.00%, 98.0% and 92.3% respectively. Additionally when we compared capillary BD FACSPresto™ to venous FACSCalibur™, we found out that there was no significant difference at p=0.257. This indicates that capillary sample type is the ideal sample type for use in BD FACSPresto™. For Hb measurement, there was no significant difference between BD FACSPresto™ and Mindray BC with difference in absolute mean of -0.31 and a p value of P<0.001.This study evaluated the performance characteristics of this analyzer, under ideal laboratory conditions using both venous and capillary blood sampling, as well as its applicability in a typical health care clinic to support both CD4 and Hb testing using FACSCalibur™ and Mindray BC as the gold standard method of testing. Capillary ‘finger stick’ blood is the ideal sample type for BD FACSPresto™ in terms of reliable CD4 and Hb reporting for patients on ART program. Similar studies have reported good correlation ranging from 0.890 to 0.992 under ISO 15189 certified laboratory conditions while varying accuracy and consistency has been reported for capillary sample collection method under field condition [16, 22-26]. This compares with our findings of r being equivalent to 0.985.Venous blood CD4 result comparison of FACSCalibur™ and FACSPresto™ reported here are similar to previous reports where venous sampling was used [22, 27-30]. In these studies, the mean difference in absolute CD4 values ranges from of 62.17 to 116.79 cells/mL. All these studies report a significant difference similar to our study at a p-value of P <0.01. For sensitivity and specificity, the FACSPresto™ results were 94.74% and 92.3%. For program planning this is equivalent to population upward misclassification of 5.26% and 7.69% downward misclassification for absolute CD4 count. Capillary sampling and testing by FACSPresto™ compared well with the venous FACSPresto™ method, with a small overestimation of absolute counts, the difference in mean absolute values was 21.89 cells/mL (95%CI -39.09, -4.70) and a p value of P <0.013. Regression analysis of the absolute values gave an r of, r=0.985 and P< 0.013. For sensitivity and specificity, the FACSPresto™ results were 94.40% and 96.0%. For program planning this is equivalent to population upward misclassification of 2.60% and 4.00% downward misclassification for absolute CD4 count. The result was not different when the clinical cut-off was set at 500 cells/ml or 200 cells/ μl. This underpins the tight difference between the capillary Presto™ and venous Presto™. This was not different from the CD4 % comparison that had a mean difference of 0.82% cells/mL (95%CI 0.07, 1.57) with a p value of P <0.032 and r value of (r=0.958, P< 0.032) indicating good correlation between the two platforms. This was similar to other study findings; despite small mean Bland Altman bias reported giving the impression of minimal difference, wide limits of agreement have been reported in most studies, confirmed in a large recent meta-analysis [4, 5, 12, 30]. Preliminary findings from other cartridge-based systems like Daktari and MBio reveals under-estimation of absolute CD4 counts using venous sampling and relatively poor precision to FACSCalibur™ [28, 29, 31].For Hb measurement, FACSPresto™ capillary blood Hb result compared fairly with venous Mindray BC results as reported by similar studies [32-37]. These other studies had mean absolute values ranging from -0.41 to 0.37 while the correlation ranged from r = 0.876 to r= 0.983 at P< 0.001.
5. Conclusions
- The results obtained from the capillary BD FACSPresto™ were comparable to the standard venous BD FACSCalibur™ and Mindray BC-5380 haematology analyser while venous BD FACSPresto™ underestimates the absolute CD4 count. The capillary BD FACSPresto™ can therefore be utilized to measure CD4 and Haemoglobin in HIV patients especially in resource limited settings. The system can facilitate testing of ~50 samples per day for both CD4 and Hb measurement from a finger prick capillary sample making it an ideal sample type for use in the field or to extend laboratory services where resources are limited or access to laboratories is poor. In comparison on the best POCT to use in the market, we advise various stakeholders to conduct a cost-effective analysis studies of available platform before deciding on the ideal platform for each population.