-
Paper Information
- Paper Submission
-
Journal Information
- About This Journal
- Editorial Board
- Current Issue
- Archive
- Author Guidelines
- Contact Us
Clinical Medicine and Diagnostics
p-ISSN: 2163-1433 e-ISSN: 2163-1441
2017; 7(1): 8-17
doi:10.5923/j.cmd.20170701.02

Low Density Lipoprotein Cholesterol in a General Out-patient Population in a Tertiary Hospital in Southeast Nigeria: Associations and Implications
 Abstract
 Reference
 Full-Text PDF
 Full-text HTML
Ernest Ndukaife Anyabolu1, 2, 3
1Department of Medicine, Chukwuemeka Odumegwu Ojukwu University Teaching Hospital, Awka, Nigeria
2Department of Medicine, Imo State University Teaching Hospital, Orlu, Nigeria
3Department of Medicine, Federal Medical Centre, Owerri, Nigeria
Correspondence to: Ernest Ndukaife Anyabolu, Department of Medicine, Chukwuemeka Odumegwu Ojukwu University Teaching Hospital, Awka, Nigeria.
| Email: |  |
Copyright © 2017 Scientific & Academic Publishing. All Rights Reserved.
This work is licensed under the Creative Commons Attribution International License (CC BY).
http://creativecommons.org/licenses/by/4.0/

Background and Objectives: Elevated serum low density lipoprotein cholesterol (LDL), a component of dyslipidemia, is a cardiovascular risk factor. The factors which influence elevated, or abnormal, serum LDL have not been completely identified. Dyslipidemia is not commonly evaluated in routine clinical practice in the general out-patient clinic. The aim of this study was to determine the prevalence of elevated serum LDL and identify the factors which influence it in adults attending a general out-patient clinic in Nigeria. Methodology: This was a cross-sectional study conducted in subjects attending a general out-patient clinic. Demographic and anthropometric data were collected. Serum LDL and other relevant investigations were performed. The association between different levels of serum LDL and the variables were determined. The strength of these variables to predict elevated serum LDL was also determined. Results: The prevalence of elevated serum LDL was 52.2%, reduced serum high density lipoprotein cholesterol (HDL) 55.1% and elevated serum triglyceride (TG) 7.3%, in the study subjects. Serum LDL has significant association with body mass index (BMI), serum total cholesterol, serum HDL serum triglyceride, hemoglobin and 24-hour urine osmolality (24HUOsm). Serum LDL correlated significantly with spot urine creatinine (SUCr), spot urine osmolality (SUOsm), BMI, serum cholesterol, serum TG, as well as serum HDL. Spot urine creatinine, serum cholesterol, serum TG and serum HDL were predictors of abnormal serum LDL. Conclusion: The prevalence of dyslipidemia was high in this study. Abnormal weight, dilute and concentrated urine, and anemia were common in subjects who have elevated serum LDL. There is a need for clinicians to evaluate serum LDL and further search for anemia, other serum lipid abnormalities and dilute urine in subjects with elevated serum LDL attending the general out-patient clinics, as this will help in addressing cardiovascular risks in these subjects.
Keywords: LDL cholesterol, Body mass index, Serum total cholesterol, Anemia, Urine osmolality, Spot urine creatinine, General out patients, Nigeria
Cite this paper: Ernest Ndukaife Anyabolu, Low Density Lipoprotein Cholesterol in a General Out-patient Population in a Tertiary Hospital in Southeast Nigeria: Associations and Implications, Clinical Medicine and Diagnostics, Vol. 7 No. 1, 2017, pp. 8-17. doi: 10.5923/j.cmd.20170701.02.
Article Outline
1. Introduction
- Worldwide, the enormity of the burden of cardiovascular disease has been overwhelming, contributing to high morbidity and mortality, and eating deep into the fabrics of the budgets of many nation states economies. [1] Many factors contribute to cardiovascular risks; these include arteriosclerosis, atherosclerosis, hypertension, obesity and dyslipidemia. In both the developed and the developing countries, dyslipidemia is a contentious healthcare problem. [2, 3]The global prevalence of dyslipidemia is not completely known but was conservatively put at 39% according to World Health Organization data. [4] In Nigeria the prevalence ranges from 65% to 80% across the different geopolitical regions. [5] Abnormalities of serum lipids constitute dyslipidemia. [5] These abnormalities are defined by elevated serum LDL, elevated serum TG, reduced serum HDL, or a combination of any of these. [6, 7]The presence of dyslipidemia, whether in combination or in isolation, has an ominous contribution to the pathogenesis of atherosclerosis. [8] Atherosclerosis commonly results in abnormal vascular thickening, loss of vascular compliance and stenosis of the affected vessels, which will progressively compromise vascular perfusion to vital organs, leading to ischemia and, subsequently, compromised function of the organ. Isolated elevated serum LDL and a combination of elevated serum LDL and other abnormal serum lipids have been shown to be associated with cardiovascular disease. [8]Studies have identified some factors that were associated with elevated serum LDL. These included diets, gender, age, BMI, diabetes mellitus, hypertension, among others. [9, 10]There is a paucity of studies on serum LDL and its associated factors in the general out-patient clinic population in Nigeria. This has prompted us to embark on this study. It will help in determining the prevalence of dyslipidemia attributable to elevated serum LDL and identifying the factors which may influence it, with a view to instituting early intervention measures to stem down adverse cardiovascular outcomes in subjects attending the general out-patient clinics.
2. Materials and Methods
- This was a cross-sectional study involving 136 subjects consecutively recruited from the general out-patients clinic in Federal Medical Centre (FMC), Owerri, Southeast Nigeria. It was a three-month study conducted in 2011. Those included in the study were between 16-65 years. Those who were pregnant, or have known pituitary, adrenal, renal or terminal illness were excluded from the study. All the subjects that participated in this study gave informed, written consent. The Ethics Research Committee of the hospital approved the study.With the aid of a questionnaire, anthropometric and demographic data were obtained. Our laboratory technicians administered the questionnaire and obtained the relevant data. Because the study was hospital-based, it was not pre-tested, as data collection was not difficult. In both English and our native language, the aim of the study was explained to the subjects. The place of domicile and origin, age and gender of the subjects were obtained. Weight and height were measured and BMI taken as the ratio of weight/height2 (kg/m2). Blood pressure measurements were taken.Clear instructions were given to all the subjects on how to collect 24-hour urine sample. A day-time random spot urine sample and blood samples were collected at the end of the 24-hour urine sample collection. [11, 12]From the random spot urine samples collected, spot urine protein (SUP), spot urine creatinine (SUCr) and spot urine osmolality (SUOsm) were performed. Also from the 24-hour urine samples collected, 24-hour urine protein (24HUP), 24-hour urine creatinine (24HUCr) and 24-hour urine osmolality (24HUOsm) were performed. Hemoglobin (Hb) and serum creatinine were performed on the blood samples collected. Other tests done from the blood samples were HIV screening test, fasting and fasting serum lipid profile (FSLP) [total cholesterol, TG, HDL, LDL]. Osmolality was determined by freezing point depression method using Precision Osmette 5002 osmometer, creatinine by modified Jeff’s method and protein by photometric method. Creatinine clearance (ClCr) was determined. [11, 12]Statistical Analyses: SPSS version 17.0 (SPSS Int. Chicago, II, USA) was used in analyzing the data. The distribution and characterization of the clinical and laboratory features among the subjects with different levels of serum LDL were analyzed using cross-tabulation. For continuous variables, mean values and standard deviations were calculated and the means compared using ANOVA or two sample t-test. Categorical variables were compared using the nonparametric tests-Chi-squares. Multivariate linear regression analyses were used to determine the strength of variables to predict serum LDL, borderline serum LDL and high serum LDL. P≤0.05 was taken as statistically significant. [13]The potential risk factors of serum LDL evaluated were SUCr, SUOsm, BMI, serum cholesterol, serum TG, serum HDL, SCr, SUP, 24HUV, 24HUCr, 24HUOsm, ClCr, and Hb. Definition of terms: WHO classification was used to define BMI levels as follows: [14]Underweight = BMI <18.5kg/m2Normal weight =BMI 18.5-24.9kg/m2Overweight = BMI 25.0-29.9kg/m2Obesity class I = BMI 30.0-34.9kg/m2Obesity class II = BMI 35.0-39.9kg/m2Obesity class III = BMI ≥40.0kg/m2However, in this study, obesity was defined as class I, class II and class III obesity added together.Normal urine osmolality: 24HUOsm 300 - 750mOsm/kgH2O [15, 16]Dilute urine: 24HUOsm <300mOsm/kgH2O.Concentrated urine: 24HUOsm >750mOsm/kgH2O.Anemia was defined according to the WHO criteria: [17]No anemia: Hb >13.0g/dl in males and Hb >12.0g/dl in females.Mild anemia: Hb 11-13g/dl in males and Hb 11-12g/dl in females.Moderate anemia: Hb 8-10.9g/dl in males and Hb 8-10.9g/dl in females.Severe anemia: Hb <8g/dl in males and Hb <8g/dl in females.However, in this study, anemia was defined as Hb <13.0g/dl in males and Hb <12.0g/dl in females.Overall, in this study, anemia was defined as Hb ≤12.0g/dl.Desirable serum LDL: serum LDL <2.6mmol/l.Borderline serum LDL: serum LDL 2.6 – 4.1mmol/l.High serum LDL: serum LDL >4.1mmol/l.Desirable serum cholesterol: serum cholesterol <5.2mmol/l.Borderline serum cholesterol: serum cholesterol 5.2 – 6.2mmol/l.High serum cholesterol: serum cholesterol >6.2mmol/l.Desirable serum triglyceride: serum triglyceride <1.7mmol/l.Borderline serum triglyceride: serum triglyceride 1.7 – 2.2mmol/l.High serum triglyceride: serum triglyceride >2.2mmol/l.Low serum HDL: serum HDL <1.0mmol/l.Desirable serum HDL: serum HDL ≥ 1.0mmol. [18]
3. Results
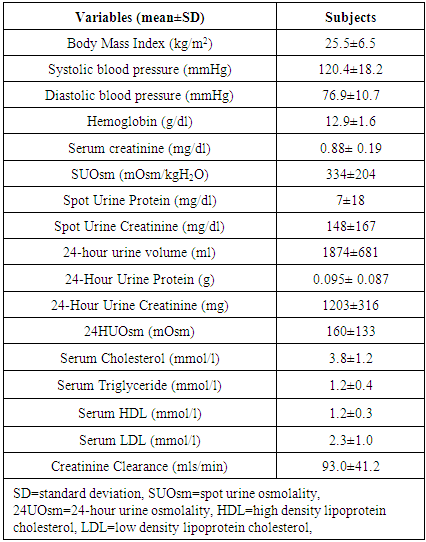
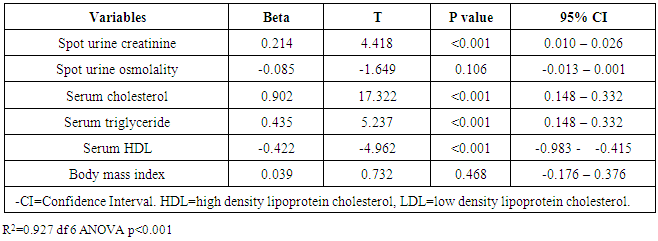
- One hundred and thirty-six subjects were studied. There was no attrition observed. The mean age of the subjects was 39±12 years. Females constituted 72.1% while males made up 27.9% of the study population. The mean value of the serum LDL of the subjects was 2.3±1.0mmol/l. The mean values of other variables in the subjects are shown in Table 1.
|
|
|
|
|
|
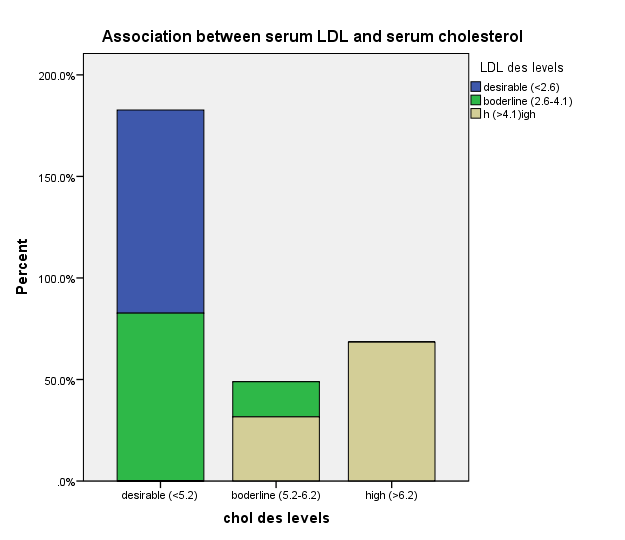 | Figure 1. Association between serum LDL and serum cholesterol |
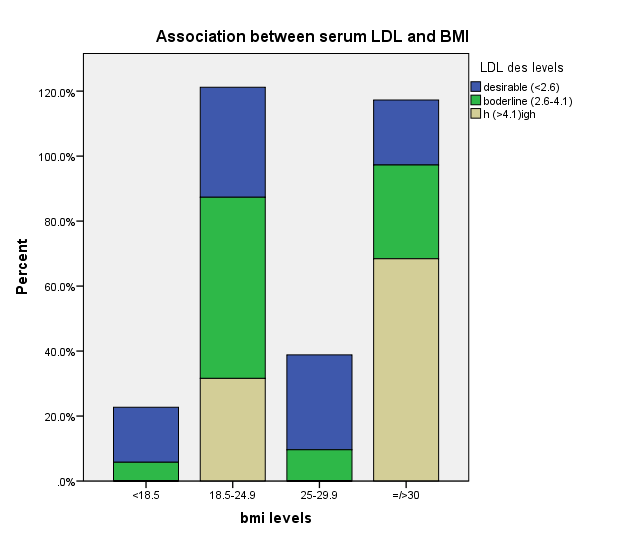 | Figure 2. Association between serum LDL and BMI |
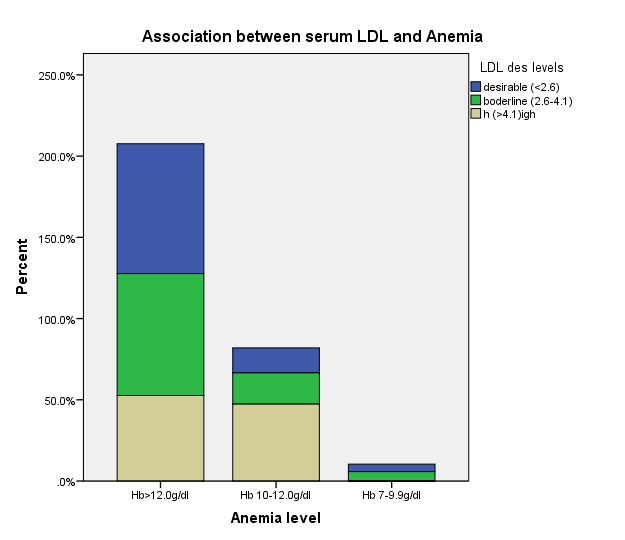 | Figure 3. Association between serum LDL and Anemia |
4. Discussion
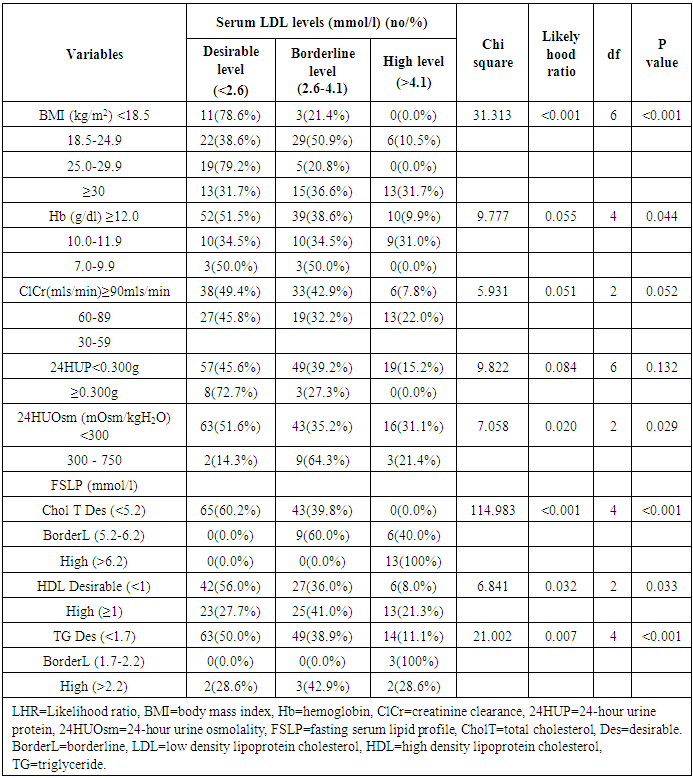
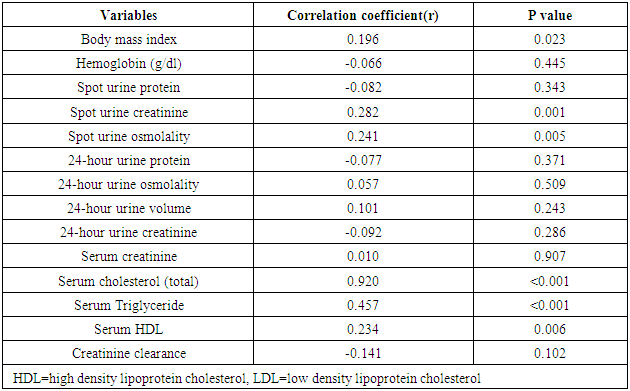
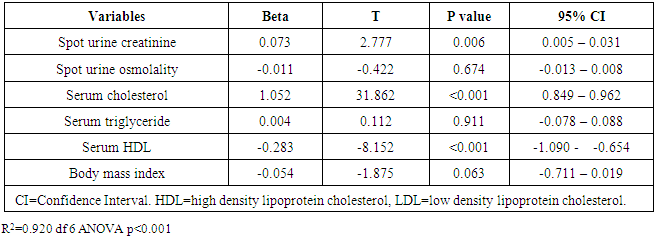
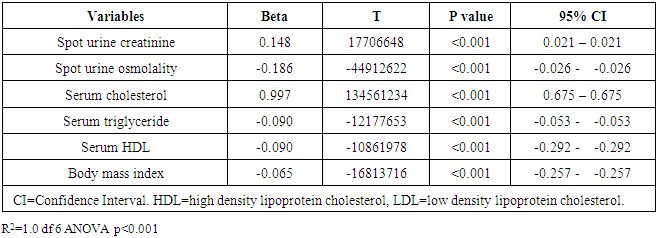
- The prevalence of elevated serum LDL was 52.2%, elevated serum total cholesterol 20.6%, abnormal serum HDL 55.1% and elevated TG 7.3% in the study. Serum LDL has significant association with BMI, serum cholesterol, serum HDL, serum TG, anemia and 24HUOsm. Serum LDL has significant correlation with SUCr, SUOsm, BMI, serum cholesterol, serum triglyceride, and serum HDL. Spot urine creatinine, serum cholesterol, serum TG and serum HDL were predictors of borderline serum LDL.The prevalence of elevated serum LDL of 52.2% observed in this study was similar to 51.0% reported by Odenigbo et al [19] in Asaba, South-south Nigeria, in 2008, despite the difference in the study locations. Our study was conducted in Southeast Nigeria whereas theirs was in South-south Nigeria. However, this prevalence value we obtained was higher than the 31.4% and 25.7% observed in two Nigerian studies, both in 2010. [20, 21] The Osuji et al study population was apparently healthy women attending an “August” meeting whereas ours were subjects attending a general out-patient clinic [20]. Sani et al also studied apparently healthy subjects. [21] Large-population studies, however, showed a much lower prevalence of elevated serum LDL in China and India. [22, 23]In this study, we found that serum LDL was significantly associated with BMI. It further demonstrated that the prevalence of elevated serum LDL increased with obesity but declined with underweight. This is in agreement with observations reported in two studies which also found an association between BMI and serum LDL. [24, 25]Our study demonstrated a significant association between serum LDL and serum total cholesterol. It further showed that the prevalence of elevated serum LDL increased as serum total cholesterol increased. This is in conformity with the finding of an earlier study. [5] It has been shown that serum LDL constitutes about 65% of total serum cholesterol. [26]There was a significant but inverse association between serum LDL and serum HDL, as found in this study. In addition, it showed that serum HDL declined as serum LDL increased. This is similar to an observation documented by another study. [27]Our study showed a significant association between serum LDL and serum TG. It further demonstrated that serum TG declined as serum LDL increased. This does not agree with a study that found a direct linear relationship between serum LDL and serum TG. [28] However, it is similar to another study that found an inverse relationship between them. [29]This study found that there was no significant association between serum LDL and ClCr. From literature search, we could not find any study that evaluated the association between serum LDL and ClCr. However, dyslipidemia has been shown by a study to occur in advanced chronic kidney disease marked by a decline in ClCr. [30] The dissociation between serum LDL and ClCr in this study tends to suggest that our study subjects were not likely to have advanced chronic kidney disease.Similarly, no significant association was observed between serum LDL and 24HUP in this study. There was dearth of studies that assessed the association between serum LDL and daily urine protein excretion. However, proteinuric renal diseases have been reported to be associated with some degree of dyslipidemia, dominantly serum LDL [31] and in some cases serum HDL and serum TG. [31, 32]In this study the association between serum LDL and anemia was significant. It was observed that the prevalence of anemia declined as serum LDL increased. This study was similar to one study that found a correlation between hemoglobin and serum total cholesterol. [33] However, the study differed from ours in that it evaluated the influence of anemia on serum lipids in premenopausal subjects, whereas our study subjects comprised of both sexes, aged between 16 and 65 years. One study noted a contrary observation from ours: that study did not find any significant correlation between serum lipids and anemia. [34] Nonetheless, different levels of iron stores, found in premenopausal women, as well as some causes of dyslipidemia, can alter hemoglobin levels [34]. However, our study did not assess the probable mechanisms, in the setting of anemia, by which serum lipids are influenced. In our study, significant association was observed between serum LDL and 24HUOsm. It was demonstrated that the prevalence of dilute urine declined as serum LDL increased. There was dearth of studies on the association between serum LDL and 24HUOsm. Chronic kidney disease progression has been reported to be associated with abnormalities of urine dilution and concentration as well as serum lipid abnormalities. [30, 35] This might suggest that our study subjects could have some elements of renal damage. Nevertheless, some environmental, physiologic states and disease conditions other than renal, might influence 24HUOsm. [35-38] Our study did not evaluate these factors.Spot urine creatinine was noted to be a predictor of borderline serum LDL in this study. From literature search, it was observed that there was a paucity of studies on the association between serum LDL and SUCr. However, SUCr varies over a wide range of values in normal healthy states, but might decline with increasing renal function impairment. [39] Nonetheless, factors other than serum LDL which might influence SUCr were not assessed in this study. However, low serum HDL and low serum LDL characterize dyslipidemia found in chronic kidney disease. Proteinuria in renal disease induces the lipid synthesis by the liver. These are marked by triglyceride-rich apolipoprotein B (apoB)-containing complex lipoproteins, which have a significant atherogenic potential that may in turn adversely affect the kidney, and influence urine creatinine. [16, 40-42]Our study showed that serum total cholesterol, serum TG and serum HDL were predictors of borderline serum LDL. Expectedly, serum LDL has a direct linear relationship with serum total cholesterol and serum TG, but has an inverse relationship with serum HDL. [28, 29]
5. Conclusions
- The prevalence of dyslipidemia attributable to elevated serum LDL was high in this study. Abnormalities of weight, serum lipids other than serum LDL, anemia and urine osmolality were common in subjects with elevated serum. There is a need for clinicians to evaluate serum LDL and further search for anemia, other serum lipid abnormalities and abnormally dilute urine in subjects with elevated LDL attending the general out-patient clinics, as this will help in addressing cardiovascular risks in these subjects.
Limitations
- A much larger study sample size would have been better as it would have averted the skewed colinearity variance that voided the regression analysis of high serum LDL with its potential risk factors.