-
Paper Information
- Paper Submission
-
Journal Information
- About This Journal
- Editorial Board
- Current Issue
- Archive
- Author Guidelines
- Contact Us
Clinical Medicine and Diagnostics
p-ISSN: 2163-1433 e-ISSN: 2163-1441
2016; 6(3): 77-83
doi:10.5923/j.cmd.20160603.06

Ghrelin and Leptin in Obese Postmenopausal Patients
 Abstract
 Reference
 Full-Text PDF
 Full-text HTML
Rehab M. Elsaid Tash1, Omnia A. El-Dydamoni2, Amgad A. Ezzat3, 4, Bahaa Mohamed Ahmed Badr3, Emad E. Radwan5, Mohamed I. Ahmed6
1Department of Microbiology & Immunology, Zagazig Faculty of Medicine, Zagazig, Egypt
2Department of Microbiology & Immunology, Faculty of Medicine (for girls), Al-Azhar University, Cairo, Egypt
3Department of Microbiology & Immunology, Faculty of Medicine, Al-Azhar University, Assuit, Egypt
4Department of Microbiology & Immunology, Faculty of Medicine, Tabuk University, KSA
5Department of Obstetrics and Gynecology, Suez Canal University Hospitals, Egypt
6Department of Obstetrics and Gynecology, Benha Faculty of Medicine, Benha University, Benha, Egypt
Correspondence to: Rehab M. Elsaid Tash, Department of Microbiology & Immunology, Zagazig Faculty of Medicine, Zagazig, Egypt.
| Email: |  |
Copyright © 2016 Scientific & Academic Publishing. All Rights Reserved.
This work is licensed under the Creative Commons Attribution International License (CC BY).
http://creativecommons.org/licenses/by/4.0/

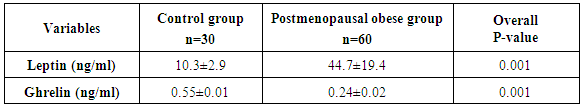
Obesity is a community health problem affecting over one billion adult persons worldwide. Ghrelin and leptin levels are influenced by body fat and pubertal stage. Leptin is known to play an important role in the pathogenesis of obesity. The objective of this study was to evaluate the levels of the ghrelin and leptin in attempt to assess their role in the pathogenesis of obesity in postmenopausal women. Methods: This study was performed on sixty postmenopausal obese patients and 30 healthy controls. All obese patients have body mass index (BMI) ≥ 30 Kg/m2. Among healthy persons, those with a BMI<30 kg/m² were selected as the control group. Ghrelin and leptin concentrations were measured by ELISA method. Results: Leptin levels were significantly higher in obese postmenopausal women compared to controls. On the contrary, ghrelin levels were significantly lower in postmenopausal obese patients in comparison with the control group.Present study revealed significant negative correlation between ghrelin and BMI (P≤ 0.001), and revealed significant positive correlation between leptin and BMI (P≤ 0.001). Conclusions: From these results, the increase in leptin levels together with the decrease of ghrelin levels probably fails to suppress appetite in obese postmenopausal women and leptin concentration could be considered a good marker of the amount of body fat in obese conditions and could be used as a line of treatment.
Keywords: Ghrelin, Leptin, Obesity, Body mass index (BMI)
Cite this paper: Rehab M. Elsaid Tash, Omnia A. El-Dydamoni, Amgad A. Ezzat, Bahaa Mohamed Ahmed Badr, Emad E. Radwan, Mohamed I. Ahmed, Ghrelin and Leptin in Obese Postmenopausal Patients, Clinical Medicine and Diagnostics, Vol. 6 No. 3, 2016, pp. 77-83. doi: 10.5923/j.cmd.20160603.06.
Article Outline
1. Introduction
- Obesity is now dramatically rising worldwide. It is a major risk factor for insulin resistance, type 2 diabetes, heart disease, orthopedic problems, and many other chronic diseases [1, 2]. The etiology is multifactorial, with genetic, socioeconomic, behavioral or psychological influences such as poor dietary habits, a sedentary lifestyle and unhealthy behaviors leading to an increase in the related morbidity and mortality [3]. Adipocytes produce and secrete several proteins that act as hormones, responsible for the regulation of energy intake and expenditure. Ghrelin and leptin are two hormones playing an important role in the regulation of food intake and body weight [4-6]. Leptin is a 67 amino-residue peptide, the protein product of the obesity (ob) gene and plays a key role in regulating long-term energy homeostasis and body fat stores [7]. It is a neuro-hormone that is secreted by adipocytes and binds to receptors in the hypothalamus [8]. Following release into the circulation, leptin crosses the blood-brain barrier and binds to leptin receptors in the hypothalamus; this peptide controls energy metabolism at the level of hypothalamus by suppressing the food intake and stimulating energy expenditure [7, 9, 10]. Food restriction lower leptin levels and this is reversed by re-feeding because the main function of leptin is to signal starvation when levels are low [6, 11]. Its levels are influenced by the amount of body fat, as they are found to be high in obese and low in lean individuals [9, 12]. Ghrelin is a 28 amino-residue peptide and synthesized predominantly by the stomach. Substantially lower amounts were detected in bowel, pancreas, kidneys, the immune system, placenta, testes, pituitary, lung, and hypothalamus. Physiologically, ghrelin secretion is inhibited by food intake and stimulated during fasting and after weight loss [13, 14]. Ghrelin circulates in both acylated and desacylated forms. Acylation is essential for orexigenic (appetite stimulating) activity, whereas desacyl ghrelin has recently been shown to exert an anorexigenic effect [15]. Among several other biological functions, ghrelin was found to produce positive energy balance as it plays a role in the regulation of energy balance and attenuates leptin-induced reduction in food intake and body weight [6, 16, 17]. Ghrelin levels are lower in obese subjects compared to lean, and weight loss result in an increase in its level. The highest levels of ghrelin are found during early postnatal life, when growth hormone begins to exert its effects on growth. Pre-pubertal children have higher ghrelin concentrations than those in puberty [18, 19].The objectives of this study is to compare ghrelin and leptin levels in obese and non-obese post-menopausal women and to investigate the correlation between obesity and these hormones.
2. Subjects and Methods
2.1. Subjects
- The present study was carried out on sixty postmenopausal obese females (obesity was defined according to WHO criteria 2010 as BMI greater than or equal to 30 kg/m2 and a waist circumference equal to or above 90 percentile of their age) with matched age range 49-67 years, selected by systematic sampling from outpatient clinics of Obstetrics and Gynecology Departments of Suez Canal and Benha Universities Hospitals, Egypt from January 2014 till October 2014. In addition thirty apparently healthy individuals with average body weight, with matched age range 46-65 years, and were enrolled in the study as a controls, their BMI <30 kg/m². All subjects were at least 1-2 years postmenopause with a similar lifestyle and no significant physical training program before at least 6 months from the beginning of the study, subjects with a known history of primary hyperlipidemia, diabetes mellitus type 2 or secondary obesity were excluded from the study. The study and data accumulation were carried out with approval from the appropriate Institutional Review Board (IRB).
2.2. Methods
- After their consent, all subjects included in the study following systematic sample technique, were subjected to full history taking with particular emphasis on age, family history, history of any systemic diseases e.g. diabetes, hypertension, dyslipidemia or any associated diseases, drug intake, detailed menstrual history including age, duration since menopause, history of fertility. Full clinical examination including anthropometric measurements which were performed after an overnight fast. Body weight was measured on calibrated balances or electronic scales to the nearest 0.1 kg. Height was measured to the nearest centimeter. BMI was calculated as body weight in kilograms (kg) divided by body height (meters) squared (m2) expressed as Kg/m2. Using a tape measure, with the subject standing, the waist was measured as the narrowest circumference between the lower costal margin and the iliac crest. The hip was the maximum circumference at the level of the femoral trochanters. All participants were classified to overweight or obese using international sex and age specific BMI cut-offs. BMI divided into three groups according to the criteria of the World Health Organization WHO; lean (BMI 18–24.5 kg/m2), overweight (BMI 25–29.5 kg/m2) and obese (BMI ≥30 kg/m2. Lipid profile including total cholesterol (TC), serum triglycerides (TG), high density lipoprotein (HDL cholesterol) and low density lipoprotein (LDL cholesterol) were done for all subjects.
2.3. Quantitative Measurement of Human Leptin by ELISA Method
- Specimen Collection: Early morning venous blood sample was collected from all subjects after an overnight fast (12-16 hr) in vacutainer tubes. Clotted samples were centrifuged at 3000 rpm for 5 minutes and stored at -20ºC till the time of assay of leptin.Human leptin ELISA kit (Catalog No.: RD191001100) is a sandwich enzyme immunoassay for the quantitative measurement of human leptin. It was supplied by BioVendor GmbH, D-69120 Heidelberg, Germany. In the BioVendor human leptin ELISA kit, standards, quality controls and samples are incubated in microplate wells pre-coated with polyclonal anti-human leptin antibody. After 60 minutes incubation and washing, polyclonal anti-human leptin antibody, conjugated with horseradish peroxidase (HRP) is added to the wells and incubated for 60 minutes with captured leptin. Following another washing step, the remaining HRP conjugate is allowed to react with the substrate solution (TMB). The reaction is stopped by addition of acidic solution and absorbance of the resulting yellow product is measured. The absorbance is proportional to the concentration of leptin. A standard curve is constructed by plotting absorbance values against concentrations of standards, and concentrations of unknown samples are determined using this standard curve.
2.4. Detection of Ghrelin Level by ELISA Method
- Specimen collection: Collect blood samples into the lavender vacutaner tubes, which contain EDTA and can collect blood/tube. Gently rock the lavender vacutaner tubes several times immediately after collection of blood for anticoagulation. Transfer the blood from the lavender vacutaner tubes to centrifuge tubes and gently rock for several times to inhibit the activity of proteinases. Centrifuge the blood at 1,600 rpm 1,600 for 15 minutes at 4°C and kept at -70°C till the time of assay. Ghrelin level was measured by a commercially available ELISA kit supplied by DRG® Ghrelin (Human) ELISA International Inc., USA (Catalog No.: EIA-3706). This assay is an enzyme immunoassay kit designed to detect a specific peptide and its related peptides based on the principle of “competitive” enzyme immunoassay. The standard curve was plotted using curve-fitting software capable of 4 parameter logistics to quantify the concentration of standard peptide. A standard curve of a peptide with known concentration can be established accordingly. The peptide with unknown concentrations in samples can be determined by extrapolation from this standard curve.
2.5. Statistical Analysis
- Data were collected, revised, coded and entered to the statistical package for social science (SPSS). The statistical analysis of the results was carried out according to the conventional standard statistical procedures using computed statistical analysis by SPSS, version 20.0. The quantitative data were presented as mean and standard deviations (mean ± SD). All variables were tested for normality of distribution, Fisher’s exact test and independent samples t-test (t value). The confidence interval was set to 95% and the margin of error accepted was adjusted to 5%. So, the p-value was considered insignificant at the level of > 0.05, significant at the level of < 0.05 and highly significant at the level of < 0.01.
3. Results
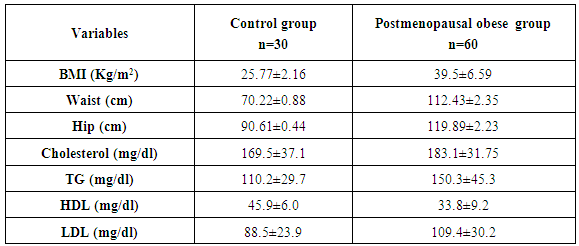
- The mean anthropometric (BMI, waist and hip) and lipid profile [Total cholesterol (TC), serum triglycerides (TG), high density lipoprotein (HDL cholesterol) and low density lipoprotein (LDL cholesterol)] of two studied groups are presented in table 1.
|
|
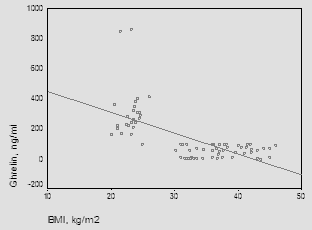 | Figure (1). Correlation between ghrelin and BMI |
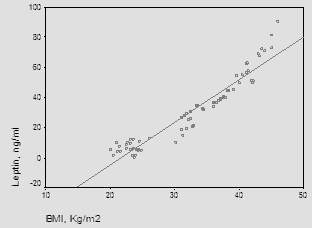 | Figure (2). The correlation between leptin and BMI |
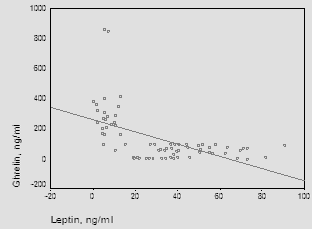 | Figure (3). Correlation between ghrelin and leptin |
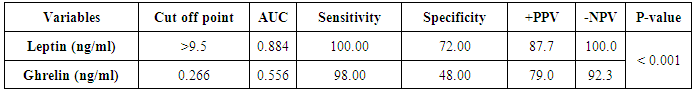
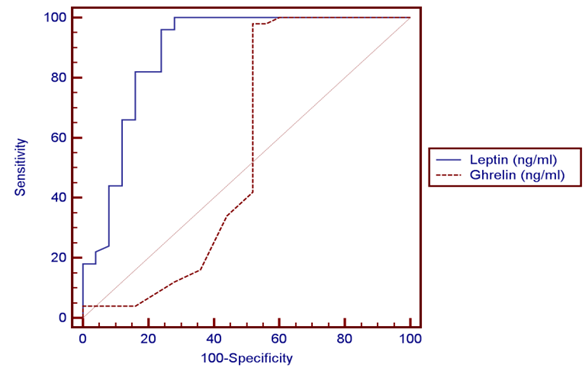 | Figure (4). ROC curve of leptin and ghrelin |
4. Discussion
- The main objectives of the present study were to compare ghrelin and leptin levels in obese and non-obese post-menopausal women and to investigate the correlation between obesity and these hormones.In the current study, statistically significant increases were observed on comparing serum triglycerides and cholesterol in the obese group with control. Similar results were obtained by Gil-Campos et al. [20] who reported a significant increase in serum triglycerides in obese group. Similar results were obtained by Isabelle et al. [21] who reported a significant increase in plasma cholesterol and triglyceride concentrations in obese subjects. Cholesterolemia and triglyceridemia were the result of an increase in lipid concentrations in all lipoprotein fractions. The results of the current work demonstrated that, statistically significant increase in leptin concentrations was observed in obese subjects when compared to the control group (P≤0.001), in addition to significant positive correlation between serum leptin and BMI (P≤0.001).In the same line with our results, Crowley [22] stated that, leptin levels were markedly elevated in obese humans than in lean individuals and directly associated with adiposity and as leptin inhibits gastric ghrelin secretion, accordingly ghrelin has low concentrations in obese subjects. Also, Gil-Campos et al. [20] noticed that fasting leptin levels were positively associated with BMI. Current results come like what was found in Chan et al. [23], suggesting that leptin might be the important factor for the negative feedback regulation of ghrelin and leptin was elevated in obese subjects compared with normal weight ones. In the present study, the levels of ghrelin were significantly reduced in obese post-menopausal group when compared to control group (P≤0.001) and also, significant negative correlation between ghrelin and BMI (P≤0.001). These results were supported by a study carried by Carlson et al. [24] in which ghrelin levels were found to be significantly higher in normal weight women, 15, 60 and 120 minutes post-meal when compared to overweight/obese women and also goes hand in hand with the study carried by Karczewska-Kupczewska et al. [25] who found that in the fasting state, serum ghrelin was higher in normal-weight women than in overweight/obese women. Similar findings were reported by several studies which stated that basal ghrelin levels were significantly lower in overweight/obese group compared with normal weight. Katsuki et al. [26], Erdmann et al. [27], Esplund et al. [28], Le Roux et al. [29] and Erdie-Lalena [30] detected that ghrelin secretion increases in anorexia and cachexia and was reduced in obesity, which it might act as a signal of the metabolic balance to the CNS and might contribute to these conditions as either compensatory or causative element. Also, Doogue et al. [31] concluded that plasma ghrelin concentrations were found to be inversely associated with obesity and food intake. However, according to Sondergaard et al. [32], obesity was a strong predictor of low basal ghrelin concentrations, and it had a key role in regulating fasting plasma ghrelin suppression, apart from being diabetic or not. In accordance with the results of the current study, Shiiya et al. [33] found that fasting plasma ghrelin concentrations were negatively associated with BMI in both non-diabetic and diabetic patients. They found that overweight/obese subjects had lower fasting plasma ghrelin concentrations than normal weight subjects. Additionally, Anderworld et al. [34], who reported a significant association between fasting ghrelin and BMI. Comparable results were elucidated by Barazzoni et al. [35] in obese and lean Caucasians and Beasley et al. [36] who found that overweight/obese individuals had lower ghrelin concentrations compared to normal weight individuals. In support of the same results, Daghestani [37] found that ghrelin concentrations decreased in overweight/obese Saudi females compared to lean ones; i.e. ghrelin levels were negatively associated with BMI. Castaneda et al. [38] suggested that ghrelin itself is not the key cause of obesity and stated whether potentially low levels of ghrelin in obesity represent an adaptation to the positive energy balance or an increased sensitivity to ghrelin remains an open question. Zou et al. [39] speculated that the lower ghrelin levels in obesity were part of negative feedback to inhibit appetite and body weight, but not the primary cause of obesity. Ghrelin plays an important role in the regulation of food intake. Therapeutic intervention with ghrelin in catabolic situation may induce a combination of enhanced food intake, increased gastric emptying and nutrient storage, so ghrelin agonists might address cachexia Constance et al. [40]. Present work revealed a significant negative correlation between ghrelin and leptin levels (r=0.603, P≤ 0.001). This finding was in agreement with the study done by Tschop et al. [41]. They showed that obese individuals have lower ghrelin serum concentrations than healthy controls. Furthermore, low concentrations of ghrelin were thought to be consequence of elevated serum levels of leptin, because fasting serum ghrelin concentrations were negatively correlated with fasting serum concentrations of leptin. Decreased ghrelin level in obesity might be due to a secondary response to overeating. Similarly, Bilgin Yüksel [42] who stated that lower serum ghrelin levels in obese subjects compared to individuals with normal body weight and showing a negative correlation with BMI, while leptin levels are increased. These findings have been interpreted as pointing towards a co-regulatory role of ghrelin and the upper gastrointestinal tract on food intake. Ghrelin increases gastric and intestinal motility. Leptin and ghrelin appear to have a negative regulatory role on the release and activity of each other. The weight reducing effect of leptin was not exercised only on the hypothalamic centers but also by the peripheral inhibitory effects on secretion and activities of ghrelin. Matching to our results, Vincent [43] demonstrated that, In elderly people relatively large amounts of fat increase the satiety signal from Glucagon-Like peptide 1 (GLP-1) and lower the acylated to desacylated ratio of ghrelin, consequently decreasing hunger. This condition may lead to a reduction in calorie intake, so positive energy balance lower ghrelin levels as a result of obesity, but not a cause of obesity. The previous findings were debated by Bennette et al. [44] who denoted that ghrelin had no association with obesity, and might not be causally involved in its development. Moreover, Pacifico et al. [45] found out that hyperinsulinemia resulted in a marked decrease in plasma ghrelin and this decrease was related to insulin sensitivity in both normal weight and overweight/obese subjects.
5. Conclusions
- Based on the results of this study, the reduction in the ghrelin together with the increase in leptin levels probably fails to suppress appetite in obese patients. Leptin concentration could be considered a good marker of the amount of body fat in obesity and could be used as a line of treatment. Thus, we recommend a larger study with a bigger a sample size for better statistical analysis. Further studies are required to explain the etiology of leptin and the effects of ghrelin deficiency in obesity, to explain the role of measuring ghrelin for assessing the nutritional status, and to assess the impact of circulating leptin on fuel metabolism after food and macronutrient intake. Finally, exploration of whether recombinant leptin or ghrelin antagonist as a potential therapeutic target for obesity in the future would have a significant impact on clinical pratice.
References
| [1] | Burger KS and Berner LA (2014): A functional neuroimaging review of obesity, appetitive hormones and ingestive behavior. Physiology & Behavior; 136: 121–7. |
| [2] | Comninos AN, Jayasena CN and Dhillo WS (2014): The relationship between gut and adipose hormones, and reproduction. Hum. Reprod. Update; 20 (2): 153–74. |
| [3] | Pan H, Guo J and Su Z (2014): Advances in understanding the interrelations between leptin resistance and obesity. Physiology & Behavior; 130: 157–169. |
| [4] | Mohamed WS, Hassanien MA and Sayed KE (2014): Role of Ghrelin, Leptin and Insulin Resistance in Development of Metabolic Syndrome in Obese Patients. Endocrinol Metab Synd., 3: 122. |
| [5] | Sharifi F, Mahdi Y, Abdolreza E, Nouraddin M, and Zahra S (2013): Acylated ghrelin and leptin concentrations in patients with type 2 diabetes mellitus, people with prediabetes and first degree relatives of patients with diabetes, a comparative study. Journal of Diabetes & Metabolic Disorders; 6581-12-51. |
| [6] | Strohacker K, McCaffery JM, MacLean PS and Wing RR (2013): Adaptations of leptin, ghrelin or insulin during weight loss as predictors of weight regain: a review of current literature. International Journal of Obesity; 10.1038/118. |
| [7] | Rőszer T, Józsa T, Kiss-Tóth ED, De Clerck N and Balogh L (2014): Leptin receptor deficient diabetic (db/db) mice are compromised in postnatal bone regeneration. Cell and Tissue Research; 356 (1): 195–206. |
| [8] | Zhang L, Lu M, Yuan L, Lai W and Wang Y (2014): Association of leptin gene-2548 G/A polymorphism with obesity: a meta-analysis. Wei Sheng Yan Jiu (in Chinese); 43 (1): 128–32. |
| [9] | Sanchez-Garrido MA and Tena-Sempere M (2013): Metabolic control of puberty: Roles of leptin and kisspeptins. Horm Behav., 64 (2): 187–94. |
| [10] | Ye XL and Lu CF (2013): Association of polymorphisms in the leptin and leptin receptor genes with inflammatory mediators in patients with osteoporosis. Endocrine., 44 (2): 481–8. |
| [11] | Martins MC, Lima FL and Fonseca A (2012): Relationship between leptin and body mass and metabolic syndrome in an adult population. Rev Port Cardiol., 31: 711-719. |
| [12] | Oswal A and Yeo G (2010): Leptin and the control of body weight: A review of its diverse central targets, signaling mechanisms, and role in the pathogenesis of obesity. Obesity; 18 (2): 221–9. |
| [13] | Christine D (2013): Structure and physiological actions of ghrelin. Laboratory of Pathophysiological and Nutritional Biochemistry; Volume 518909, 25 pages. |
| [14] | Sato T, Nakamura Y, Shiimura Y, Ohgusu H, Kangawa K and Kojima M (2012): Structure, regulation and function of ghrelin. J. Biochem., 151(2):119-128. |
| [15] | Verhulst PJ and Depoortere I (2012): Ghrelin's second life: from appetite stimulator to glucose regulator. World J Gastroenterol., 18(25):95–3183. |
| [16] | Kollias H (2011): Leptin, Ghrelin and Weight Loss: It’s Complicated precision. Nutrition; 95(11):5037-5044. |
| [17] | Perello M, Scott MM, Sakata I, Lee CE, Chuang JC, Osborne-Lawrence S, Rovinsky SA, Elmquist JK and Zigman JM (2012): Functional implications of limited leptin receptor and ghrelin receptor co-expression in the brain. The Journal of Comparative Neurology; 520 (2): 281–94. |
| [18] | Al-Hakeim HK and Ali MM (2012): Low ghrelin level is associated with poor control and bad prognosis parameters in obese diabetic patients. Journal of Diabetology; 1-5. |
| [19] | Heppner KM and Tong J (2014): Mechanisms in endocrinology: Regulation of glucose metabolism by the ghrelin system: Multiple players and multiple actions. European Journal of Endocrinology / European Federation of Endocrine Societies; 171 (1): R21–32. |
| [20] | Gil-Campos M, Aguilera CM, Canete R and Gil A (2006): Ghrelin: a hormone regulating food intake and energy homeostasis. Br J Nutr., 96(2):201-26. |
| [21] | Isabelle C, Estelle T and Louis P (2005): Influence of obesity on plasma lipid and lipoprotein concentrations. AJVR; 66:81-86. |
| [22] | Crowley VE (2008): Overview of human obesity and central mechanisms regulating energy homeostasis. Ann Clin Biochem., 45: 245-255. |
| [23] | Chan JL, Bullen J, Lee JH, Yiannak-Ouris N and Mantzoros CS. (2004): Ghrelin levels are not regulated by recombinant leptin administration and/or three days of fasting in healthy subjects. J Clin Endocrinol Metab., 89: 335-343. |
| [24] | Carlson JJ, Turpin AA, Wiebke G and Hunt SC. (2009): Pre- and post-prandial appetite hormone levels in normal weight and severely obese women. Nutr Metab., 11(6): 32-37. |
| [25] | Karczewska-Kupczewska M, Straczkowski M and Adamska A. (2010): Increased suppression of serum ghrelin concentration by hyperinsulinemia in women with anorexia nervosa. Eur J Endocrinol., 28(2): 352-360. |
| [26] | Katsuki A, Urakawa H, Gabazza EC, Murashima S, Nakatani K, Togashi K, Yano Y, Adachi Y and Sumida Y (2004): Circulating levels of active ghrelin is associated with abdominal adiposity, hyperinsulinemiaand insulin resistance in patients with type 2 diabetes mellitus. Eur J Endocrinol., 151(5): 573-577. |
| [27] | Erdmann J, Lippl F, Wagenfeil S and Schusdziarra V. (2005): Differential association of basal postprandial plasma ghrelin, leptin, insulin and type 2 diabetes. Diabetes; 54: 1371-1378. |
| [28] | Espelund U, Hansen TK, Hojlund K and Beck-Nielsen H. (2005): Fasting unmasks a strong inverse association between ghrelin and cortisol in serum: Studies in obese and normal weight subjects. J Clin Endocrinol Metab., 90: 741-746. |
| [29] | Le Roux CW, Patterson M and Vincent RP (2005): Postprandial plasma ghrelin is suppressed proportional to meal calorie in normal weight but not obese subjects. J Clin Endocrinol Metabol., 90: 1068-1071. |
| [30] | Erdie-Lalena CR (2006): Ghrelin levels in very young children with Prader-Willi syndrome. J Pediatr., 149: 199-204. |
| [31] | Doogue MP, Begg EJ and Moore MP (2009): Metformin increases plasma ghrelin in type 2 diabetes. Br J Clin Pharmacol., 68(6): 875-882. |
| [32] | Sondergaard E, Gormsen LC, Nelleman B, Vestergaard ET, Christiansen JS and Nielsen S (2008): Visceral fat mass is a strong predictor of circulating ghrelin levels in premenopausal women. Eur J Endocrinol., 60(3): 375-379. |
| [33] | Shiiya T, Nakazato M, Mizuta M, Date Y, Mandal MS, Tanaka M, Nozoe S, Hosoda H, Kangawa K and Matsukura S (2002): Plasma ghrelin levels in lean and obese humans and the effect of glucose on ghrelin secretion. J Clin Endocrinol Metabol., 87: 240-244. |
| [34] | Anderworld C, Brabant G, Bernroider E, Horn R, Breham A, Waldhausl W and Roden M. (2003): Insulin-dependent modulation of plasma ghrelin and leptin in concentrations is less pronounced in type 2 diabetic patients. Diabetes; 52(7): 1792-1798. |
| [35] | Barazzoni R, Zanetti M and Ferreiral (2007): Relationships between desacylated and acylated ghrelin and insulin sensitivity in metabolic syndrome. J Clin Endocrinol Metab., 92: 3935-3940. |
| [36] | Beasley JM, Ange BA, Anderson CA, Miller ER, Holbrook JT and Appel LJ (2008): Characteristics associated with fasting appétit hormones (obestatin, ghrelin and leptin). Obesity; 7(2): 349-354. |
| [37] | Daghestani MH (2009): A preprandial and postprandial plasma levels of ghrelin hormone in lean, overweight and obese Saudi females. Journal of King Saud University (Science); 21, 119–124. |
| [38] | Castaneda TR, Tong J, Datta R, Culler M and Tschop MH (2010): Ghrelin in the regulation of body weight and metabolism. Frontiers in Neuroendocrinology; 31: 44-60. |
| [39] | Zou CC, Liang L and Zhao ZY (2008): Factors associated with fasting plasma ghrelin levels in children and adolescents. World J Gastroentrol., 14(5): 790-794. |
| [40] | Tshop M, Smiley DL and Heiman ML (2008): Circulating Ghrelin levels are decreased in human obesity .diabetes; 50:707-9. |
| [41] | Constance CH, Karolin M, Annette G (2009): Ghrelin a novel generation of anti- obesity drug. European peptide Society; 15: 711-730. |
| [42] | Bilgin Y (2009): Neuroendocrinal control of obesity. J Clin Res Ped Endo., (Suppl 1):58–6. |
| [43] | Vincent E (2010): Ghrelin, hunger, obesity, and aging .Aging sciences-Anti Aging Firewalls; 15. |
| [44] | Benette NR, Boyne MS, Cooper RS, Royal-Thomas TY, Benette FA, Luke A, Wilks RJ and Forrester TE (2008): Impact of adiponectin and ghrelin on incident glucose tolerance and on weight change. Clin Endocrinol., 70(3): 408-414. |
| [45] | Pacifico L, Poggiogalle E, Costantino F and Anania C (2009): Acetylated and non-acetylated ghrelin levels and their association with insulin resistance in obese and normal weight children with metabolic syndrome. Eur J Endocrinol., 22(3): 288-297. |