-
Paper Information
- Next Paper
- Paper Submission
-
Journal Information
- About This Journal
- Editorial Board
- Current Issue
- Archive
- Author Guidelines
- Contact Us
Clinical Medicine and Diagnostics
p-ISSN: 2163-1433 e-ISSN: 2163-1441
2016; 6(3): 54-61
doi:10.5923/j.cmd.20160603.03

Effects of Peri-auricular Percutaneous Electrical Neuro-Modulating Field Stimulation (PENFS) of the Cranial Nerves on the Auto-regulatory Hemodynamics of Intracranial Circulation in a Single Blind Sham Controlled Cohort
 Abstract
 Reference
 Full-Text PDF
 Full-text HTML
Arthur Roberts1, 2, 3, Gaston Dana4, 5, Alec Sithole6
1Indiana Craniofacial Center, Indianapolis, USA
2Department of Oral Pathology, Medicine and Radiology, Indiana University School of Dentistry, Indianapolis, USA
3Department of Anesthesia, Critical Care, and Pain Management, University of Edinburgh, College of Medicine and Veterinary Medicine, Edinburgh, UK
4Johnson Memorial Hospital, Franklin, USA
5College of Osteopathic Medicine, Marian University, Indianapolis, USA
6Department of Computer Science, Mathematics and Physics, Missouri Western State University, St Joseph, USA
Correspondence to: Arthur Roberts, Indiana Craniofacial Center, Indianapolis, USA.
| Email: |  |
Copyright © 2016 Scientific & Academic Publishing. All Rights Reserved.
This work is licensed under the Creative Commons Attribution International License (CC BY).
http://creativecommons.org/licenses/by/4.0/

Percutaneous Electrical Neuro-modulating Field Stimulation (PENFS) is a non-narcotic clinical intervention for acute post-surgical and chronic pain conditions. Neuro-Stim System© (EAD) peri-auricular cranial nerve field neuro-modulating stimulation device was performed on a cohort of 12 healthy adult patients over a 3-week span. A Transcranial Doppler (TCD) was used to assess intracranial hemodynamic changes including fluid velocity, Pourcelots resistivity index (RI) and Gosling's pulsatility index (PI) in the middle cerebral, anterior cerebral, posterior cerebral, basilar, and vertebral arteries. Upon peri-auricular neuro-modulating stimulation by the NSS, the mean hemodynamic flow in the cerebral arteries indicated a compensatory response, increasing by 1-19%, while the PI and RI values decreased by 2-11% from the baseline. The study indicates that NSS peri-auricular stimulation decreases the flow resistance and increases the cerebral perfusion.
Keywords: Percutaneous Electrical Nerve field-Stimulation, Transcranial Doppler ultrasound, Neuro-Stim System device, Intracranial hemodynamic flow, Pourcelots resistivity index, Gosling's pulsatility index, Cranial nerve stimulation
Cite this paper: Arthur Roberts, Gaston Dana, Alec Sithole, Effects of Peri-auricular Percutaneous Electrical Neuro-Modulating Field Stimulation (PENFS) of the Cranial Nerves on the Auto-regulatory Hemodynamics of Intracranial Circulation in a Single Blind Sham Controlled Cohort, Clinical Medicine and Diagnostics, Vol. 6 No. 3, 2016, pp. 54-61. doi: 10.5923/j.cmd.20160603.03.
Article Outline
1. Introduction
- PENFS is a neurological procedure used for treatment for many acute and chronic pain conditions, [1-3] and is aimed at reducing the long-term side effects, dependency, and opiate abuse associated with more traditional pharmacological protocols. This study investigated the intracranial hemodynamic effect of peri-auricular PENFS.The Neuromatrix theory [4, 5] predicts pain perception and response to be moderated by a complex series of entangled feedback loops, consistent with the maintenance of homeostasis. [6] It further predicts pain modulating factors outside of the somatic sensory pathways. Several cranial nerves participate in both the somatic and exo-somatic pathways of the neuromatrix, and thence autonomic modulation. Among these are CN’s V, VII, X, any occipital nerve, the terminal branches of which are predictably represented in the external human auricle [7]. (Fig. 1.)
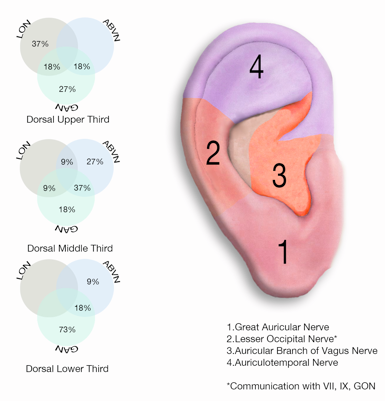 | Figure 1. Auricular innervation showing the dorsal upper one third, dorsal middle one third, and dorsal lower one third to illustrate the cranial nerve distribution in ear [1] |
 | (1) |
2. Hypothesis
- The NSS © (EAD) neuro-modulating device stimulates the extrinsic perivascular innervation as well as the micro-vascular bed to decrease flow resistance and increase cerebral perfusion after percutaneous implantation and activation in the peri-auricular region.
3. Rationale
- Peripheral vascular constriction is a well-known result of sympathetic stimulation. Vagal stimulation can reduce sympathetic drive. Fragos et al., demonstrated vagal nerve access through terminal branches of the vagal nerve in the external human auricle [25, 26]. The major goal of this analysis was to develop a better understanding of whether the peripheral vascular changes observed in connection with PENFS cranial nerve stimulation have an effect on the hemodynamics of intracranial circulation.
4. Methods and Materials
- The NSS device description, procedure, and methods of used to analyse the data are presented in the sections below.
4.1. Device Description
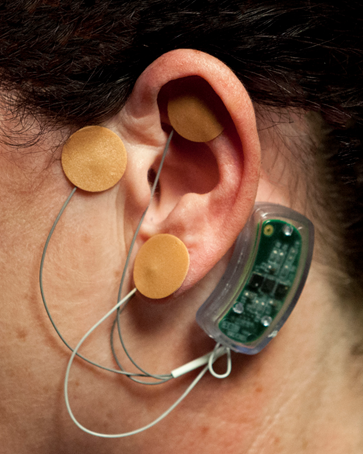
- The NSS© (EAD) was cleared by the FDA in October of 2014 [27], and is categorized as a minimal risk device by the US Food and Drug Administration (FDA), Defense and Veterans Center for Integrative Pain Management (DVCIPM), and the Institutional Review Board (IRB) of Children's Hospital of Wisconsin.The NSS family of devices (EAD, MFS, and BRIDGE) are percutaneously implanted into the peri-auricular area targeting cranial nerves V, VII, IX and X; and branches of the greater and lesser occipital nerves and their associated neurovascular bundles (Fig1). For this study the NSS © (EAD) was used (Fig 2.).
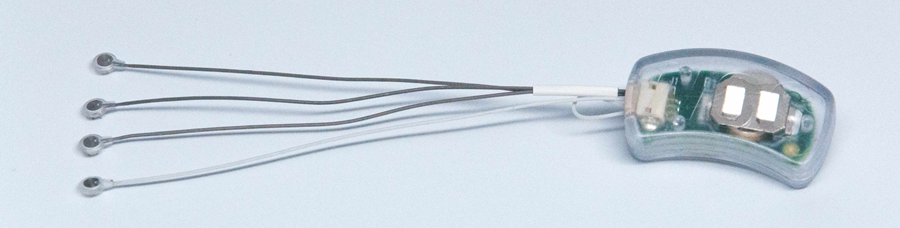 | Figure 2. Picture of the NSS © (EAD) with three 4-pin arrays and one single pin ground wire connected to the generator. The device is powered by three 1V batteries After activation the device produces a neuro-modulating signal ranging from 1-10 kQ in intervals of 100ms, a bipolar impulse width of 1ms with a duty cycle of 2 hr duty/2 hr rest for a total of 120 hours [28] |
4.2. Inclusion and Exclusion Criteria
- A cohort of 12 subjects, ages 19-64, were randomly recruited. The subjects were interviewed individually. Past medical and surgical histories were collected and screened for potentially disqualifying morbidities. All subject’s questions were answered to the subject’s satisfaction. Informed consents were signed. Patients were appointed individually at the test site. Upon arrival, the subjects were informed of the nature of the study. Pre-written instructions were read (Appendix 1) to assure uniform understanding of the instructions.
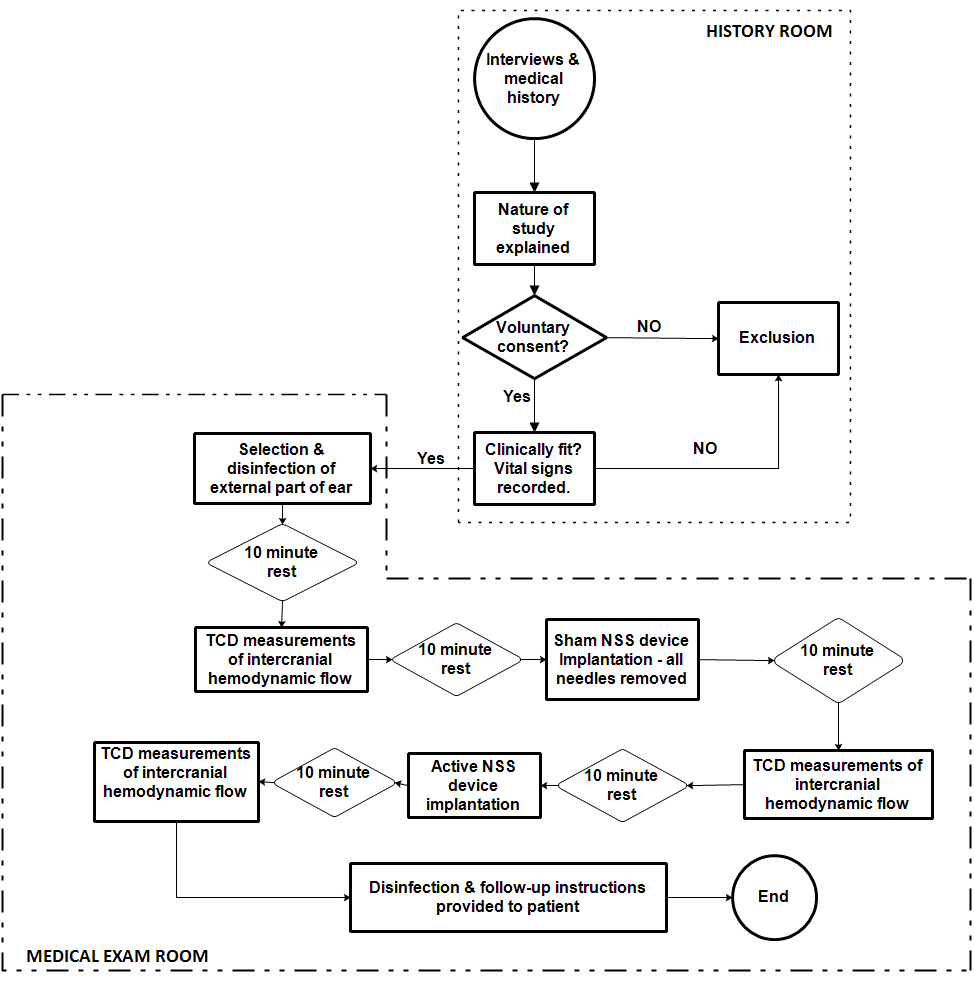 | Figure 3. Sample data collection protocol |
4.3. Protocol and Procedure
- After instructions were read, vital signs were taken and recorded. The subject was placed on an exam table in the supine position. For each subject, the chosen ear was disinfected with a 70% isopropyl alcohol pad and left undisturbed for 10 minutes. After 10 minutes, the baseline TCD assessment of the blood flow in the middle cerebral, anterior cerebral, posterior cerebral, basilar, in vertebral arteries was performed. Each TCD ultrasound assessment involved measuring the blood flow (mean, peak systolic, and end diastolic) velocities and the downstream cerebral resistance using Gosling's Pulsatility Index (PI) and Pourcelots Resistivity Index (RI).
4.3.1. TCD Measurements Prior to NSS Sham Implantation
- Following the disinfection protocol and TCD procedure, pre-sham data was collected and recorded. The mean velocity, peak systolic velocity, end diastolic velocity (Edv), PI and RI are designated as “Pre-mean”, “Pre-Peak”, “Pre-Edv”, “Pre-PI” and “Pre-RI” for the blood flow through the anterior cerebral artery (ACA), middle cerebral artery (MCA), and posterior cerebral artery (PCA).
4.3.2. TCD Measurements for Sham NSS Device
- The NSS sham device (no batteries and percutaneous needles removed) was then placed according to protocol. (Fig. 4.).
 | Figure 4. NSS sham device in place on patient |
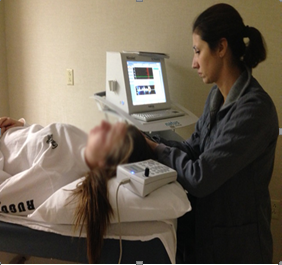 | Figure 5. Patient in supine position during TCD data collection |
4.3.3. TCD Measurements for Activated NSS Device
- An active NSS device was placed in a similar way following the protocol used to implant the shame device. The serial number and bar code of the device was noted and placed in the records, and the subject was left undisturbed for 10 minutes. Thereafter, the activated NSS device was implanted according to protocol [1]. Following 10 minutes of NSS device activation, a TCD ultrasound assessment of blood flow through the arterial branches performed as previously indicated. The mean velocity, peak systolic velocity, end diastolic velocity, PI and RI data are respectively presented as “Tx-mean”, “Tx-Peak”, “Tx-Edv”, “Tx-PI” and “Tx-RI” for the ACA, MCA, and PCA. The active device was removed, and the subject’s ear was cleaned with a 70% alcohol pad. The serial number was verified, and the device was disposed in an individual biohazard bag. The subject was then released with follow up instructions (Appendix 2).
4.4. Statistical Methods
- Methods used include descriptive statistics of initial vital numeric data, TCD blood flow measures, correlation analysis, and paired sample test of differences between the means for different treatments. It was assumed that all variances were normally distributed. All statistical analyses were performed using IBM SPSS Statistics 23 software.
5. Data and Analysis
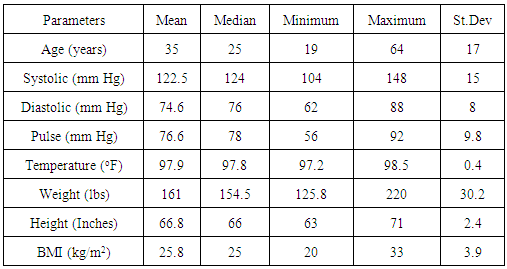
- Descriptive statistics for of the key variables that were measured prior to NSS implantation and TCD ultrasound measurements are presented in Table 1. The data was used to access any clinical indications for potentially disqualifying morbidities.
|
5.1. TCD-Measured ACA Parameters
- The TCD measurements include mean, the pulsatile indices (PI), resistive indices (RI), peak systolic and end diastolic velocities in the ACA. The mean baseline flow in the ACA was found to be 37.3 ± 7.3 cm/s (mean ± standard deviation). Upon activation, the mean blood flow in the ACA was 46.5 ± 8.1 cm/s. The mean PI and RI before activation were both ≤1.0 ± 0.1, but decreased to 0.8 ± 0.1 and 0.6 ± 0.1 upon activation, respectively. The observed changes in the mean ACA blood velocity are presented in Fig. 6.
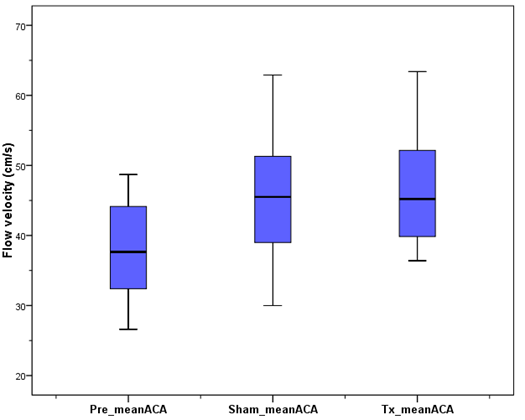 | Figure 6. Variation in mean blood flow velocity through anterior cerebral artery (ACA). The Pre-meanACA, Sha-meanACA, and Tx-meanACA represent the pre-activation, placebo, and active NSS mean flow velocities, respectively |
5.2. TCD-Measured PCA Parameters
- The baseline mean PCA was found to 35.6 ± 4.9 cm/s. After implantation of the active NSS device, the mean flow rate rose to 36.0 ± 3.9 cm/s. The baseline PI and RI were 1.0 ± 0.2 and 0.6 ± 0.1, respectively. When an active NSS device was implanted, both the mean PI and RI remained almost unchanged. The mean velocity flow in the PCA are presented (Fig. 7).
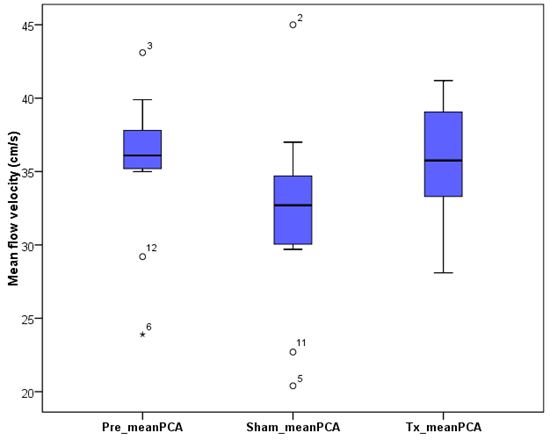 | Figure 7. Variation in mean blood flow velocities in posterior cerebral artery (PCA). The Pre-meanPCA, Sham-meanPCA, and Tx_meanPCA represent the pre-activation, placebo, and active NSS mean flow velocities, respectively |
5.3. TCD-Measured MCA Parameters
- The mean baseline flow was found to be 53.1 ± 9.3 cm/s, and 59.4 ± 11.8 cm/s after the active NSS device was implanted. Even after activation, the PI and RI remain almost constant at 0.9 ± 0.2 and 0.6 ± 0.1. The changes in the mean velocities in the MCA are presented in Fig. 8.
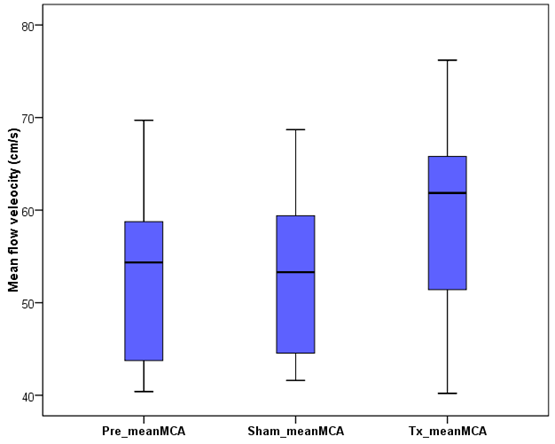 | Figure 8. Mean mean flow velocity in middle cerebral artery (MCA). The Pre-mean MCA, Sham-mean MCA, and Tx_mean MCA represent the baseline, placebo, and active NSS mean flow velocities, respectively |
5.4. Correlation Analysis
- Based on a 2-tailed independent sample tests (p = 0.05), the ACA, PCA, and MCA data was tested for correlation. The following variables were statistically significantly and positively correlated are (p < 0.05): Pre-Edv-ACA and Pre-Mean-ACA (p = 0.01, r = 0.838); TX-PI-PCA and TX-RI-PCA (r = 0.98). The TX-PI-ACA significantly statically positively correlated to all MCA (PI, RI, Mean, Peak, EDV). The Peak-ACA and Mean-ACA were negatively correlated to both PI and RI. The Pre-Mean-ACA, Sham-Mean ACA and the TX-Mean values are weakly negatively correlated to PI-MCA and RI-MCA.
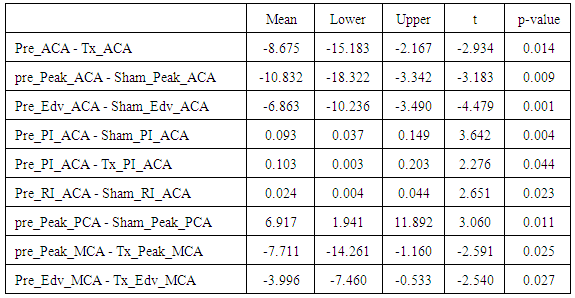
5.5. Effects of Different Treatments
- The ACA, PCA and MCA data was tested for any significant differences in variables due to differences in treatments using paired samples t-test (5 % Significance level). Paired means that were statistically significantly different are presented in Table 2.
6. Discussion
- Percentage changes in blood flow velocity were found to be +18.7%, +1.0%, and +12.0% in the ACA, PCA, and MCA with an activated NSS device implanted over a 10-minute period, respectively. Over the same period, the PI and RI decreased by 10.9% and 5.9% in the ACA blood flow, respectively. In the MCA and PCA, the RI values decreased by 2.0% and 9.0%, respectively. The PI in the PCA decreased by 3.7% and that in the MCA by 1.7%. While this study is the first time that the TCD is used to measure the effect of activated NSS (EAD) on cerebral blood flow, an inverse relation between PI and cerebral perfusion pressure (CPP) has been reported [28]. Consistently, the decreasing PI indices were accompanied by increasing mean flow velocity and CPP in ACA, MCA, and PCA. Our findings indicate that peri-auricular implantation of the NSS stimulates the cranial nerves anatomically located in the peri-auricular area directly affecting the extrinsic perivascular innervation, as well as the micro-vascular bed, of the intracranial arteries to decrease flow resistance and increase cerebral perfusion. There is functional and histological evidence that supports the existence of an extensive network of perivascular nerves that play a role in cerebral blood flow [3, 11, 17, 20, 21]. The functional unit of the endothelial cells, perivascular nerves, and astrocytes have been recognized in research as a neurovascular unit. These nerves have different origins and neurotransmitters that can be extrinsic or intrinsic. Extrinsic perivascular innervation refers to innervation outside of the brain. The external auricle is a unique organ with all three embryological tissues that can have influences on the autonomic nervous system. In particular, the trigeminal nerve, vagus nerve, and cervical plexus innervate different areas of the ear. First, the auricular temporal branch of the trigeminal nerve (CN V) supplies the anterior upper part of the helix consisting mostly of mesodermal tissue. It runs with the superficial temporal artery that supplies the ear. The nerve courses deep to the lateral pterygoid muscle and the neck of the mandible, then splits to encircle the middle meningeal artery to join the main trunk of the mandibular nerve. All three divisions of the trigeminal nerve (ophthalmic, maxillary, and mandibular) join together at the trigeminal ganglion. The central processes of these neurons constitute the sensory root of the trigeminal nerve, which enters the pons at its mid lateral point. Within the pons, many of the sensory axons bifurcate, sending a branch to the pontine trigeminal nucleus and a descending branch to the spinal tract of the trigeminal as it courses caudally to reach the appropriate region of the nucleus of the spinal tract. These primary sensory neurons synapse with the secondary neurons and with the adjacent reticular formation of the brain stem. Axons of secondary neurons project to a variety of targets such as the reticular formation and the sensory cortex via the crossed ventral trigemino-thalamic tract and contralateral ventral posterior nucleus of the thalamus. Tertiary neurons in the thalamus project through the internal capsule to the lower third of the post central gyrus in the ipsilateral cerebral cortex. Next, the vagus nerve (CN X) innervates the auricular concha which consists mostly of endodermal tissue. The auricular branch of the vagus nerve passes into the jugular fossa and enters the superior vagal ganglion where their nerve cell bodies are located. Central processes from the superior ganglia then pass upwards through the jugular foramen and enter the medulla with the sensory fibers of the meningeal branch. Central processes then descend in the spinal trigeminal tract to synapse in its nucleus. From the nucleus of the spinal tract, second order axon project via the ventral trigemino-thalamic tract to the contralateral ventral posterior nucleus of the thalamus [9]. Thalamic neurons project through the internal capsule to the sensory cortex of the cerebrum. Finally, the lesser occipital nerve (C3) innervates the posterior part of the helix and the great auricular nerve (C2, C3) innervates the auricular lobule both of which are mostly ectodermal in embryological origin. Both send preganglionic sympathetic located in the lateral horn of the spinal cord to enter the superior cervical ganglion which innervates multiple structures such as the internal carotid artery forming the internal carotid plexus. The internal carotid artery then enters the cranium to become part of the formation of the Circle of Willis. These are all sources of extrinsic perivascular innervation that carry sensory, sympathetic, and parasympathetic nerves [8]. The exact mechanism of cerebral auto-regulation is complex but extensive investigation has revealed that many other factors play a role such as the cerebral endothelium and the role of nitric oxide as the endothelium-derived relating factor. Astrocytes also appear to play a significant role in cerebral blood flow regulation as they are in a unique anatomic position with their processes that extensively ensheath brain capillaries, thereby linking the cerebral microvasculature with synapses [8, 9, 24].
7. Conclusions
- Auto-regulation of cerebral blood flow is the ability of the brain to maintain a relatively constant blood flow despite changes in perfusion pressure. Auto-regulation is present in many vascular beds, but it is particularly well developed in the brain. Changes in cerebral blood flow in the arteries comprising the Circle of Willis (PCA, MCA, ACA) as measured by Transcranial Doppler comparing sham versus active NSS © EAD devices on 12 randomly selected, healthy subjects, aged 19-64 years were observed.The results showed a 1-19% increase in mean flow velocity, and a 2-11% decrease in PI and RI with the NSS treatment protocol. We were able demonstrate an increase in cerebral perfusion by decreasing resistance (decrease PI and RI) to outflow, and observed a significant increase in mean flow velocity which would suggest an increase in cerebral perfusion via cerebral micro-circulatory recruitment. Auto-regulation of cerebral blood flow is controlled by a network of multiple regulating mechanisms. The NSS © treatment protocol produced changes in cerebral hemodynamics which due to the device design and anatomical placement can only be a result of direct cranial nerve stimulation.
ACKNOWLEDGEMENTS
- Special thanks to Necla Erdini-Rasor (Ultrasound Technician) and Johnson Memorial Hospital.
Appendices
- Appendix 1Patient Pre-Testing InformationYou are going to be a part of a study that will measure the effects of an FDA cleared device placed on your ear. You will be escorted into a clinical room at Johnson County Hospital and asked to lie down on a clinical table. You will remain fully clothed. You will be asked to lie quietly in this room for 10 minutes by yourself. The technician will leave the room. The technician will be available as needed. You can call her if needed by ringing the provided bell. At the end of 10 minutes the technician will re-enter the room and disinfect the ear with an alcohol pad. The process of placing the device will then begin. You will have a total of two devices placed on your ear for this study one at a time.Each of the devices will be held in place with adhesive tape. You may or may not feel the electrodes being placed. You may or may not feel a slight electrical pulsing. You may or may not feel your ear getting warm. You may or may not feel sleepy or slightly excited. After the first placement you will be asked to rest quietly for 10 minutes in this room by yourself. After the 10-minute rest period the technician will re-enter the room and several measurements will be taken which will require about 10 minutes.After the measurements are taken the device will be removed, you will again be asked to remain resting for 10 minutes while the technician leaves the room. After 10 minutes the technician will come back in and the same procedure will be repeated. After the measurements are taken your ear will be cleaned off, any questions you have will be answered, and you will be dismissed. The total time for this study will be about an hour.Do you have any questions?Appendix 2Subject Home Care InstructionsThe ear used for the study may be red for part of the day. This is normal and should not cause concern.There may or may not be slight bleeding at the electrode implantation site. If there is; clean the ear with alcohol and wash with soapy water. The chance of infection is very slight (<1%) but can occur. If you have any concerns please call the chief investigator, Dr. Art Roberts at 317-xxx-xxxx for instructions.Thank you for volunteering for this important study.
References
| [1] | Roberts A, Brown C, Decrease in VAS Score Following Placement of Percutaneous Peri-auricular Peripheral Nerve Field Stimulators. Clin Med Diag, 2015. 5(2): p. 17-21. |
| [2] | Brown CA, Peri-Auricular Percutaneous Neurovascular Stimulation as a Non-Narcotic Treatment Alternative for Acute and Chronic Pain. Clin Med Diagnostics, 2015. 5(4): p. 70-9. |
| [3] | Roberts AS, Central Sensitization: Clinical Implications for Chronic Head and Neck Pain. Clinical Medicine and Diagnostics: 2011. 1(1): p. 1-7. |
| [4] | Woolf CJ, ed. Central Sensitization. Pain and the Control of Pain: Pain transmission, regulation and management, ed. B. A. 2009, The Biomedical & Life Sciences Collection, Henry Stewart Talks Ltd, London. |
| [5] | Melzack R, Pain and the Neuromatrix in the Brain. Journal of Dental Education, 2001. 65(12): p. 1382-2001. |
| [6] | May RM, O.G., Bifurcations and Dynamic Complexity in Simple Ecological Models. The American Naturalist, 1976. 110(974): p. 573-599. |
| [7] | Brown CA, Peri-Auricular Percutaneous Neurovascular Stimulation as a Non-Narcotic Treatment Alternative for Acute and Chronic Pain. Clinical and Medical Diagnostics, 2015. 5(4): p. 70-9. |
| [8] | Peterson EC, Wang Z, Britz G, Regulation of Cerebral Blood Flow. International Journal of Vascular Medicine, 2011. DOI: http://dx.doi.org/10.1155/2011/823525. |
| [9] | Cipolla MJ. The Cerebral Circulation: From Molecule to Function. Colloquium Series on Integrated Systems Physiology, 2009. 1-59. |
| [10] | Naqvi J, Yap KH, Ahmad G, Transcranial Doppler Ultrasound: A Review of Physical Principles and Major Applications in Critical Care. International Journal of Vascular Medicine., 2013. |
| [11] | Meeus M, Nijs J, Central Sensitization: A Biopsychosocial Explanation for Chronic Widespread Pain in Patients with Fibromyalgia and Chronic Fatigue Syndrome. Clinic Rheum, 2007. 26(4): p. 465-473. |
| [12] | Melzack, R., Pain and the Neuromatrix in the Brain. Journal of Dental Education, 2001. 65(12): p. 1378-82. |
| [13] | Wallace DJ, Clauw DJ, ed. Fibromyalgia and Other Central Pain Syndromes. 2005, Lippincott Williams & Wilkins: Philidelphia. |
| [14] | Aaslid R, Markwalder TM, Nornes H, Noninvasive Transcranial Doppler Uultrasound Recording of Flow Velocity in Basal Cerebral Arteries. Noninvasive Transcranial Doppler Ultrasound Recording of Flow Velocity in Basal Cerebral Arteries, 1982. 57(6): p. 69-74. |
| [15] | Topcuoglu MA, Transcranial Doppler Ultrasound in Neurovascular Diseases: Diagnostic and Therapeutic Aspects. Journal of Neurochemistry, 2012. 2012: p. 39-51. |
| [16] | Schatlo B, P.R, Clinical Applications of Transcranial Doppler Sonography. Reviews Recent Clinical Trials, 2007. 2(1): p. 49-57. |
| [17] | Tsivgoulis G, Alexandrov AV, Advances in Transcranial Doppler Ultrasonography. Current Neurology and Neuroscience Reports, 2009. 9(1): p. 46-54. |
| [18] | Panarai RB, Cerebral Autoregulation: From Models to Clinical Applications. Cardiovascular Engineering, 2008. 8(1): p. 42-59. |
| [19] | Panerai RB, Transcranial Doppler for evaluation of cerebral autoregulation. Clinical Autonomic Research, 2009(2009): p. 197-211. |
| [20] | Panerai RB, Assessment of Cerebral Pressure Autoregulation in Humans: A Review of Measurement Methods. Physiological Measurement, 1998. 19(3): p. 305-38. |
| [21] | Giller CA, A Bedside test for Cerebral Autoregulation Using Transcranial Doppler Ultrasound. Acta Neurochirurgica (Wien), 1991. 108(1-2): p. 7-14. |
| [22] | Paulson OB, Strandgaard S, Edvinsson, Cerebral Autoregulation. Cerebrovascular and Brain Metabolism Reviews, 1990. 2(2): p. 161-92. |
| [23] | Czosnyka M, B.K., Reinhard M, Smielewski P, Steiner LA, Monitoring of Cerebrovascular Autoregulation: Facts, Myths, and Missing Links. Neurocritical Care, 2009. 2009: p. 373-86. |
| [24] | Faraci FM, Breese KR, Nitric Oxide Mediates Vasodilatation in Response to Activation of N-methyl-D-aspartate Receptors in Brain. Circulation Research, 1993. 72(2): p. 476-80. |
| [25] | Peuker ET, Filler TJ, The Nerve Supply of the Human Auricle. Clinical Anatomy, 2002. 15: p. 35-37. |
| [26] | Frangos E, Ellrich J, Komisaruk BR, Non-invasive Access to the Vagus Nerve Central Projections via Electrical Stimulation of the External Ear: fMRI Evidence in Humans. Brain Stimulation, 2015. 8: p. 624-36. |
| [27] | U.S. Food and Drug Administration, What Does it Mean for FDA to "Classify" a Medical Device? U.S. Department of Health and Services.http://www.fda.gov/AboutFDA/Transparency/Basics/ucm194438.htm. 2014, |
| [28] | Chan KH1, Miller JD, Dearden NM, Andrews PJ, Midgley S. The effect of changes in cerebral perfusion pressure upon middle cerebral artery blood flow velocity and jugular bulb venous oxygen saturation after severe brain injury. Journal of Neurosurgery. 1992 Jul;77(1):55-61. |