-
Paper Information
- Paper Submission
-
Journal Information
- About This Journal
- Editorial Board
- Current Issue
- Archive
- Author Guidelines
- Contact Us
Clinical Medicine and Diagnostics
p-ISSN: 2163-1433 e-ISSN: 2163-1441
2015; 5(6): 114-121
doi:10.5923/j.cmd.20150506.02

Circulating Micro RNA-122 in Hepatitis C Virus Infected in Egyptian Group of Patients
 Abstract
 Reference
 Full-Text PDF
 Full-text HTML
Hoda Kholeif1, Abeer Mohamed Aboul Ela2, Dina Badawy1
1Clinical Pathology Department, Faculty of Medicine (for girls), Al-Azhar University, Cairo, Egypt
2Tropical Department, Faculty of Medicine (for girls), Al-Azhar University, Cairo, Egypt
Correspondence to: Hoda Kholeif, Clinical Pathology Department, Faculty of Medicine (for girls), Al-Azhar University, Cairo, Egypt.
| Email: |  |
Copyright © 2015 Scientific & Academic Publishing. All Rights Reserved.
This work is licensed under the Creative Commons Attribution International License (CC BY).
http://creativecommons.org/licenses/by/4.0/

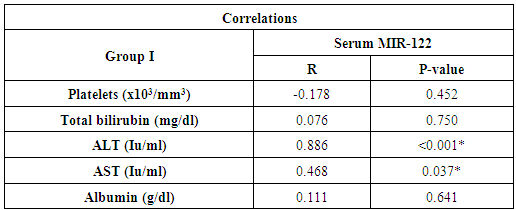
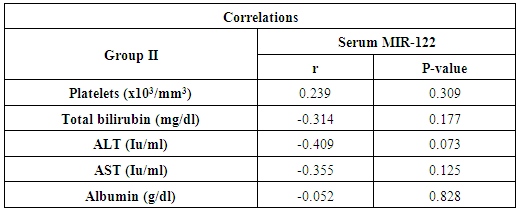
Micro RNA-122, a highly abundant miRNA expressed in the liver, regulates lipid metabolism and acts as a tumor suppressor. Also involved in HCV replication, promotes HCV RNA accumulation by stabilizing the viral genome and stimulating its translation. Furthermore, the miR-122-HCVcomplex protects the HCV genome from degradation and prevents induction of an innate immune response against HCV. Aim of the work: Study miRNA-122 as biomarker of HCV disease progression to open the field for prognostic or therapeutic intervention in HCV associated end stage liver disease. Patients and method: This study was conducted on 50 individuals; they are divided into three groups. The group I included twenty chronic active HCV patients with persistent elevated ALT level for more than 6 months. The group II included twenty chronic de-compensated HCV patients, while the group III included ten healthy individuals as a control group. All patients and control were subjected to clinical examination and laboratory examination which included, marker for HCV, complete blood picture, liver function tests, serum miR-122 expression level by RT-PCR. Results: The interquartile range of serum miR-122 was significantly higher in group I than both groups II and III (control) P-value<0.001. Serum miR-122 expression level showed statistically significant correlation with serum inflammatory markers of the liver alanine transaminase (ALT) and aspartate transaminase (AST) in group I only, P-value <0.001 and 0.037 respectively. Conclusions: The serum level of miR-122 strongly correlates with both serum liver enzymes ALT and AST in patients with HCV infection who did not develop de-compensated liver disease. In patients with persistently normal ALT levels, serum miR-122 did not differ from healthy control.
Keywords: Micro RNA 122, HCV, End stage liver disease, Real time PCR
Cite this paper: Hoda Kholeif, Abeer Mohamed Aboul Ela, Dina Badawy, Circulating Micro RNA-122 in Hepatitis C Virus Infected in Egyptian Group of Patients, Clinical Medicine and Diagnostics, Vol. 5 No. 6, 2015, pp. 114-121. doi: 10.5923/j.cmd.20150506.02.
1. Introduction
- HCV Infection occurs throughout the world. Egypt has a very high prevalence of HCV (14.7%) and a high morbidity and mortality from chronic liver disease, cirrhosis, and hepatocellular carcinoma [1]. Anti-HCV therapy continues to be associated with substantial side effects. In addition, there is the risk of drug interactions mediated by cytochrome P-450 3A, drug resistance, unknown sustainability of response, and reduced efficacy against certain HCV genotypes and subtypes [2].An alternative or complementary approach to treat HCV infection is by targeting host factors that support viral life cycle. Identifying host factors have emerged as a promising alternative since they will have a high barrier for viral resistance and can be broadly effective against all HCV genotypes [3].MicroRNAs (miRNAs) are small, endogenous noncoding RNAs that direct posttranscriptional regulation of gene expression by binding to partially complementary sites within the 3/ untranslated region of target messenger RNAs (mRNAs). This may results in translational repression or mRNA deadenylation and degradation [4]. MicroRNAs have been implicated in the regulation of a wide range of important biologic processes, such as cellular growth and differentiation, developmental timing, and modulation of host response to viral infection [5]. MicroRNA-122 (miR-122) is a highly abundant miRNA expressed in the liver and is essential to the stability and propagation of HCV RNA [6]. MicroRNA-122 binds to two closely spaced target sites (S1 and S2) in the highly conserved 5/ untranslated region of the HCV genome. They are forming an oligomeric miR-122-HCV complex that protects the HCV genome from nucleolytic degradation or from host innate immune responses [7]. A third potential miR-122 binding site in the 3 ∕ untranslated region of the HCV genome does not appear to have any functional relevance [8]. The miR-122 binding sites are conserved across all HCV genotypes and subtypes [9]. MicroRNA-122 could thus be considered as a biomarker of HCV disease progression or host target for antiviral therapy [5].The objective of this research is studying miRNA-122 as a biomarker of HCV disease progression to open the field for prognostic or therapeutic intervention in HCV associated end stage liver disease.
2. Subjects and Methods
- Subjects: This study was conducted on 50 adult persons classified as followsForty subjects were having HCV infection, diagnosed by being anti-HCV positive (by using a third generation chemiluminescence assay VITROS, ortho clinical, diagnostics) and HCV RNA positive by (COBAS Ampliprep/Taqman HCV test,Roche Molecular diagnostic system). Exclusion criteria include coinfection with HBV, autoimmune diseases, hepatocellular carcinoma, other neoplastic diseases, organ transplantation, auto-immune liver diseases. The fifty participants were sub classified as follows:Group I: Twenty patients (12 males and 8 females, age ranged from 23 to 43) with compensated cirrhosis do not have symptoms related to their cirrhosis, but may have asymptomatic esophageal or gastric varices. They are following up in the outpatient tropical clinic at Alzahraa hospital.Group II: TwentyPatients (7 males and 13 females, their age ranged from 39 to 64) with decompensated cirrhosis have symptomatic complications related to cirrhosis, including jaundice, ascites, variceal hemorrhage, or hepatic encephalopathy. They are inpatients in Tropical department in Alzahraa hospital.Group III: Ten sex and age matched apparently healthy individuals 6 males and 4 females, were included as a control group.An informed consent was taken from each patient after explaining the purpose of the study.Specimens: Seven ml of venous blood samples were collected under complete aseptic condition from each subject, divided in two vacutainer tubes. The first tube contained 2 ml anticoagulated blood with disodium EDTA for processing on automated hematology cell counter using sysmex k-21. Five ml of venous blood samples were collected under complete aseptic condition from each subject. EachSample was centrifuged; serum was collected and divided into 2 sterile tubes. One was used for chemical analysis of liver function tests using COBAS ® INTEGRA 400 plus Autoanalyzer (Roche – Germany). The other tube contained serum was stored at -80°C until extraction of micro RNA, reverse transcription and real time polymerase chain reaction were accomplished.Detection of miRNA-122 by real time reverse transcription polymerase chain reaction (RT-PCR) was performed as follows:1- RNA extraction:-RNAs were extracted from serum samples using the miR Neasy Mini Kit (cat.no. 217004) Qiagen according to the manufacturer's instruction. Briefly 100 μL of serum was mixed with 500 μL (5 volumes) Qiazol lysis reagent and incubated for 5 minutes at room temperature. Then 100 μL (1 volume) of chloroform was added and the tube was vortexed vigorously for 15 seconds. After 3 min incubation at room temperature, the tube was centrifuged at 12,000 xg for 15 min, in which the sample separated into 3 phases; an upper colorless aqueous phase which is containing RNA, a white interphase and a lower red organic phase. The upper aqueous phase was transferred into new collection tube and mixed with 1.5 volumes of 100% ethanol. About 700 μL of the sample were pipetted into an RNeasy Mini Spin column in a 2 ml collection tubes and centrifuged at 800 xg «≥ 10,000 rpm» for I5 Sec. at room temperature. Then the flow through was discarded. Specimen was washed three times with buffer through centrifugation at ≥ 8000 xg for 15 sec. Finally RNA was eluted using 50 μL R Nase-free water after centrifugation for 1 min ≥ 8000 xg. The RNA purity was assessed by the RNA concentration and quantified by Nano Drop ND-1000 (Nano drop, United States).2- Reverse transcription:-Extracted RNA was reverse-transcribed into cloned DNA using the miScript II RT Kit (Cat. No 218161) according to the manufacturer’s instruction. The reverse transcription reaction was as follows.miScript reverse transcriptase Mix 2 μL, 10 x miScript Nucleics Mix 2 μL, 5 x miScript Hispec buffer 4 μL, 10 μL RNase-free water, 10 x miScript primer Assay 2 μL which contains miRNA-specific primer. The total volume is 20 μL/reaction. For reverse transcription template RNA was added to each tube containing reverse transcription master mix. After gentle mix and brief centrifugation, incubated for 60 min at 37°C, then incubated for 5 min at 95°C to inactivate miScript reverse transcriptase mix. Proceeded with real time PCR was done as follows:3- RNA quantification:-PCR quantification was performed with PCR (Applied Biosystems; Foster City, CA) using the SYBR Green PCR Master Mix according to the manufacturer’s protocol the primers for micro RNA-122 and housekeeping gene were supplied by Qiagene, Germany Catalogue numbers 3416 and 33712. The housekeeping miRNA SNORD 68 was used as the endogenous control. Fluorescene measurements were made in every cycle. The cycling conditions used were as follows: PCR initial active stepat 95°C for 15 min, then 40 cycles which includes denaturation at 94°C for 15s, annealing at 55°C for 30s then extension at 70°C for 30s. Melting curve analysiswas performed after the thermal profile to ensure specificity in the amplification. Temperature increased very slowly (from 65°C to 95°C) with monitoring of flouresence signal. Calculation of PCR results: The ΔCt was calculated by subtracting the Ct values of miRNA SNORD68 from the Ct values of the target miRNAs. As there is an inverse correlation between ΔCt and miRNA expression level, lower ΔCt values were associated with increased miRNA. The resulting normalized ΔCt values were used in calculating relative expression values by using 2-Δ(Ct), these values are directly related to the miRNA expression levels. The 2-ΔΔ (Ct) method was used to determine relative-quantitative levels of individual miRNAs.StatisticsStatistical analysis of the results was carried using SPSS version 17 software programmeData was presented using the mean, standard deviation, the median , range,Chi-square, Linear Correlation Coefficient, Kruskal-Wallis and Analysis of variance [ANOVA] tests. P
 0.05 is not statistically significant, P
 0.05 is statistically significant, P<0.001 is statistically highly significant.
3. Results
- On studying platelet count and liver function tests among the three studied groups, a highly significant decrease in platelet count was found in group II than both groups I and control (p-value was
 0.001). Also platelet count in group I was lower than the control group with a statistical significant difference between them (p-value was < 0.001). Total bilirubin was higher in group II than both groups I and control with a statistical significant difference between them (P-values were < 0.001 and = 0.001) respectively. Total bilirubin was higher in group I than the control group, but without statistical significant difference (P-value = 0.915).Liver enzyme ALT was higher in Group I than both groups II and III with a statistical significant difference (P-value was < 0. 001). In spite of higher level of ALT in group II than the control group, it wasn’t statistically significant (P-value was 0.501). Also AST level was higher in both groups I and II than control group (group III). The (P-values were 0.003 and 0.004) respectively. Albumin was decreased in both patients groups than control with a statistical significant difference between group II and control (P-value <0.001). While no statistical significant difference was found between group I and control group (P-value 1.000) (table 1).
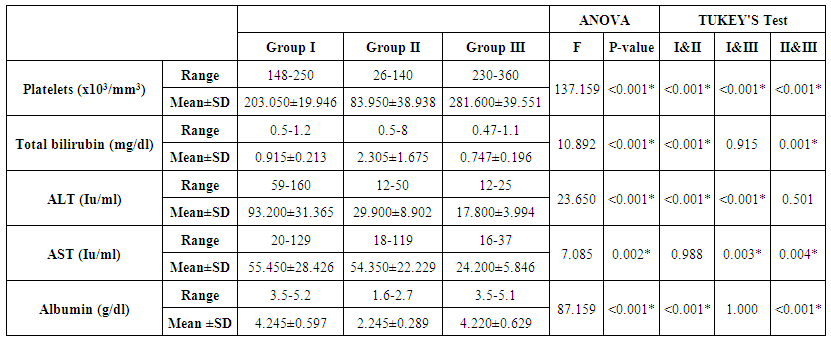 | Table 1. Different parameters of complete blood count and liver function tests |
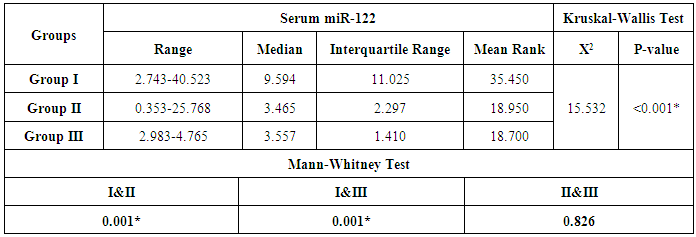
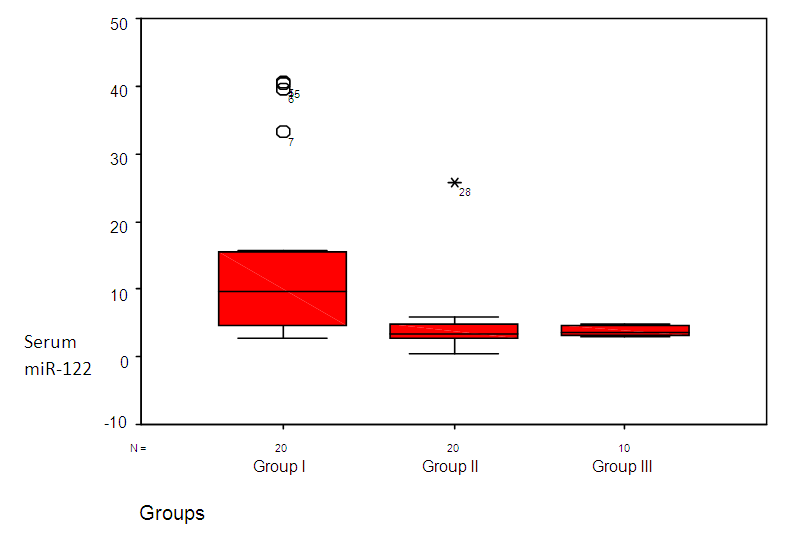 | Figure 1. Serum level of miR-122 in all studied groups |
|
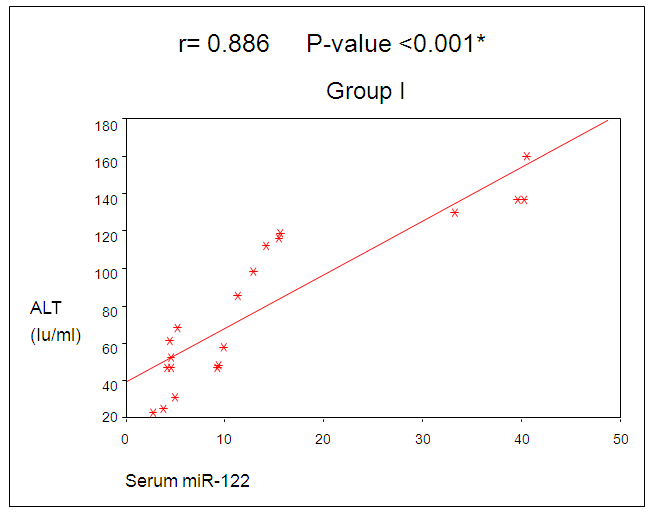 | Figure 2. Correlation between miR-122 and ALT in group I |
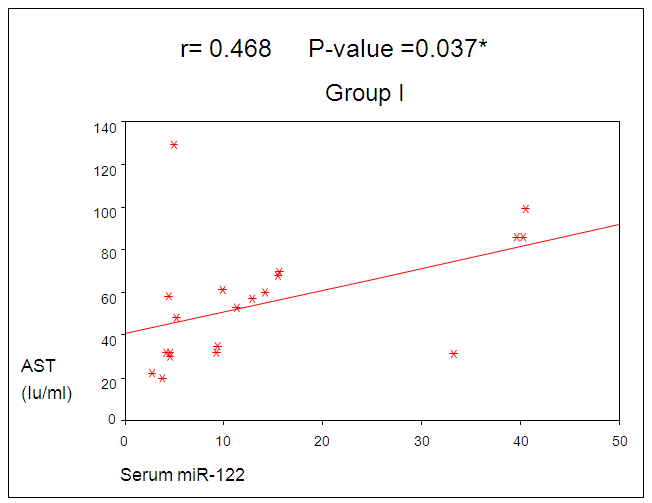 | Figure 3. Correlation between miR-122 and AST in group I |
|
|
4. Discussion
- The majority of persons who develop acute hepatitis C are unaware of this fact, so that disease onset is rarely identified other than through assumption, based on the potential circumstance of exposure. Progression from acute to chronic hepatitis traditionally is defined as persistence of increased levels of the aminotransferases for 6 months or more but more appropriately now by the persistence of HCV in the blood beyond that time period; failure of the virus to clear occurs in 54% to 86% of cases of acute hepatitis C [10].Transition from acute to chronic hepatitis almost always occurs in the absence of symptoms. Thereafter, the chronic phase that evolves lasts many decades, culminating eventually, in some infected individuals, in the development of overt end-stage liver disease, or persisting until death ensues from another cause. Evolution to cirrhosis itself also generally occurs without symptoms, and the presence of cirrhosis may remain unrecognized until the liver becomes sufficiently compromised to advance to overt hepatic decompensation. Decompensation may occur soon or, more usually, several years after cirrhosis is recognized [11].The features of decompensated cirrhosis include the development of ascites, upper gastrointestinal bleeding secondary to varices or portal hypertensive gastropathy, hepatorenal syndrome and hepatic encephalopathy [12]. In the current study liver enzyme ALT was significantly higher in patients with compensated cirrhosis (group I) than patients with decompensated cirrhosis (group II) or control. While AST was higher in both groups I and II than the control group, but the difference between group I and II was statistically insignificant. These results were in agreement with Ozer et al, 2008 [13] who noted that both ALT and AST biomarkers do not always correlate with data in clinical application. In addition Puoti et al, 2010 [14] noted that approximately 20-30% of patients with chronic hepatitis C show persistently normal levels of serum ALT. Puoti et al, 2010 [14] added that the disease activity in these patients cannot be monitored by measuring serum ALT levels. Currently, the enzymatic activities of alanine aminotransferase (ALT) and aspartate aminotransferase (AST) in blood are the most widely used biochemical markers for hepatocellular damage; however, serum ALT and AST activities are known to be increased in some other clinical disorders such as ischaemic, toxic liver injury or autoimmune hepatitis beside viral liver diseases [15]. Studies have attempted to identify a more specific and reliable marker of liver injury to supplement the information provided by ALT or AST activity [16].Su et al, 2013 [17] noted that MicroRNA-122 (miR-122) facilitates hepatitis C replication in vitro. Serum miR-122 has been implicated as a biomarker for various liver diseases; however its role in chronic hepatitis C remains unclear.Previous finding in mice after acute intoxication revealed that miR-122 increased markedly in the serum sample before liver transaminases were raised [18, 19]. Consequently, early increased levels of serum miR-122 in response to inflammatory stimuli has to be considered as better indicators of liver failure than determination of liver specific enzymes such as ALT [20].We measured MicroRNA-122 in serum using real time PCR technique. The housekeeping microRNA SNORD68 was used as an endogenous control.Elfimova et al, 2012 [21] noted that different methods are used to identify the pattern of miRNA in serum. Due to the very high sensitivity required for detection of circulating miRNA, Real time PCR approaches are mostly carried out for screening as well as for validation of miRNA levels.In addition, the accuracy of extra cellular miRNA quantification highly depends on normalization using an appropriate reference RNA. In this study, we used SNORD68 as RNA reference. Xu et al [22] identified an increased level of circulating miR-122 as a putative marker of chronic HBV infection after normalization to endogenous miR-181 values, on the other hand other researchers, observed decreasing levels of miR-122 after normalization using SnU6-RNA [22, 23]. Further more, Ding et al 2012 [24] found that SnU6-RNA is decreased after hepato-carcinogenesis. Hence an internal standard for miRNA quantification is missing so far. Though miRNA are very stable molecules in serum, for better comparability and reproducibility, a well standardized protocol is needed in order to evaluate miRNAs as biomarkers for acute hepatitis. However, high variance and conflicting data exist about miRNA incidence in the blood stream upon different liver diseases [25].In this study, the inter quartile range of serum MicroRNA-122 was higher in group I than both groups II and III with statistical significance difference between them. These results are in agreement with other researchers who found that elevated serum miR-122 level is a sensitive marker for inflammatory activity in the liver and that serum and hepatic miR-122 levels decreased significantly if the stage of liver fibrosis progressed [26, 27].In addition, El-Garem et al, 2014 [28] found that analysis of fold changes expression level of miR-122 displayed significant fold increase in expression level in chronic hepatitis C group and significant fold decrease in expression in cirrhotic patients in comparison to normal controls.Trebicka et al, 2013 [27] explained the low level of MicroRNA-122 in decompensated liver cirrhosis by noting that MicroRNA 122 is present abundantly in hepatocytes with much lower levels in circulation in healthy subjects. With hepatocyte injury miR-122 is released in circulation more readily and serum level rise. With eventual loss of hepatocytes and development of fibrosis with proliferation of mylofibroblasts and accumulation of extracellular matrix, the circulating miR-122 levels drop again.In the current study, a positive significant correlation was found between serum miR-122 and serum levels of ALT and AST in group I. These results are in agreement withBihrer et al, 2011and Vander Meer et al, 2013 [29, 30] who found that, the level of serum miR-122 strongly correlates with serum ALT activity in patients with chronic hepatitis C virus infection. Thus the miR-122 serum level might be a useful parameter to specifically monitor ongoing damage of hepatocytes irrespective of the stage of chronic hepatitis.Also El-Garem et al, 2014 [28] found that, in the chronic hepatitis group of patients serum miR-122 was significantly correlated with higher AST and ALT levels. In the current study, no significant correlation was found between serum miR-122 level and serum albumin, serum bilirubin, platelet count in both groups I and II. These finding suggest that, serum miR-122 level did not reflect overall liver function.These results were in agreement with El-Garem et al, 2014 and Ezzat et al, 2014 [28, 31]. Both studies found that no statistical significant correlation could be verified between serum miR-122 expression level and liver synthetic function tests (albumin, bilirubin and platelet count) in chronic hepatitis patients.Clinical proof-of-concept studies have demonstrated that miR-122 inhibitors efficiently reduced viral load in chronically infected HCV patients without detectable resistance. But in light of very high cure rates of orally administered direct-acting antiviral drugs (DAAs) and a potential liver disease promoting effect of miRNA depletion, the role of miR-122 in future treatment approaches for HCV infection remains to be determined [32].In conclusion, we report that increased concentration of miR-122 is found in the serum of patients infected with HCV before developing decompensated chronic liver disease.Further studies should be carried out to aid in the development of a new strategy to prevent the chronicity of HCV infection and the development of hepatocellular carcinoma that may improve the quality of clinical prevention and treatment.