-
Paper Information
- Next Paper
- Previous Paper
- Paper Submission
-
Journal Information
- About This Journal
- Editorial Board
- Current Issue
- Archive
- Author Guidelines
- Contact Us
Clinical Medicine and Diagnostics
p-ISSN: 2163-1433 e-ISSN: 2163-1441
2012; 2(3): 9-13
doi: 10.5923/j.cmd.20120203.03
Cardiac Syndrome X Electrocardiographic Patterns Using Signal-Averaged Orthogonal Leads and VCG Indices
 Abstract
 Reference
 Full-Text PDF
 Full-Text HTML
Mikhail Matveev 1, Vessela Krasteva 1, Svetlin Tsonev 2, Rada Prokopova 3, Maria Milanova 4
1Institute of Biophysics and Biomedical Engineering, Bulgarian Academy of Sciences, Sofia, 1113, Bulgaria
2Medical University, Sofia 1000, Bulgaria
3St.Anne University Multiprofile Hospital, Sofia, 1113, Bulgaria
4University Hospital of Emergency Medicine, Sofia, Bulgaria
Correspondence to: Mikhail Matveev , Institute of Biophysics and Biomedical Engineering, Bulgarian Academy of Sciences, Sofia, 1113, Bulgaria.
| Email: |  |
Copyright © 2012 Scientific & Academic Publishing. All Rights Reserved.
Cardiac syndrome X (CSX) is a clinical condition, characterized by angina, positive stress test and negative coronary angiography. Myocardial ischemia is suggested to influence the ischemic changes in the electrocardiogram (ECG), observed during stress test. The aim of this study, is to obtain CSX patterns of the high-resolution vectorcardiographic (VCG) loops in the horizontal (H), frontal (F) and right sagittal (RS) planes of the Frank corrected orthogonal leads (X,Y, Z), and to assess their similarity with the reference VCG loops of normal subjects. The results suggest that CSX VCG profile in resting state could be considered as a variant of the normal profile; however, it contains some VCG changes seen in the ischemic heart disease.
Keywords: Cardiac Syndrome X, Signal-Averaged VCG, Frank Corrected Orthogonal Leads X, Y, Z
1. Introduction
- The signal-averaged VCG is an informative electrophys- iological method for assessment of the myocardial condition and for classification of an individual VCG patient profile, either to a population of normal subjects, or to a particular cardiac pathology. Analysis of the high-resolution vectorcardiogram (VCG) enables detection of electrical activity of individual and/or typical for patient group fragments of the cardiac muscle that presents a possibility for developing a qualitatively new diagnostic method. Comparing VCG to the standard electrocardiogram (ECG), the former shows the advantage of having better sensitivity for analysis of the repolarization process and myocardial ischemia[1,2].The concept of cardiac syndrome X (CSX) includes patients, mainly women before or in the period of menopause, fulfilling the following three major criteria: chest pain, positive exercise-strain test, normal coronary angiogram[3-6]. The chest pain is a leading symptom of these patients, usually stronger and more prolonged than the typical angina pectoris, which is also more difficult to control by the standard antiischemic therapy[3, 6]. Impaired functional cardio- vascular capacity is common for these patients. As a result, they are often re-hospitalised, new unnecessary angiograms are done and the quality of life of these patients deteriorates[4, 5, 8].Investigations on the prognosis of these patients, indicate that their life-expectancy does not differ considerably from the rest of the population, excluding those with rhythm and conductance disorders like left-bundle branch blocks, as such patients are likely to develop dilated cardiomyopathy (NLHBI WISE study with mean duration of follow-up for 5.2 years)[9].In a series of studies[3, 7], the authors focus on the fact that the morbidity of patients with CSX is high with continuing episodes of chest pain and frequent hospital readmissions. Management of this syndrome represents a major challenge for the treating physician. Conventional therapies with antianginal agents have been tried, with variable success. However, this might be related to a failure to target the underlying pathophysiology and more effective therapies are needed. On the other hand, every diagnostic procedure, assisting the differentiation between patients with CSX and IHD, would facilitate the application of effective therapies. In our previous studies[10,11], we have demonstrated that the circadian profile of the autonomic cardiac control in patients with CSX, is similar to the profile of healthy persons, but is different from the profiles of different patient groups with CAD. Since with CSX patients the stress test will show changes on the electrocardiogram that are strongly suggestive of ischemia, the aim of this study is to obtain CSX patterns of the VCG loops in the horizontal, frontal and right saggital planes of the Frank corrected orthogonal leads (X, Y, Z)[2] in resting state and to assess their similarity with the reference VCG loops of normal subjects.
2. Materials and Methods
- The study involved 56 high-resolution ECG recordings (1kHz) at rest, collected from 28 women (mean age 55.3±9.5 years) using a 12-channel ECG data acquisition system, developed by us[12], at the Clinic of Cardiology, Medical University, Sofia, and at the Clinic of Cardiology, University Hospital of Emergency Medicine, Sofia, Bulgaria. All patients had fulfilled the criteria for CSX during the period of pre- or postmenopause and with "clear" coronary arteries, verified by angiography or multi-slice computed tomography. Stratification by risk factors, co-morbidity and pharmacological management was performed, using a standardized protocol.The study was based on assessment of the high-resolution Frank corrected orthogonal leads (X,Y, Z), synthesized from the 12-standard ECG leads by applying the transformations (1)[13]:
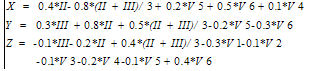 | (1) |
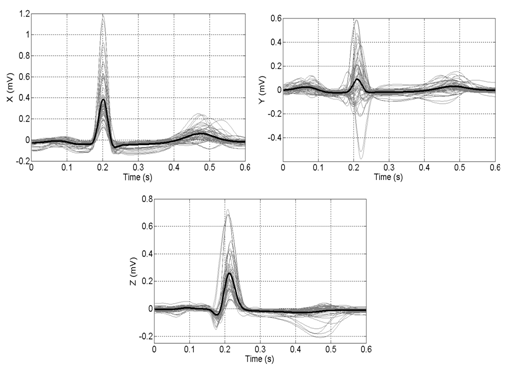 | Figure 1. Profiles of the orthogonal X, Y and Z leads in women with CSX. The averaged P-QRS-T pattern (black curve) is obtained from all 56 individual recordings (grey curves) |
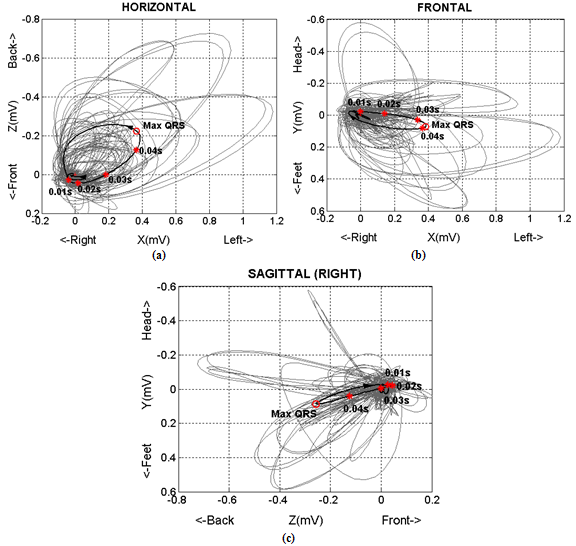 | Figure 2. Spatial VCG loop projections in H, F, RS planes of women with CSX. The averaged loops (black curves) are obtained from all 56 individual recordings (grey curves). The instant vectors (‘*’ marks) and max QRS vectors (‘o’ marks) are depicted above the mean loops |
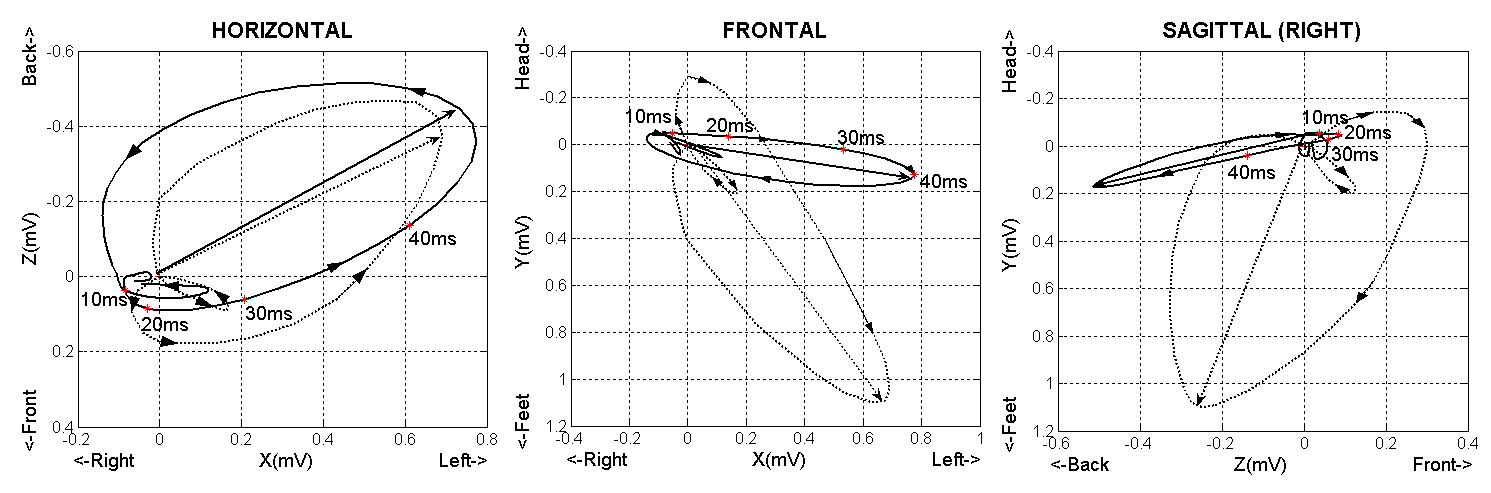 | Figure 3. The averaged projections of spatial VCG loop in H, F, RS planes in women with CSX (solid line) and in healthy persons (dotted line) |
3. Results and Discussion
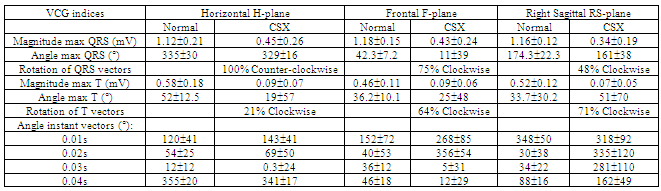
- The data from all 56 recordings of women in CSX are summarized above, including the P-QRS-T patterns in the orthogonal leads (Figure 1), the spatial VCG loops (Figure 2 and Figure 3) and the basic measurements from the VCG profile compared to the reference norm (Table 1).In CSX, we observe that the horizontal projection of the averaged QRS-loop (Figure 2a) conforms to the common characteristics of the normal VCG: - Counter-clockwise rotation, which is observed in all individual loops participating in the averaging (100%); - The length of the loop exceeds its width with about 1.5 to 3 times;- The maximal vector is directed toward the left posterior quadrant (329±16);- The apical (0.02s) vector, which has important diagnostic significance, is directed towards the left anterior quadrant (69±50); - The maximal magnitude of the QRS vector is observed at about 0.03-0.04s.However, the mean magnitude of the maximalQRS-vector in CSX (0.45mV) appears to be below the mean value of the normal subjects, and even below the lower limit of the norms in women (0.8mV). In addition, the horizontal projection of the averaged T-loop in CSX appears with highly extended elliptical form and maximal vector directed anteriorly to the left (19±57) – characteristics, which concord to the norm. However, the mean magnitude of the maximal T-vectror (0.09mV) is below the mean value in normal subjects and even below the lower limit of the norms in women (about 0.1mV).In the frontal F-plane, the projection of the averaged QRS-loop in CSX (Figure 2b) appears with the following characteristics: - The contour is extended, relatively narrow, with initial part directed superiorly to the right, and the main parts of both afferent and efferent limbs directed toward the left inferior quadrant; - The rotation of the individual QRS vectors is mainly clockwise (75%), although most of the observed QRS-loops are shifted horizontally, compared to the normal position;- The instant 0.02s vector is directed toward superior left quadrant (356), which is observed in about 30% of the normal subjects, however, the instant 0.03s and 0.04s vectors are directed toward the left inferior quadrant (5 and 12, respectively), which is also typical for the norm. In CSX, the averaged T-loop in the frontal F-plane appears mainly in the inferior left quadrant, being more extended and narrower than the T-loops in the other projections. The rotation of the individual T-loops is more often (64%) in clockwise direction, typical for the norm, and it follows the rotation of the QRS-loop. The mean magnitude of the averaged maximal T-vector is below the mean amplitude of the norm, such as the measurements in the horizontal plane. In the right sagittal RS-plane (Figure 2c), we observe specific characteristics of the averaged QRS-loop in CSX: - The contour is smoothed, with elliptical form and slight curvature; - The rotation of the averaged QRS-loop is clockwise, although the rotations of the individual QRS-loops are almost equally likely to appear in clockwise (48%) or counter-clockwise (52%) direction. This specific feature, observed for CSX (the QRS-loops in normal subjects typically follow clockwise direction), is reflected in the values of some instant vectors; - The maximal QRS vector is directed toward the posterior-inferior quadrant (161), however, the apical (0.02s) vector has anterior-superior direction (335), the 0.03s vector has superior direction (281), and just 0.04s vector is slightly shifted toward inferior direction (162). Specific features are found also in the RS-plane projection of the averaged T-loop in CSX. The position of the T-loop is in the anterior-inferior quadrant with rotation of the maximal T-vector (51±70) closely distributed to the typical orientation in normal subjects. In contrast to the specific normal form of the T-loop, which is typically more extended and narrower than the one in the horizontal plane, the averaged T-loop in CSX appears with rounded form and suppressed magnitude of the maximal T-vector (0.07mV).
4. Conclusions
- The performed analysis indicates that thevectorcardiographic profile at rest of CSX has characteristics, which in their predominant part could be interpreted as a variant of the normal vectorcardiographic profile. However, some features, mainly related to the T-loops, refer to some details in the VCG profile which are specific for the ventricular repolarization in myocardial ischemia. These deviations from the norm are seen in different combinations – shifting of the direction, rotation and form, or normal direction with pathological rotation and form of the vectorcardiographic images. The specific peculiarity of the patterns received, characterizing the electrocardiographic profile of CSX patients, can be of assistance to the clinical management of such patients.
References
| [1] | High Resolution Vectorcardiogram in Diagnosis and Therapy of Cardiac Muscle Ischaemia, 2001, Online Available: http://www.staff.amu.edu.pl/~rku/vector.html. |
| [2] | Gannedahl P, Ljungqvist O, Lundin P, Edner M, “Comparison of electrocardiograms recorded with standard leads and derived from the vectorcardiographic Frank leads in high-risk patients”, Intensive Care Med, vol.23, pp.1049-55, 1997. |
| [3] | Kaski JC and Iqbal K, “Cardiac syndrome X: pathogenesis and management”, Heart Metab, vol.40, pp. 30-5, 2008. |
| [4] | Lamendola P, Lanza GA, Spinelli A, Sgueglia GA, Di Monaco A, Barone L, Sestito A, Crea F, “Long-term prognosis of patients with cardiac syndrome X”, Int J Cardiol, vol.140(2), pp. 197-9, 2010. |
| [5] | Vermeltfoort I, Teule G, van Dijk A, Muntinda H, Raijmakers P, “Long-term prognosis of patients with cardiac syndrome X: a review”, Neth Heart J, Feb 23, 2012[Epub ahead of print]. |
| [6] | Paoletti R, Wenger NK, “Review of the international position on women’s health and menopause, a comprehensive approach”, Circulation, vol.107, pp. 1336-9, 2003. |
| [7] | Lim T, Choy A-M, Khan F, Belch J, Struthers A, Lang C, “Therapeutic Development in Cardiac Syndrome X: A Need to Target the Underlyng Pathophysiology”, Cardiovascular Therapeutics, vol.27, issue 1, pp. 49-58, 2009. |
| [8] | Atienza F, Velasco JA, Brown S, Ridocci F, Kaski JC, “Assessment of quality of life in patients with chest pain and normal coronary arteriograms (syndrome X) using a specific questionnaire”, Clin Cardiol, vol.22, pp.283-90, 1999. |
| [9] | Gulati M, Cooper-DeHoff RM, McClure C, Johnson BD, Shaw L, et al., “Adverse cardiovascular outcomes in women with nonobstructive coronary artery disease: a report from the Women's Ischemia Syndrome Evaluation Study and the St James Women Take Heart Project”, Arch Intern Med, vol.169, no.9, pp.843-50, 2009. |
| [10] | Matveev M, Prokopova R, “Prognostic Value of the Time Related Autonomic Balance Indicator for Risk Evaluation of Cardiovascular Events in Patients with Ischemic Heart Disease”, Comp in Cardiol, vol.35, pp. 201-4, 2008. |
| [11] | Matveev M, Tsonev S, Prokopova R, Donova T, “Assessment of Autonomic Cardiac Control in Women with Cardiac Syndrome X using Time Related Autonomic Balance Indicator”, Comp in Cardiol, vol.37, pp. 1047-50, 2010. |
| [12] | Iliev I, Tsvetanov D, Matveev M, Naidenov S, Krasteva V, Mudrov N, “Implementation of high resolution wireless ECG data acquisition system in intensive coronary care unit”, Conf Proc Advanced Information and Telemedicine Technologies for Health, AITTH’2005, vol.1, pp.79-84, 2005. |
| [13] | Levkov Ch, “Orthogonal electrocardiogram derived from the limb and chest electrodes of the conventional 12-lead system”, Med Biol Eng Comput, vol.25, pp. 155-64, 1987. |
| [14] | Frank E, “An accurate, clinically practical system for spatial vectorcardiography”, Circulation, vol.13, pp. 737-49, 1956. |