International Journal of Composite Materials

p-ISSN: 2166-479X    e-ISSN: 2166-4919

2026;  16(1): 20-32

doi:10.5923/j.cmaterials.20261601.02

Received: Sep. 21; Accepted: Oct. 6, 2026; Published: Oct. 9, 2026

 

Synthesis, Characterization and Evaluation of a Fish-Scale-Derived Chitosan–Silica Composite for Adsorption of Congo Red Dye from Aqueous Media

Daniel Wafula Kisauli, Francis Maingi, Linda Ouma

Department of Science, Technology, and Engineering, Kibabii University, Kenya

Correspondence to: Daniel Wafula Kisauli, Department of Science, Technology, and Engineering, Kibabii University, Kenya.

Email:

Copyright © 2026 The Author(s). Published by Scientific & Academic Publishing.

This work is licensed under the Creative Commons Attribution International License (CC BY).
http://creativecommons.org/licenses/by/4.0/

Abstract

Dye effluents have contributed to the pollution of water bodies, posing a serious ecological and public health threat. In this study, a chitosan–silica composite was synthesized from fish scales and rice husk ash, characterized, and evaluated as a potential adsorbent for the removal of Congo Red dye from aqueous media. The chitosan and sodium silicate were cross-linked through sol-gel encapsulation to form the chitosan–silica composite, which was characterized using X-ray Diffraction (XRD), Raman spectroscopy, X-ray Fluorescence (XRF), and FT-IR spectroscopy. All these techniques confirmed the successful linking of silica onto the chitosan matrix. This inorganic support provided an additional binding site for the adsorbent as well as increased the mechanical stability of the composite compared to standalone chitosan. The effects of solution pH, adsorbent dosage, contact time, and initial dye concentration on the removal of Congo red were investigated through batch adsorption experiments. The optimal conditions for the removal of Congo red dye using the composite were: a pH of 2, an adsorbent dose of 0.4 g, a contact time of 120 minutes and an initial dye concentration of 50 mg/L. The Langmuir isotherm model provided the best fit to the equilibrium adsorption data (R² = 0.804), giving a maximum monolayer adsorption capacity (Qₘ) of 7.746 mg/g and a Langmuir constant (Kʟ) of 0.085 L/mg, indicating that Congo red adsorption onto the composite occurred predominantly as a monolayer on relatively homogeneous, protonated-amine binding sites. This study confirms the potential of rice husk- and fish-scale-derived chitosan–silica composites as potential adsorbents for Congo red removal from dye-polluted wastewater.

Keywords: Adsorption, Characterization, Chitosan–Silica Composite, Congo red, Fish scales, Synthesis

Cite this paper: Daniel Wafula Kisauli, Francis Maingi, Linda Ouma, Synthesis, Characterization and Evaluation of a Fish-Scale-Derived Chitosan–Silica Composite for Adsorption of Congo Red Dye from Aqueous Media, International Journal of Composite Materials, Vol. 16 No. 1, 2026, pp. 20-32. doi: 10.5923/j.cmaterials.20261601.02.

Article Outline

1. Introduction
2. Materials and Methods
    2.1. Chemicals and Reagents
    2.2. Extraction of Chitosan from Fish Scale Waste
    2.3. Extraction of Silica from Rice Husk Ash
    2.4. Preparation of Sodium Silicate
    2.5. Characterization Techniques
        2.5.1. X-ray Fluorescence (XRF) Spectroscopy
        2.5.2. X-ray Diffraction (XRD)
        2.5.3. Raman Spectroscopy
        2.5.4. Fourier-Transform Infrared (FT-IR) Spectroscopy
        2.5.5. Acidic-Media Stability and Mass Retention Test
    2.6. Batch Adsorption Studies
        2.6.1. Effect of Solution pH
        2.6.2. Effect of Adsorbent Dosage
        2.6.3. Effect of Contact Time
        2.6.4. Effect of Initial Dye Concentration
    2.7. Adsorption Isotherms
3. Results and Discussion
    3.1. X-ray Fluorescence (XRF) Analysis
    3.2. X-ray Diffraction (XRD) Analysis
    3.3. Raman Spectroscopic Analysis
    3.4. FT-IR Characterization
    3.5. Effect of Solution pH on Congo Red Adsorption
    3.6. Effect of Adsorbent Dosage on Congo Red Adsorption
    3.7. Effect of Contact Time on Congo Red Adsorption
    3.8. Effect of Initial Dye Concentration on Congo Red Adsorption
    3.9. Adsorption Isotherm Analysis
    3.10. Effect of Acidic Conditions on Mass Stability
    3.11. Comparison: Chitosan versus Chitosan–Silica Composite
    3.12. Limitations of the Study
4. Conclusions
CONFLICT OF INTEREST
ACKNOWLEDGEMENTS

1. Introduction

Textile industrial operations produce dye effluents in water systems. These dyes are mostly non-biodegradable, and they resist photodegradation [1], [2]. These dyes introduce carcinogens and mutagens into the aquatic environment, thereby disrupting aquatic ecosystems and posing public health problems [3]. The existing methods of treating wastewater are limited by susceptibility to fouling, high costs, poor removal efficiency against soluble, low-molecular-weight dye species, and generation of harmful secondary by-products [4], [5]. Adsorption therefore comes in as an optimistic alternative due to its high capacity for dye removal and cost effectiveness [6], [7]. However, a lot of the existing conventional adsorbents are expensive and difficult to source in large scale amounts. This situation creates the need for a low-cost and sustainable alternative. This study focused on converting the by-products of agricultural fisheries into a chitosan-based adsorbent while capitalizing on rice husk ash for the generation of silica to anchor the adsorbent [4]. Tilapia fish scales are a rich source of chitin, which can be converted into chitosan. Chitosan as a standalone can be used as an adsorbent but has limited mechanical strength, poor thermal stability and a tendency to dissolve in acidic media which affects its reuse and efficiency [8], [9]. To overcome these limitations, this study anchors silica on the matrix of chitosan to make it mechanically stronger and increase its reusability. Silica also provides an extra binding site for cationic dyes. As a sustainable source of silica, this study uses rice husk ash, an abundant agricultural residue from rice milling, which is similarly under-utilized despite being a low-cost, high-purity source of silica [10], [11]. Incorporating silica into chitosan through sol-gel encapsulation addresses chitosan's structural limitations by improving mechanical rigidity, and stability, while retaining chitosan's dye-binding functional groups [12], [13], [14]. Combining these two waste-derived materials therefore offers a sustainable, low-cost route to a composite adsorbent that simultaneously valorizes fisheries and agricultural waste streams [15], [7].

2. Materials and Methods

2.1. Chemicals and Reagents

Tilapia fish scales were used as a source of chitosan, while the rice husk ash was used as a source of silica. NaOH was used to prepare sodium silicate and in pH adjustment during batch studies. HCl was used in the pH adjustment of batch studies. The pH of the gelling mixture was adjusted using acetic acid. 50% ethanol was used to wash the gel to minimize shrinkage during drying. Congo red was used to prepare synthetic wastewater. All these reagents were of analytical grade and used without further purification.

2.2. Extraction of Chitosan from Fish Scale Waste

The chitosan extraction process was adopted from Rinaudo [16], which included pretreatment, demineralization, deproteinization, deacetylation, and purification. Running tap water was used to wash the fish scales in the pretreatment stage to remove earthy materials and then dried in a hot-air oven at 60°C for 24 hours. The dried fish scales were then treated with 1.0M HCl at room temperature for 6 hours to remove mineral deposits present in the scales, which include calcium, among others [17]. The demineralized scales were washed with distilled water to remove the excess HCl. The samples were added to a solution of 1.0M NaOH and the mixture kept in an oven at 80°C for 2 hours to deproteinize by hydrolyzing and removing residual proteins to form chitin. The chitin was later treated using a solution of 1.25M NaOH at 80°C for 2 hours in an oven to form chitosan [18]. The chitosan obtained was then washed with distilled water and oven dried at 60°C for 3 hours. Figure 1 shows the chitosan powder obtained at the end of this extraction process.
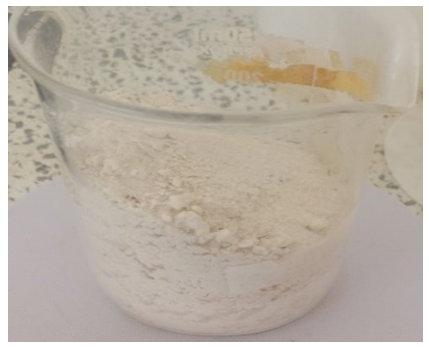
Figure 1. Chitosan powder obtained after deacetylation and drying.

2.3. Extraction of Silica from Rice Husk Ash

The extraction procedure was adopted from [19]. The rice husks were taken to the kiln and calcinated at a temperature of 600°C for 4 hours. The hot ash was allowed to cool for 1 hour, then weighed and used as the silica precursor in the preparation of sodium silicate. Figure 2 shows the rice husk ash obtained after calcination.
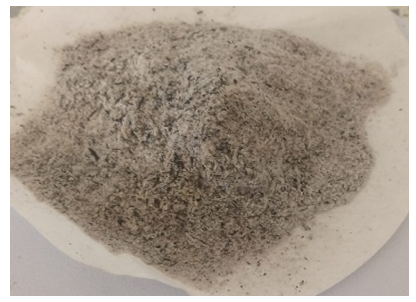
Figure 2. Rice husk ash obtained after calcination at 600°C

2.4. Preparation of Sodium Silicate

30 g of the rice husk ash was mixed with 240 mL of a solution of 2M NaOH. The mixture was then heated at 75°C while stirring for 2 hours [20]. Later, the mixture was allowed to cool and then filtered to obtain sodium silicate filtrate, leaving behind a carbon-rich residue. Equation 1 shows the reaction involved [11], [10].

(1)
A mixture of chitosan powder and 2% acetic acid was made in the ratio of 1 g: 50 mL at room temperature and placed in a 200 mL Erlenmeyer flask. The mixture was stirred using a magnetic stirrer for 120 minutes. The 240 mL of sodium silicate was then added to the chitosan and stirring continued until the chitosan-silica gel was formed. The gel was thereafter treated with 5% acetic acid dropwise until a pH of 4.5 was attained. The general reaction is represented in Equation 2 [9], [21].
(2)
The chitosan-silica gel was placed in an oven at 26°C for 60 minutes to allow aging that helps in condensation of the silanol groups (Si–OH) to siloxane (Si–O–Si) linkages, resulting in a 3-D skeletal structure composite as shown in Equation 3 [21].
(3)
Thereafter, the gel was washed with distilled water to neutral pH. A final wash with 50% ethanol was done on the gel to minimize shrinkage during drying. The gel was oven-dried at 60°C for 12 hours to obtain a white chitosan–silica composite sample.

2.5. Characterization Techniques

The chitosan–silica composite was characterized by X-ray fluorescence (XRF), X-ray diffraction (XRD), Raman spectroscopy, and Fourier-transform infrared (FT-IR) spectroscopy. All these techniques were combined in the study to determine the functional groups and the elemental and structural composition of the composite as well as to understand the mechanisms by which it can retain the dye.
2.5.1. X-ray Fluorescence (XRF) Spectroscopy
XRF spectrometry (Bruker 5117) was used to determine the elemental composition of the composite. About 1.0 g of the dried sample was put in the XRF cuvette and spread out to a flat even surface to minimize measurement error and pressed into a 40 mm diameter pellet at a hydraulic pressure of 10 tons. The sample was then treated with high-energy X-rays and the emitted fluorescent X-rays were measured and analyzed to identify and determine the amounts of the elements and oxides present.
2.5.2. X-ray Diffraction (XRD)
To confirm the presence of the main constituents of the composite and to verify their crystalline or amorphous nature, the crystallographic structure of the composite was investigated. 1.0 g sample was smoothed to a flat surface on the sample holder to reduce the errors due to scattering and to improve the diffraction pattern. Diffraction patterns were obtained on the Cu Kα radiation (λ = 1.5406 Å) at 40 kV and 40 mA over a range of 2θ between 5° and 80°. The diffraction patterns obtained were compared to a collection of reference patterns available from the International Centre for Diffraction Data (ICDD) to determine the crystalline and amorphous phases.
2.5.3. Raman Spectroscopy
About 0.5 g of the composite was transferred directly to a glass slide and spread uniformly and mounted inside the Raman spectrometer. The spectral range was 100–4000 cm⁻¹ and the spectral resolution was 2 cm⁻¹, and each spectrum was an average of three 30-s accumulations to provide good signal to noise. Band assignment was assigned by using the previously set reference values [22], [23].
2.5.4. Fourier-Transform Infrared (FT-IR) Spectroscopy
1.0 g of powdered composite sample was ground into finely ground KBr and then pressed into a 7 mm pellet for analysis to reveal the functional groups from 4000–400 cm⁻¹. The spectra were taken between 900 and 4000 cm⁻¹ with a spectral resolution of 4 cm⁻¹, 25 scans were added per spectrum and the spectra were taken in the %T mode with a Happ–Genzel apodization function. A background spectrum was recorded before analyzing the sample and automatically subtracted to reduce atmospheric and instrumental interference. The measurements were repeated three times and reproducibility was calculated.
2.5.5. Acidic-Media Stability and Mass Retention Test
2.00 g of extracted chitosan and 2.00 g of the synthesized chitosan–silica composite were separately weighed and placed in separate 100 mL beakers. Each sample was immersed in 50 mL of 0.1% (v/v) acetic acid solution adjusted to pH 2.0 ± 0.1 and maintained at a temperature of 26°C for a period of 24 hours without agitation. [40]
After 24 h, the samples were recovered through filtration, gently rinsed with distilled water, and dried at 60 °C to constant mass. The final dry mass was recorded, and the experiment was performed in triplicate. Mass retention and mass loss were calculated using Equations (4) and (5) below:

(4)
(5)
where (Wi) is the initial dry mass and (Wf) is the final dry mass after acidic treatment, washing, and drying. [24]

2.6. Batch Adsorption Studies

In all the batch studies, the percentage removal (%R) and adsorption capacity (qₑ) were calculated using Equations 6 and 7:

(6)
(7)
where C₀ and Cₑ (mg/L) are the initial and equilibrium Congo Red concentrations, m (g) is the adsorbent mass, and V (L) is the solution volume. Graphs of removal efficiency against the investigated parameters were plotted to see the relationship. The parameters studied were as discussed in sections 2.6.1-2.6.4.
2.6.1. Effect of Solution pH
The effect of pH on the adsorption of Congo red was studied through the range 2–14. The pH was adjusted using 0.1 M NaOH and 0.1 M HCl. This was verified using a pH meter (Model 100 Benchtop Digital pH meter). 50 mL of 50 mg/L Congo red solution at each pH was shaken with 0.1 g of the composite at a shaking speed of 150 rpm for 120 minutes at room temperature. The resultant dye concentration was then determined using a UV-Vis spectrometer (UMS-UK model).
2.6.2. Effect of Adsorbent Dosage
The adsorbent dose of the chitosan-silica composite was varied at a range of 0.1 to 0.5 g. A specified amount of adsorbent (0.1, 0.2, 0.3, 0.4, and 0.5 g) was accurately weighed using an electric weighing balance (TM-EXC3003N) with precision and each placed into a 100 mL volumetric flask. 50 mL of 50 mg/L Congo red solution was then added to each flask and shaken using a mechanical shaker of model SWB-A at a shaking speed of 150 rpm for 120 minutes. The solutions were then filtered and the residual dye concentrations determined using UV-Vis.
2.6.3. Effect of Contact Time
The effect of contact time was evaluated by varying time in the range of 20–140 minutes, using 0.1 g of the composite in 50 mL of 50 mg/L Congo red solution at pH 2. The mixtures were shaken in the mechanical shaker of model SWB-A at 150 rpm and at room temperature.
2.6.4. Effect of Initial Dye Concentration
To investigate the effect of initial dye concentration, the stock solution of the dye was diluted to obtain different concentrations ranging from 40, 50, 60, 80, 100, and 120 mg/L. The amount of composite used in all concentrations was 0.1 g. The contents were shaken in a mechanical shaker of model SWB-A at 150 rpm for 120 minutes. The residual concentrations of the dye solutions were determined using UV-Vis.

2.7. Adsorption Isotherms

The equilibrium isotherm tests were performed by adding 0.1 g of the chitosan-silica composite to 50 mL of Congo red solutions of different initial dye concentrations (40–120 mg/L), and the mixture was shaken for 120 minutes at 25°C. The equilibrium data were fitted to the linear form of Freundlich and Langmuir isotherm Equations 8 and 9, respectively [21].

(8)
(9)
where qₑ (mg/g) is the equilibrium adsorption capacity, Cₑ (mg/L) is the equilibrium concentration, Qₘ (mg/g) is the maximum Langmuir monolayer adsorption capacity, Kʟ (L/mg) is the Langmuir equilibrium constant, Kᶠ (mg/g) is the Freundlich adsorption capacity constant, and 1/n is the heterogeneity factor. The fitness of the models was assessed using the coefficient of determination (R²).

3. Results and Discussion

3.1. X-ray Fluorescence (XRF) Analysis

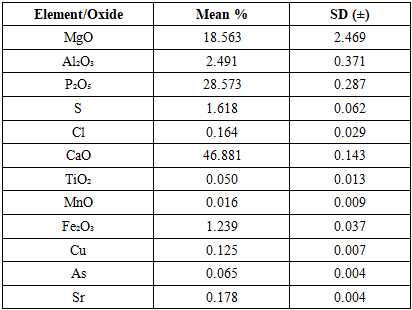
Table 1 shows the elemental/oxide composition of chitosan as obtained using XRF.
Table 1. Elemental/oxide composition of chitosan using XRF
     
The main chemical components of the extracted chitosan were phosphorus pentoxide (28.573%) and calcium oxide (46.881%), which correspond to hydroxyapatite and calcium carbonate that remained after deproteinization and deacetylation of fish scales. At this point, no silica was found, indicating that no silica source had been added to the chitosan. Table 2 shows the elemental composition of the chitosan-silica composite.
Table 2. Elemental/oxide composition of the chitosan–silica composite by XRF
     
The chitosan–silica composite predominantly consists of silicon dioxide (60.916%), confirming successful incorporation during the sol-gel process. The reduced SiO₂ from the raw rice husk ash (91.862%) is attributed to dilution rather than synthesis failure. The composite also contains calcium oxide (14.136%) and sulphur (14.868%), indicating mineral residues from the chitosan preparation remain alongside silica [24], [21]. This suggests an additive incorporation of silica and not a replacement of the mineral matrix. In contrast, phosphorus pentoxide significantly decreased to 3%, showing a unique dilution effect. Magnesium and aluminium oxides were below detection limits, further indicating successful silica grafting [25].

3.2. X-ray Diffraction (XRD) Analysis

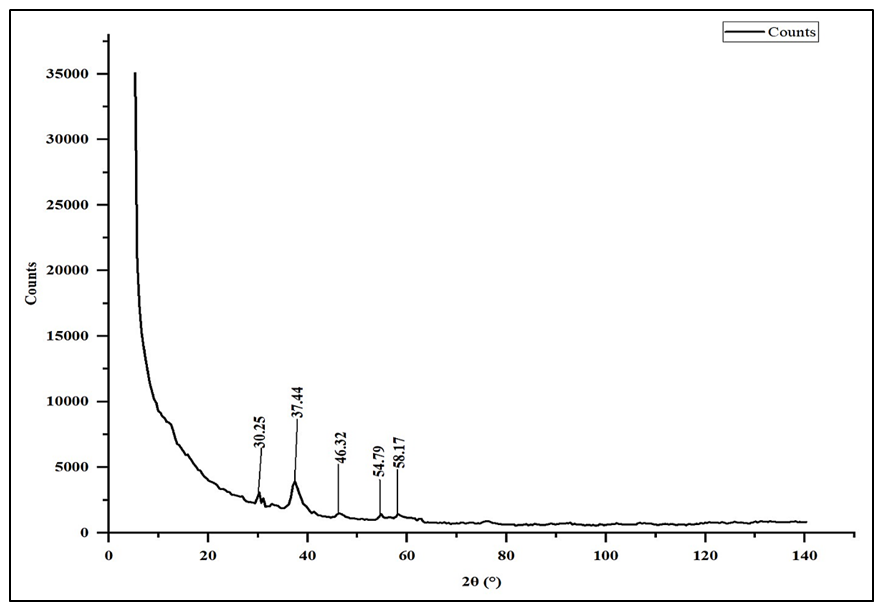
The crystallographic structure and degree of crystallinity of synthesized chitosan and the chitosan–silica composite was investigated using XRD (D6 PHASER serial number 5117) to assess whether the crystallographic properties of chitosan were influenced by the formation of the composite [21]. The figure below shows the X-ray diffractogram of the synthesized chitosan sample.
The diffractogram of chitosan (Figure 3) shows broad, poorly resolved peaks along with a small hump at 2θ = 10.37°, which corresponds to the semicrystalline hydrated allomorph of chitosan, which is composed of partially ordered chains of glucosamine molecules connected by hydrogen bonds between them [26]. The three peaks at 30.67°, 37.45°, and 52.25° were interpreted as due to the introduction of trace amounts of calcite, halite, and quartz during demineralization and neutralization of the fish-scale matrix [27]. The reflection of chitosan is obtained with a sharp resolution that is not interfered with by other phases and thus represents the crystallographic baseline of the semicrystalline chitosan prior to incorporation of silica. Figure 4 below shows the XRD of the chitosan-silica composite.
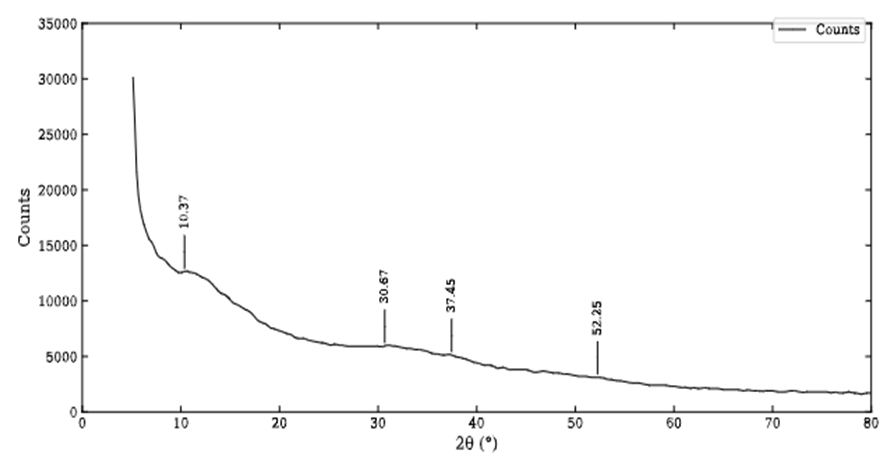
Figure 3. X-ray diffractogram of the synthesized chitosan sample
The main difference between the composite (Figure 4) and unmodified chitosan diffractograms are the absence of the 2θ = 10.37° peak. When the amine and hydroxyl groups are occupied with silica anchoring during the sol-gel encapsulation process, the glucosamine chains have less capacity to form hydrogen bonds, leading to a loss of the resolvable (020) reflection [26]. The composite pattern shows a general diffuse hump that is characteristic of amorphous silica and weak residual mineral reflections at 30.25°, 37.44°, 46.32°, 54.79° and 58.17° 2θ angles, all of which correspond to the same calcite–halite–quartz residue set found in the unmodified chitosan, with no other new mineral phase identified as being attributable to the presence of crystalline silica. This shows that the silica phase is linked to the chitosan matrix as an amorphous network, like results obtained for similar sol-gel chitosan–silica systems [14].
Figure 4. X-ray diffractogram of the chitosan–silica composite

3.3. Raman Spectroscopic Analysis

Raman spectroscopy was used to probe the molecular bonding environment of chitosan and the composite. Unlike XRD, which is most sensitive to long-range crystalline order, Raman scattering is sensitive to local vibrational modes and is therefore well suited to detecting the amine, hydroxyl, and glycosidic bonds that govern chitosan's dye-binding behaviour, as well as any new bonds formed once silica is introduced. Figure 5 below shows the Raman spectrum of chitosan extracted from fish scales.
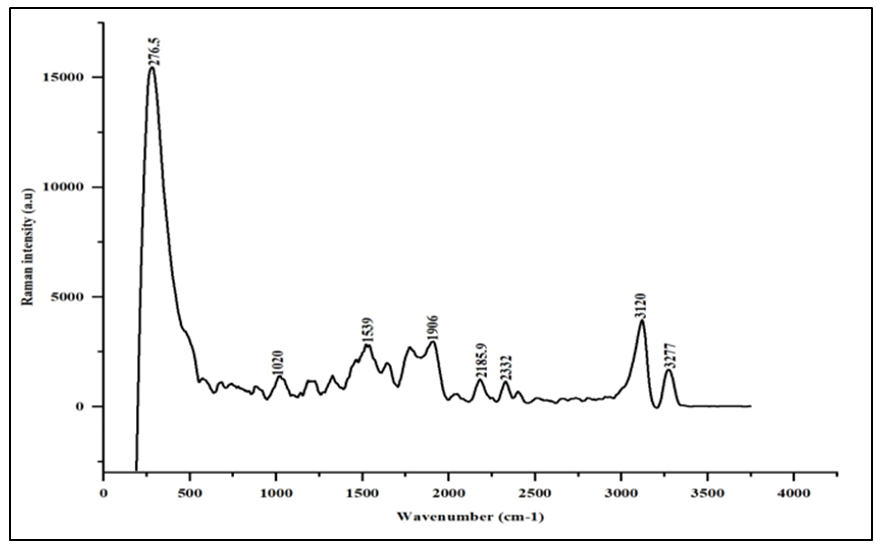
Figure 5. Raman spectrum of chitosan extracted from fish scales
The Raman spectrum of pure chitosan (Figure 5) showed a low-wavenumber band at 276.5 cm⁻¹, assigned to lattice vibrations of the polysaccharide backbone. Bands at 1020 cm⁻¹ and 1539 cm⁻¹ were attributed to C–O/C–O–C glycosidic stretching and N–H bending/C–N stretching vibrations, respectively, characteristic of the amine and amide groups in deacetylated chitin [14]. A weaker band at 1906 cm⁻¹ corresponded to an overtone vibration, while the broad envelope between 3000 and 3300 cm⁻¹ resolved into two peaks at 3120 cm⁻¹ and 3277 cm⁻¹, assigned to O–H and N–H stretching of the hydroxyl and amine groups central to chitosan's dye-binding capacity. Figure 6 below shows the Raman spectrum of the chitosan-silica composite extracted from fish scales and rice husk ash, recorded under the same conditions so that any shift or splitting of these bands can be attributed directly to the incorporation of silica into the chitosan matrix rather than to measurement variability.
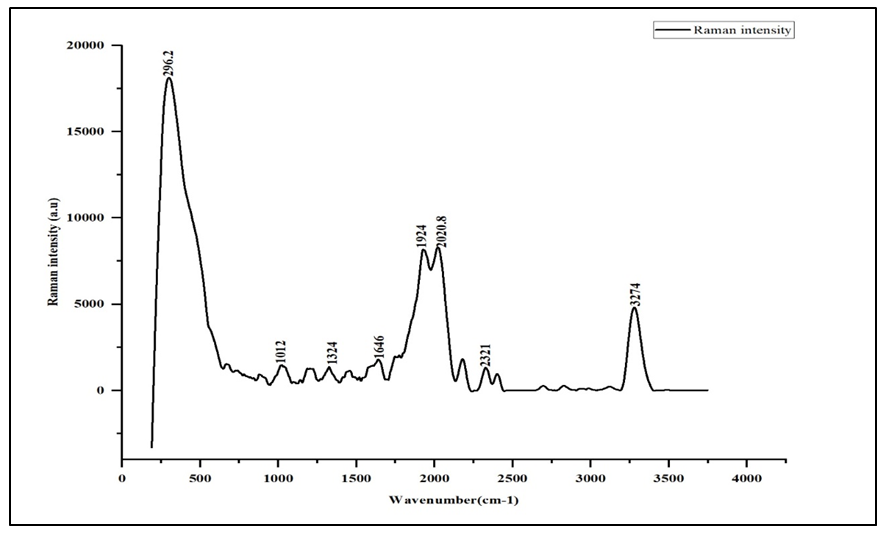
Figure 6. Raman spectrum of the chitosan–silica composite
Following sol-gel encapsulation with rice-husk-ash-derived silica, several shifts were observed in the composite spectrum (Figure 6). The low-frequency band shifted from 276.5 cm⁻¹ to 296.2 cm⁻¹, indicating the formation of a new chitosan–silica vibrational network. The C–O stretching region now overlaps with Si–O–Si symmetric and asymmetric stretching contributions from the silica matrix, while a distinct band at 1646 cm⁻¹ NH₂⁻ together with the retained 1324 cm⁻¹ band indicated reorganized carbonyl and amide environments arising from hydrogen bonding between chitosan's amine/hydroxyl groups and the silica silanol groups. The most notable change occurred between 1900 and 2100 cm⁻¹, where the single 1906 cm⁻¹ band of chitosan intensified and split into a doublet at 1924 cm⁻¹ and 2020.8 cm⁻¹, consistent with a well-ordered hydrogen-bonding network between the chitosan and silica phases [28]. These structural changes are consistent with improved mechanical strength and a larger effective surface area for adsorption relative to pure chitosan [29].

3.4. FT-IR Characterization

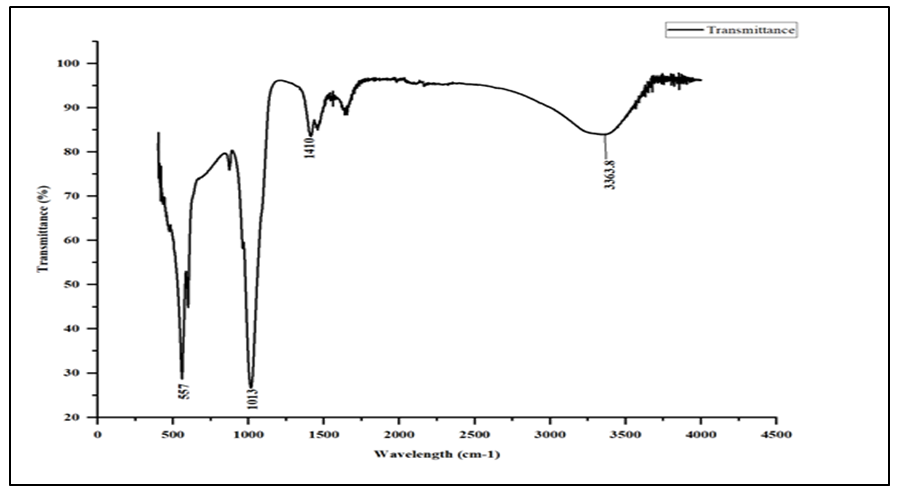
FT-IR spectroscopy was used to identify the functional groups present in chitosan and the chitosan–silica composite and to confirm the successful hybridization of the two phases. Because FT-IR is particularly sensitive to the amine, hydroxyl, and silanol groups that mediate dye binding, it provides a direct chemical complement to the structural information obtained from XRD and Raman spectroscopy above. The graph below shows the FT-IR spectrum of chitosan extracted from fish scales.
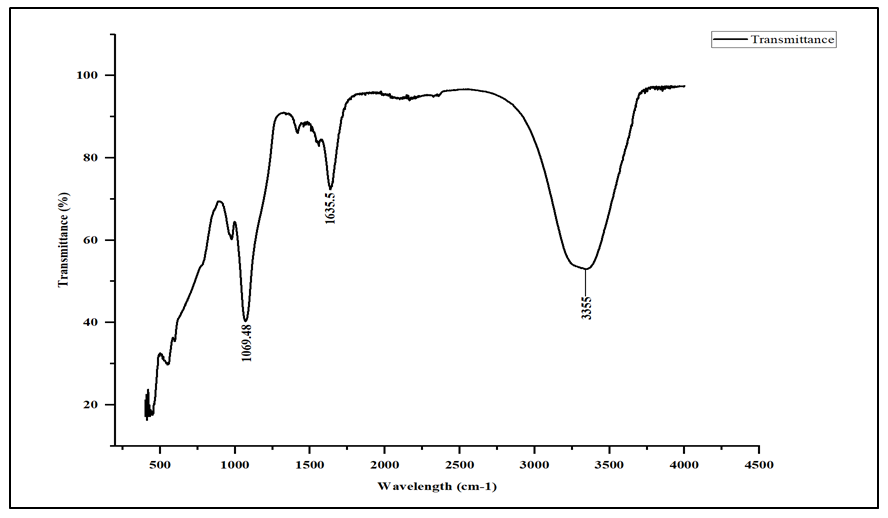
Figure 7. FT-IR spectrum of chitosan extracted from fish scales
The chitosan spectrum (Figure 7) shows a broad absorption band near 3450 cm⁻¹, attributed to overlapping N–H and O–H stretching vibrations reflecting extensive hydrogen bonding [30], [31]. The Amide I and Amide II bands, between 1650 and 1550 cm⁻¹, confirmed a degree of deacetylation exceeding 70%. Bands near 1420 cm⁻¹ (C–H bending/C–N stretching) and between 1000 and 1150 cm⁻¹ (C–O/C–O–C glycosidic stretching) confirmed the preserved polysaccharide backbone, while a band near 470 cm⁻¹, assigned to skeletal deformation vibrations, further supported the structural integrity of the extracted chitosan [32]. The graph below shows the FT-IR spectrum of the chitosan-silica composite, recorded under identical instrument conditions to allow a direct, band-by-band comparison with the pure chitosan spectrum above.
Figure 8. FT-IR spectrum of the chitosan–silica composite
The composite spectrum (Figure 8) retains the general chitosan envelope but is dominated by vibrational modes of the silica network. The N–H/O–H band near 3450 cm⁻¹ is weaker and narrower, consistent with amine and hydroxyl groups engaging in hydrogen bonding with surface silanol (Si–OH) groups [12]. The most significant change is the transformation of the C–O–C region: pure chitosan shows a moderate band near 1030 cm⁻¹, whereas the composite exhibits a strong, broad absorption spanning approximately 1000–1150 cm⁻¹ with a deep minimum near 1080 cm⁻¹, assigned to asymmetric Si–O–Si stretching of the silica framework derived from rice husk ash [13]. A shoulder near 950–960 cm⁻¹ was assigned to Si–OH stretching, while recovered transmittance near 800 cm⁻¹ corresponded to symmetric Si–O–Si stretching superimposed on the chitosan skeletal band [33], [13]. Together, these bands provide compelling evidence of successful sol-gel encapsulation of rice-husk-ash-derived silica within the chitosan matrix, strengthened by hydrogen bonding and condensation interactions between the hydroxyl/amine groups of chitosan and the silanol groups of silica.

3.5. Effect of Solution pH on Congo Red Adsorption

The composite's removal performance was first evaluated as a function of solution pH, since pH governs the protonation state of the amine and silanol groups responsible for dye binding. The graph below shows the effect of solution pH on the removal efficiency of Congo red.
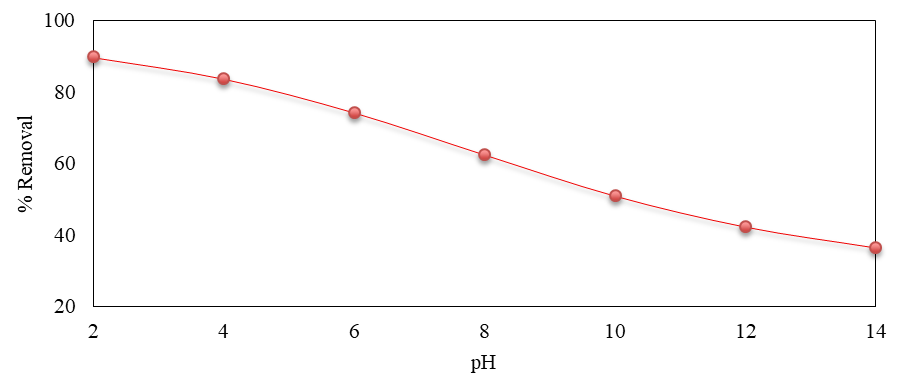
Figure 9. Effect of solution pH on the removal efficiency of Congo red by the chitosan–silica composite
The removal efficiency of Congo red decreased steadily with increasing pH, from a maximum of 89.88% at pH 2 to 36.60% at pH 14 (Figure 9). This trend reflects the protonation equilibria of the amino functional groups on the composite surface. In acidic conditions, the amine groups of chitosan are protonated to ammonium ions (–NH₃⁺), producing a positively charged composite surface that exerts a strong electrostatic pull on the anionic sulfonate groups (–SO₃⁻) of Congo red, consistent with the mechanism established for chitosan-based adsorbents interacting with anionic azo dyes [21], [1]. As pH increases, the degree of amine protonation declines, reducing the positive surface charge available for electrostatic attraction. Simultaneously, the deprotonation of surface silanol groups (Si–OH → Si–O⁻) at higher pH increases the negative surface charge, resulting in electrostatic repulsion of the anionic sulfonate groups and driving the observed decline in removal efficiency to 36.60% at pH 14. These results confirm that acidic conditions, and pH 2, are optimal for Congo Red removal using the chitosan–silica composite.

3.6. Effect of Adsorbent Dosage on Congo Red Adsorption

The amount of adsorbent available directly determines the number of binding sites accessible to the dye in solution. The graph below shows the effect of adsorbent dose on the removal efficiency of Congo red.
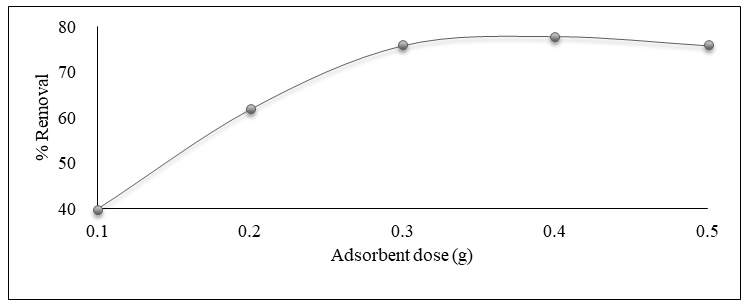
Figure 10. Effect of adsorbent dose on the removal efficiency of Congo red
The percentage removal of Congo red increased with increasing adsorbent dose, from 40.00% at 0.1 g to a maximum of 80.00% at 0.4 g, before decreasing slightly to 75.99% at 0.5 g (Figure 10). The electrostatic attraction between the protonated amino groups (–NH₃⁺) of chitosan and the sulfonate groups (–SO₃⁻) of Congo red is the primary driver of this increase: as adsorbent dosage rises, more binding sites become available, increasing the adsorption capacity through electrostatic, hydrogen-bonding, and van der Waals interactions [8], [34]. The decline beyond 0.4 g is characteristic of site saturation and particle aggregation, whereby overlapping composite particles and coiled chitosan chains reduce the number of –NH₃⁺ sites accessible to the bulky, planar Congo red molecule, so that additional adsorbent no longer translates into proportional dye removal.

3.7. Effect of Contact Time on Congo Red Adsorption

The rate at which equilibrium is reached is an important practical parameter for any adsorption process. The graph below shows the effect of contact time on the removal efficiency of Congo red.
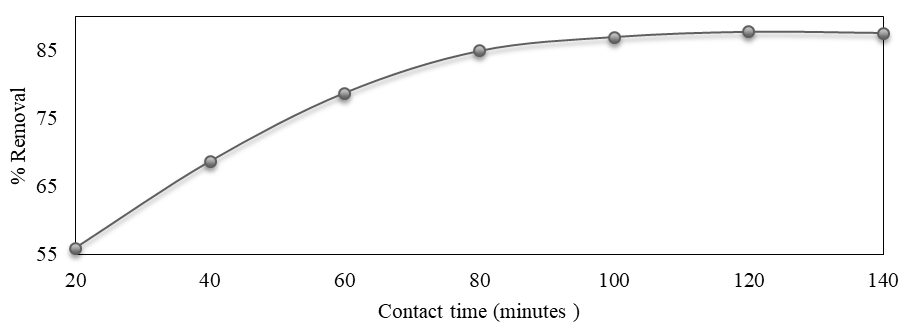
Figure 11. Effect of contact time on the removal efficiency of Congo red
The removal efficiency of Congo red increased from 56.02% at 20 minutes to 87.75% at 120 minutes, after which it plateaued, decreasing marginally to 87.58% at 140 minutes (Figure 11), indicating that adsorption equilibrium was reached at 120 minutes. The rapid initial uptake reflects the strong electrostatic attraction between the anionic sulfonate groups of Congo red and the protonated amine sites of chitosan, which provides a fast and strong initial driving force for adsorption. Although the high molecular weight of Congo Red (696.66 g/mol) can impose steric hindrance during diffusion through the composite network, the dye's multiple functional groups, sulfonate (–SO₃⁻) and azo (–N=N–), providing multiple points of interaction with the chitosan matrix, sustaining adsorption capacity despite this hindrance [8], [34].

3.8. Effect of Initial Dye Concentration on Congo Red Adsorption

The initial concentration of dye in solution influences the ratio of dye molecules to available binding sites, and so was also investigated. The graph below shows the effect of initial dye concentration on the removal efficiency of Congo red.
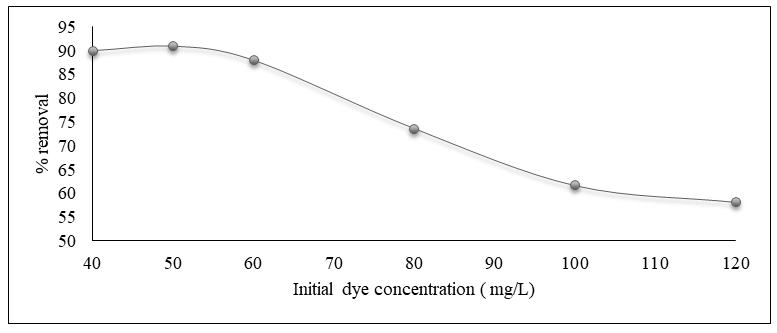
Figure 12. Effect of initial dye concentration on the removal efficiency of Congo red by the chitosan–silica composite
The removal efficiency of Congo red remained relatively stable at lower concentrations: 75.35% at 40 mg/L, 76.00% at 50 mg/L, and 75.22% at 60 mg/L before declining to 65.12%, 50.00%, and 44.00% at 80, 100, and 120 mg/L, respectively (Figure 12). At low-to-moderate concentrations, the number of dye molecules is small relative to the fixed population of amine, hydroxyl, and silanol binding sites on the composite, allowing most dye molecules to readily access an unoccupied site. As concentration rises further, this fixed site population becomes progressively saturated, leaving an increasing proportion of dye unadsorbed in solution [35,36]. On this basis, 50 mg/L was adopted as the optimal initial Congo red concentration for maximum percentage removal by the composite.

3.9. Adsorption Isotherm Analysis

The Langmuir and Freundlich isotherm models were applied to the equilibrium adsorption data to describe the interaction between Congo red and the chitosan–silica composite surface, in line with common practice for chitosan–silica and other biopolymer composites [21]. Table 3 presents the isotherm parameters obtained.
Table 3. Langmuir and Freundlich isotherm parameters for the adsorption of Congo red onto the chitosan–silica composite
     
The Langmuir model gave a substantially higher correlation coefficient (R² = 0.804) than the Freundlich model (R² = 0.359) for Congo red adsorption onto the chitosan–silica composite, indicating that the Langmuir model provides a moderate fit in describing the adsorption process. This suggests that Congo red adsorption most likely occurs predominantly as a monolayer on a relatively homogeneous population of binding sites, primarily the protonated amine sites of chitosan, rather than on a highly heterogeneous distribution of energetically distinct sites. The nature of this adsorption can better be analysed using BET analysis. This result is comparable to that reported for methylene blue adsorption onto pure chitosan, where a Langmuir fit (R² = 0.9409) and a maximum adsorption capacity of 7.605 mg/g likewise indicated monolayer adsorption as the dominant mechanism for chitosan-based adsorbents [37].
The Freundlich constant (Kᶠ = 1.427 mg/g) indicates a moderate adsorption capacity within the Freundlich framework, while the heterogeneity factor (1/n = 0.408, below 1) suggests that the adsorbent surface retains some heterogeneous character and that adsorption remains favourable, with capacity increasing at higher dye concentrations [38]. However, given the comparatively poor fit of the Freundlich model to the experimental data (R² = 0.359), it was not used to estimate the adsorption capacity of the composite; the Langmuir model was used instead.
Based on the Langmuir isotherm, the maximum monolayer adsorption capacity (Qₘ) of the composite for Congo red was 7.746 mg/g, with a Langmuir constant (Kʟ) of 0.085 L/mg. The comparatively modest binding affinity reflects the large molecular size and steric bulk of Congo red relative to smaller dye molecules, which limits access to interior binding sites within the composite network [39]. Overall, the good Langmuir fit indicates that Congo red adsorption onto the chitosan–silica composite proceeds primarily as a monolayer on energetically similar, protonated-amine active sites until saturation is reached.

3.10. Effect of Acidic Conditions on Mass Stability

After 24 h of exposure to 0.1% (v/v) acetic acid at pH 2.0, unmodified chitosan showed greater mass loss than the chitosan–silica composite, indicating lower resistance to acid-induced dissolution [24]. The higher mass retention of the chitosan–silica composite indicates the importance of silica in improving the mechanical, thermal, and chemical stability [42].
This trend agrees with studies showing that chitosan–silica materials remain functional at low pH without the extent of dissolution expected for pure chitosan, reflecting strong interactions between the biopolymer and silica phases [24]. The improved mass retention arises from stabilization of the polymer matrix rather than random experimental variation [42].
Table 4. Mass retention and mass loss of chitosan and chitosan–silica composite after 24 h exposure to 0.1% (v/v) acetic acid at pH 2.0
     
The direction of this difference matches broader literature in which silica incorporation improves thermal stability, reduces swelling, and increases structural robustness under demanding conditions [42]. One study also shows that composite chitosan outperformed native chitosan in acidic reservoir conditions, supporting the same conclusion that modification improves stability in acidic environments.
After 24 h immersion in 0.1% (v/v) acetic acid at pH 2.0, the chitosan–silica composite exhibited higher mass retention than unmodified chitosan. The composite retained 92.0 ± 0.1% of its initial mass, whereas pure chitosan retained 81.0 ± 0.2%. Correspondingly, mass loss was lower for the chitosan–silica composite (8.0 ± 0.1%) than for pure chitosan (19.0 ± 0.2%). These results indicate that incorporation of silica improved the resistance of chitosan to acid-induced dissolution and structural degradation. This observation agrees with literature showing that silica-containing chitosan materials possess improved acid stability, reduced swelling, and greater thermal and structural stability compared with unmodified chitosan.

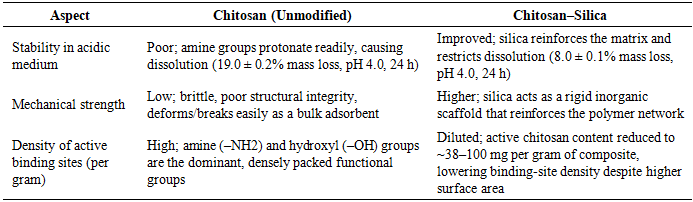
3.11. Comparison: Chitosan versus Chitosan–Silica Composite

The table below shows the comparisons between Chitosan and Chitosan-silica composite as used in adsorption of Congo Red dye.
Table 5. Comparison of unmodified chitosan and the chitosan–silica composite across properties relevant to this study
     
From the table, it is clear that silica incorporation strengthens the composite where structural robustness matters: it improves resistance to acidic dissolution, raises mechanical strength with silica functioning as a rigid inorganic support that reinforces the chitosan network [21].
These comparisons support a specific interpretation of the composite developed in this study: silica incorporation improves the material's structural durability and acid resistance.

3.12. Limitations of the Study

Two limitations qualify the findings of this study. First, although the Langmuir isotherm gave the best fit to the equilibrium data, the coefficient of determination (R² = 0.804) is moderate, and this fit alone does not confirm that adsorption occurs strictly as a monolayer on a homogeneous surface; BET surface area analysis, which would substantiate this mechanistic interpretation, was not performed.

4. Conclusions

This study successfully synthesized a chitosan–silica composite from two low-cost, waste-derived precursors. XRD showed the disappearance of the diagnostic (020) chitosan reflection at 2θ = 10.37°, indicating that silica anchoring replaced chitosan's crystalline order with an amorphous silica network, while Raman spectroscopy revealed shifted and split vibrational bands consistent with a new hydrogen-bonded chitosan–silica network, and FT-IR confirmed Si–O–Si and Si–O–C linkages from successful sol-gel encapsulation. Batch adsorption studies identified optimal Congo red removal at pH 2, an adsorbent dose of 0.4 g, a contact time of 120 minutes, and an initial dye concentration of 50 mg/L, reflecting electrostatic attraction between protonated amine groups on the composite and the dye's sulfonate groups, with the Langmuir isotherm (R² = 0.804) giving a maximum monolayer capacity (Qₘ) of 7.746 mg/g. These findings demonstrate a sustainable, low-cost route for valorizing fisheries and agricultural waste into a potential adsorbent.

CONFLICT OF INTEREST

All the authors have declared that there is no conflict of financial or personal interest involved in the work described in this paper.

ACKNOWLEDGEMENTS

The authors are grateful to the Department of Science, Technology and Engineering, Kibabii University, for its support during this research.

References

[1]  Elzahar, M. M. H., Abdelhamid, H. N., & Guibal, E. (2023). Removal of direct dyes from aqueous solutions using chitosan-based materials. Science of The Total Environment, 872, 162156.
[2]  Kyomuhimbo, H. D., McHunu, W., Arnold, M., Feleni, U., Haneklaus, N. H., & Brink, H. G. (2024). Synthesis and dye adsorption dynamics of chitosan-based composites. Journal of Environmental Chemical Engineering, 12(1), 111234.
[3]  Ochieng, G. M., Okeyo-Owuor, J. B., & Ngila, J. C. (2021). Organic pollutants in industrial wastewater and their environmental impacts. Water Environment Research, 93(4), 512–524.
[4]  Gisi, S. D., Lofrano, G., Grassi, M., & Notarnicola, M. (2020). Characteristics and adsorption capacities of low-cost sorbents for wastewater treatment. Sustainable Materials and Technologies, 9, 10–40.
[5]  Crini, G., & Badot, P. M. (2020). Application of chitosan, a natural amino polysaccharide, for dye removal from aqueous solutions by adsorption processes. Progress in Polymer Science, 33(4), 399–447.
[6]  Soltani, R. D. C. (2021). Adsorption technologies for dye removal from industrial wastewater. Journal of Environmental Chemical Engineering, 9(4), 105–118.
[7]  Elhady, M., Abdel-Aziz, H., & Abdel-Rahman, M. (2024). Recent advances in chitosan-based adsorbents for dye removal. Journal of Water Process Engineering, 58, 104–119.
[8]  Kyzas, G. Z., & Bikiaris, D. N. (2015). Recent modifications of chitosan for adsorption applications: A critical and systematic review. Marine Drugs, 13(1), 312–337.
[9]  Bratskaya, S., Pakhlov, E., & Privalko, V. (2022). Chitosan-silica hybrid materials: Synthesis and characterization. Journal of Sol-Gel Science and Technology, 101(2), 245–258.
[10]  Bakar, N. A., Sapei, L., & Ismail, J. (2022). Extraction of silica from rice husk ash for composite synthesis. Materials Chemistry and Physics, 275, 125–135.
[11]  Sapei, L., Bakar, N. A., & Ismail, J. (2021). Sodium silicate extraction from rice husk ash. Journal of Chemical Engineering, 28(4), 312–320.
[12]  Okoronkwo, E. A., & Alaneme, K. K. (2018). Chitosan-silica hybrid materials for adsorption applications. Journal of Materials and Environmental Science, 9(3), 800–812.
[13]  Saiful, H. (2022). Synthesis and characterization of chitosan-silica composites. International Journal of Chemistry, 12(3), 78–89.
[14]  Zhou, Y., Wang, H., & Zhang, X. (2022). Preparation and characterization of chitosan-silica composites. Materials Research Bulletin, 148, 111–120.
[15]  Hassan, M., Ahmed, M., & Rahman, M. (2023). Performance evaluation of composite adsorbents in wastewater treatment. Environmental Technology & Innovation, 30, 103–112.
[16]  Rinaudo, M. (2020). Chitin and Chitosan: Properties and applications. Progress in Polymer Science, 31(7), 603–632.
[17]  Younes, I., Rinaudo, M., & Jellouli, K. (2020). Extraction and characterization of chitin and chitosan from marine resources. International Journal of Biological Macromolecules, 143, 1–12.
[18]  Kaya, M., Baran, T., & Mentes, A. (2022). A review on fungal chitosan: Extraction, characterization, and environmental applications. Carbohydrate Polymers, 279, 118–133.
[19]  Kalapathy, U., Proctor, A., & Shultz, J. (2000). A simple method for production of pure silica from rice hull ash. Bioresource Technology, 73(3), 257–262.
[20]  Hermania Em Wogo, A., Dee, M. Y., & Darmakusuma, D. (2022). The effect of silica concentration and chitosan on the antibacterial properties of chitosan-silica composites. Journal of Physics: Conference Series, 2165, 012–034.
[21]  Blachnio, M., Zienkiewicz-Strzalka, M., Derylo-Marczewska, A., Nosach, L. V., & Voronin, E. F. (2023). Chitosan–silica composites for adsorption application in the treatment of aqueous solutions. Materials, 16(4), 1533.
[22]  Kačuráková, M., Belton, P. S., & Wilson, R. H. (2020). Raman spectroscopy of chitosan. Spectrochimica Acta Part A: Molecular and Biomolecular Spectroscopy, 236, 118–327.
[23]  Wang, J., Wang, S., & Zhao, G. (2023). Advances in chitosan-based adsorbents for dye removal from aqueous systems. Bioresource Technology Reports, 21, 101–335.
[24]  Golie, W. M., & Ahmed, A. (2022). Experimental evaluation of the stability of chitosan based biocomposites under various environmental conditions. Ecology, Environment and Conservation. https://doi.org/10.53550/eec.2022.v28i03.020.
[25]  Xu, J., Zhang, Y., & Li, Q. (2021). Adsorption mechanisms of dyes on chitosan-based materials. Journal of Molecular Liquids, 321, 114456.
[26]  Khabibullaeva, E. S., Kuznetsov, B. N., & Kazachenko, A. S. (2022). Crystallographic structure of chitosan composites. Journal of Structural Chemistry, 63(5), 789–799.
[27]  Ade, M. R., Hidayat, N., & Sudarmadji, S. (2020). Preparation and characterization of chitosan from fish scales. Journal of Applied Chemistry, 13(2), 45–52.
[28]  Al-Sagheer, F. A., & Muslim, S. (2009). Thermal and mechanical properties of chitosan-silica hybrid composites. Carbohydrate Polymers, 77(2), 410–417.
[29]  Maingi, F. M., Muya, E. M., & Kamau, G. N. (2022). Adsorption of chromium (VI) from aqueous solutions using chitosan composite. South African Journal of Chemical Engineering, 41, 220–229.
[30]  Brugnerotto, J., Lizardi, J., Goycoolea, F. M., Arguülles-Monal, W., Desbrières, J., & Rinaudo, M. (2001). An infrared investigation in relation with chitin and chitosan characterization. Polymer, 42(8), 3569–3580.
[31]  Kasaai, M. R. (2008). A review of several reported procedures to determine the degree of N-acetylation for chitin and chitosan. Carbohydrate Polymers, 71(4), 497–508.
[32]  Stuart, B. (2004). Infrared spectroscopy: Fundamentals and applications. John Wiley & Sons.
[33]  Ebisike, K. (2018). FT-IR analysis of chitosan and chitosan-silica composites. Journal of Chemical and Pharmaceutical Research, 10(5), 112–120.
[34]  Vakili, M., Deng, S., Li, T., Wang, W., Wang, W., Yu, G., & Wang, X. (2019). Novel crosslinked chitosan for enhanced adsorption of contaminants. Chemical Engineering Journal, 357, 626–639.
[35]  Gebresslasie, B. (2020). Effect of initial dye concentration on adsorption efficiency. Journal of Environmental Management, 275, 111–120.
[36]  Strebel, S., Fuchs, H., & Keppler, K. (2024). Adsorption capacity of chitosan composites for cationic and anionic dyes. Journal of Environmental Management, 350, 119–567.
[37]  Akhtar, M., & Jamal, A. (2026). Adsorption of methylene blue onto chitosan-based adsorbents: Equilibrium and kinetic studies. Journal of Environmental Chemical Engineering, 14(1), 111–900.
[38]  Blachnio, M., Zienkiewicz-Strałka, M., & Deryło-Marczewska, A. (2024). Chitosan-silica composites for adsorption application in the treatment of dye-polluted waters. Molecules, 29(3), 612.
[39]  Liang, T. (2022). Adsorption isotherm modeling for dye removal. Chemical Engineering Research and Design, 180, 234–245.
[40]  De Souza Soares, L., Perim, R. B., De Alvarenga, E. S., De Moura Guimarães, L., De Carvalho Teixeira, A. V. N., Coimbra, J. D. R. S., & De Oliveira, E. B. (2019). Insights on physicochemical aspects of chitosan dispersion in aqueous solutions of acetic, glycolic, propionic or lactic acid.. International journal of biological macromolecules, 128, 140-148 . https://doi.org/10.1016/j.ijbiomac.2019.01.106.
[41]  Morales, J., Vásquez, A., & Orellana Catalán, I. P. (2026). Preparation and physicochemical characterization of a biodegradable chitosan/carboxymethyl cellulose hydrogel synthesized in NaOH/urea medium. PLOS One, 21. https://doi.org/10.1371/journal.pone.0352207.
[42]  Ilyas, R. A., Aisyah, H. A., Nordin, A. H., Ngadi, N., Zuhri, M., Asyraf, M., Sapuan, S., Zainudin, E., Sharma, S., Abral, H., Asrofi, M., Syafri, E., Sari, N. H., Rafidah, M., Zakaria, S., Razman, M., Majid, N. A., Ramli, Z., Azmi, A., . . . Ibrahim, R. (2022). Natural-Fiber-Reinforced Chitosan, Chitosan Blends and Their Nanocomposites for Various Advanced Applications. Polymers, 14. https://doi.org/10.3390/polym14050874.