International Journal of Composite Materials

p-ISSN: 2166-479X    e-ISSN: 2166-4919

2021;  11(1): 13-21

doi:10.5923/j.cmaterials.20211101.03

Received: Jul. 27, 2021; Accepted: Aug. 5, 2021; Published: Aug. 7, 2021


Investigation of the Mechanical Behavior of the Oil Shale Ash Filled Chlorinated Polyvinyl Chloride Composite Material

Heba Al-Khlaifat, Raid Banat

Chemistry Department, Al-alBayt University, Mafraq, Jordan

Correspondence to: Raid Banat, Chemistry Department, Al-alBayt University, Mafraq, Jordan.

Email:

Copyright © 2021 The Author(s). Published by Scientific & Academic Publishing.

This work is licensed under the Creative Commons Attribution International License (CC BY).
http://creativecommons.org/licenses/by/4.0/

Abstract

The effect of the oil shale ash (OSA) addition on the impact, tensile, flexural, water uptake, and morphological behavior of the chlorinated polyvinylchloride (CPVC) was investigated. Adding OSA filler to CPVC matrix yielded a greater impact strength of 498 kJ/m2. While the tensile stress at yield and at break increased by an average of 50% and 100%, respectively, the tensile strain at yield and at break increased by an average of 20% and 10%, sequentially. The tensile and flexural modulus of OSA/CPVC increased by 16% and 65%, respectively. The results of this work demonstrated that the OSA could be used as a reinforcement material for the CPVC polymer, providing superior mechanical properties with respect to the neat polymer, as long as an appropriate OSA filler proportion, 5% - 15-%, is included into the CPVC polymer composite. Water absorption was increased with the increase of the OSA filler content. Scanning electron microscopy microphotographs evidenced the improvement in the mechanical behavior of the OSA/CPVC polymer composite by low level of both filler pullout and voids.

Keywords: Oil shale ash, Chlorinated polyvinylchloride, Composite, Mechanical properties

Cite this paper: Heba Al-Khlaifat, Raid Banat, Investigation of the Mechanical Behavior of the Oil Shale Ash Filled Chlorinated Polyvinyl Chloride Composite Material, International Journal of Composite Materials, Vol. 11 No. 1, 2021, pp. 13-21. doi: 10.5923/j.cmaterials.20211101.03.

1. Introduction

Chlorinated polyvinyl chloride (CPVC) has established its value across commercial applications wherever the use at high temperature, high pressure and resistance to and corrosion, are needed [1]. CPVC, a typical low-priced polymer developed by excessive chlorination of polyvinyl chloride (PVC), contains a higher quantity of chlorine 63-69 wt. % than common PVC 56.8 wt. % [2,3]. The impact of adding more chlorine to the PVC molecule is to mainly raise the glass transition temperature (Tg) of the polymer from 95°C to the 115–135°C [4-6]. CPVC is usually used as a structural material, or as a part of a polymer mix, to develop the flameproof and mechanical properties of products [7]. CPVC is amorphous or weakly crystalline material [8]. When the PVC is chlorinated, its polarity, solubility and chemical stability of the molecular chains arrangement, can be bettered [2]. Especially, because of its heat resistance, mechanical behavior and corrosion resistance, CPVC is wide utilized in diverse industrial fields [9,10].
Oil shale (OS) is a sedimentary rock wherever organic content (kerogen) is insoluble in organic solvents, however produces liquid oil-like organic solvents, once exposed to temperatures up to 500-600°C [11,12]. Oil shale ash (OSA) is what remains after the combustion process of OS within the quantity that depends on the combustion temperature and different conditions [13]. Most of OSA remains deposited in the fields next to the power plants [14]. Deposits of OSA cause deliberate landscape modifications within the area close the power plants that use OS as fuel [15]. Waste transformation into beneficial resources fortify sustainability and lowers pollution [16]. Ash is an example of commercial waste that has received remarkable attention within the previous decade [17]. Ash may be a waste produced from the combustion of a large range of materials, like wood, coal and OS [18-20]. It’s estimated that over 650 million heaps of OSA is made yearly [21]. The utilization of OSA has been investigated for several applications. Studies have shown that OSA are often used within the stabilization of soils [22], for Portland cement production [23], for zeolite production [24], as a modifier for asphalt binders [25], for asphalt-mix production [26], for ceramics production [27].
Polymer composites are mixtures of materials differing in composition, where the individual constituents keep their discrete identities. These separate constituents react with each other to afford the needed mechanical strength or stiffness to the composite part [28]. In literature no mention to any work directly utilizing the OSA in CPVC. Oja et al (2008) studied the thermal processing of the PVC in the presence of alkaline OSA as a potentially an alternative for PVC waste recycling [29]. Abed el-hakim et al (2019) reported an improvement in the mechanical and thermal properties of CPVC by incorporating modified CaCO3 nanoparticles as a filler [30]. J Kim et al (2021) studied the development of low cost carbon fibers based on CPVC for automotive applications [31]. The aim of this study was to examine the variation of the mechanical behavior of the OSA/CPVC polymer composite with various OSA filler content. Tensile, flexural and impact strength as a function of filler content were investigated and reported in the present research accordingly.

2. Materials and Methods

The polymer composites were prepared by using chlorinated polyvinyl chloride CPVC which was purchased from Arabian Plastic Compounds APC (RICOM XFLM-7185M SR BL), Saudi Arabia. The CPVC has a density of 1.33 g/cm3 with a melt processing temperature that must not exceed 185°C. Local oil shale was kindly provided by the local research laboratory from Attarat region in Jordan. Parloid™ k-120nd ER is an acrylic processing aid, was used to improve the melt flow of the CPVC extrudate.

2.1. Oil shale ash (OSA) Preparation

Oil shale was grinded into fine powder with a vibrating cub mill (Fristch Germany). Oil shale ash utilized in this research was obtained from the burning of the fine oil shale particles in a muffle furnace at 550°C - 600°C for 2 hours, after which OSA was conditioned prior to using as a reinforcement filler material. The average particle size utilized in this study was within the domain of 63μm - 125μm obtained by dry sieving. To minimize the moisture content of the ash to 1.5% or below, OSA was overnight oven dried at 103°C. Dried OSA was then stored in desiccator for composite manufacturing.

2.2. Composite Sample Preparation

The OSA filler with 0-30 wt. % and CPVC polymer matrix in the presence of acrylic processing aid were mixed in a parallel co-rotating twin screw extruder (TSE 20, L/D: 40:1, D: 22 mm) having temperature set ranging from 145°C to 175°C. The feed rate and the screw speed were 3kg/h. and 60 rpm, respectively.
The impact toughness test samples were molded in an aluminum mold (63.5 x 6.4 x 12.7 mm). Multiple sheets from every composite formulation 30 x 20 x 2 mm were prepared by using a stainless-steel mold and a thermal press machine (XH-406B). The tensile test samples of the standard dumbbell shape (ASTM D-638 type IV) were cut out from the molded composite sheets. The flexural test samples were intended by using an iron mold (200 x 10 x 4 mm).

2.3. Mechanical Characterization

The composite samples were stored at 27°C and 44% relative humidity for 15 - 20 days. They were then examined using a universal testing machine (WDW-5) operated at the rate of 1 mm/min with a 5-KN load cell. Tensile properties were analyzed using dog-bone specimen according to ASTM D-638 type IV. The flexural test samples were measured as well according to BS EN ISO 178:2003. Un-notched Izod impact strength was measured according to ASTM: D256 using impact testing machine (FI-68) at an impact speed of 3.5 m/s. The results were obtained from the mean of no minimal than 5 samples.

2.4. Water Absorption Test

The water absorption test was carried out according to the ASTM D570 standard. Disk composite samples (diameter = 50 mm, thickness 3.14 mm) were immersed in distilled water at 25°C for 40 days, where the water uptake measured every day. The percentage of the water absorption was calculated according to equation (1):
(1)
Where; M stand for the dry weight of the sample and Mt the weight of the immersed sample at any specific time.

2.5. Scanning Electron Microscopy (SEM)

Scanning electron microscopy (SEM) photomicrographs, Quanta 600, of the fractured surfaces were taken to characterize the morphological nature of the composite specimens. The fractured surfaces for samples were made conductive by sputter-coating with palladium in a vacuum chamber.

3. Results and Discussion

3.1. Impact Strength

The impact strength (kJ/m2) of the manufactured OSA/CPVC composites with various OSA loading is shown in Figure 1. Neat CPVC polymer sample demonstrated an impact energy of 281 J/m, the lowest of all tested samples. The addition of OSA to the CPVC polymer matrix resulted in an increase in the impact strength. Samples with 5% OSA showed an improvement in the impact strength 498 J/m, the highest of all tested samples. The observed impact strength values for the other formulations were 475 J/m, 454 J/m, 435 J/m, 391J/m and 381 J/m for 10%, 15%, 20%, 25% and 30%, respectively. However, the observed decrease in these values was better than that of the neat CPVC. High impact strength indicates that the energy absorbed by the specimen has increased which means that the samples toughness increased. It was noted that the addition of OSA as a filler at 5% loading level increased the impact strength nearly by two folds. This can be attributed to relatively the greater dispersion of the filler within the CPVC polymer matrix.
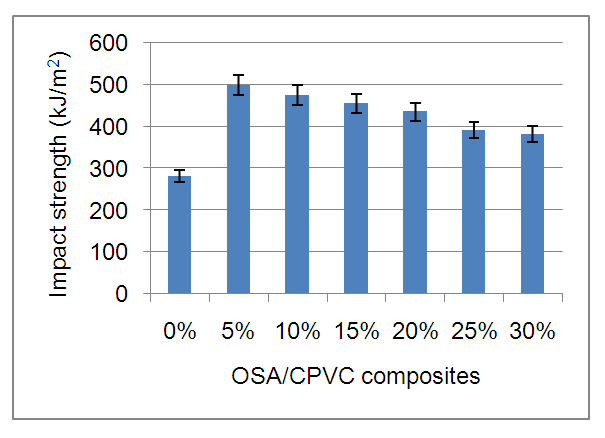
Figure 1. Impact strength of the neat CPVC and OSA/CPVC polymer composite
Remarkable increase in the impact strength of the composite can be seen with the inclusion of small amount of OSA where the impact strength has increased by more than 75%. When polymer subjected to impact, energy is absorbed in the deformation process of the polymeric material, de-bonding at the interfacial surface between filler and matrix and in the fracture of the filler material. When small filler size is incorporated in the polymer matrix, the fracture length increases significantly in the course of crack process. The smaller the size of the OSA particles, the greater will be their surface area, therefore higher will be the grow in fracture length leading to an increase in energy consumption before crack. OSA particles are rigid and have higher fracture stress compared to the CPVC polymer so they did not crack by the growing fracture. If the fracture strength of CPVC polymer is higher than that of the OSA particle, particles will tend to fracture, again consuming energy. Increase in impact strength of the material will depend on the fracture strength of the OSA filler material [32].

3.2. Tensile Strength

Tensile stress at yield is a measurement of the capability of a material to come back to its original dimensions after an applied stress is removed [33]. Figure 2 shows the tensile stress at yield for the manufactured samples of OSA/CPVC of different OSA weight ratio. For the neat CPVC the lowest value of tensile stress at yield 78 MPa was measured. Addition of the OSA to CPVC had relatively high impact on the tensile stress at yield at levels of 5% (122 MPa), 10% (125 MPa), and 15% (125 MPa). When the proportion of OSA to CPVC was increased by more than 15%, a relatively moderate increase in the tensile stress was noted at all loading levels. As the data reveals the OSA addition in any proportions to the CPVC polymer matrix would improve the tensile stress at yield.
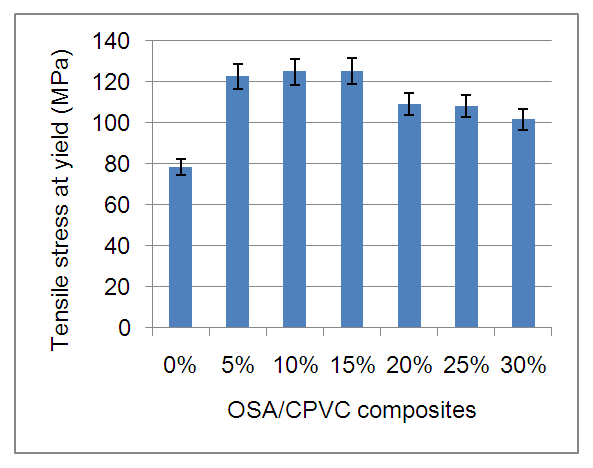
Figure 2. Tensile stress at yield of the neat CPVC and OSA/CPVC polymer composite
During the tensile test, the yield strength was increased when OSA included in the CPVC matrix composite. This behavior was observed in cases of 5% - 30% OSA filled CPVC. The yield strength of the filled systems was greater than that of the unfilled CPVC. This could be attributed to the good filler matrix adhesion. Hence it could be inferred that the OSA can produce beneficial effects while preparing CPVC composite [34].
Tensile stress at rupture
Tensile stress at rupture is that the maximum stress a given sample of plastic be able to afford before it breaks [33]. The raw data results with regard to the measurements of tensile stress at rupture of the manufactured OSA/CPVC composite with different OSA weight ratio is shown in Figure 3. Adding OSA to CPVC significantly increased the tensile stress at rupture. The improvement increases as the ratio of the added OSA increases but at a certain optimum ratio 15% there is a decrease in the tensile stress at rupture. However, this decrease is better than the value of the neat CPVC. For the neat CPVC the lowest value of tensile stress at rupture 20 MPa was measured. Addition of OSA to CPVC had relatively strong impact on the tensile stress at rupture at levels of 5% (37 MPa), 10% (42% MPa), and 15% (45 MPa). When the proportion of OSA was increased by more than 15%, the filler had relatively negative impact on the tensile stress at rupture at levels of 20% (39 MPa), 25% (33 MPa), and 30% (29 MPa). Yet, the addition of the OSA to CPVC polymer matrix always gave an improvement to the tensile stress at rapture whatever the ratio is compared to the neat CPVC value.
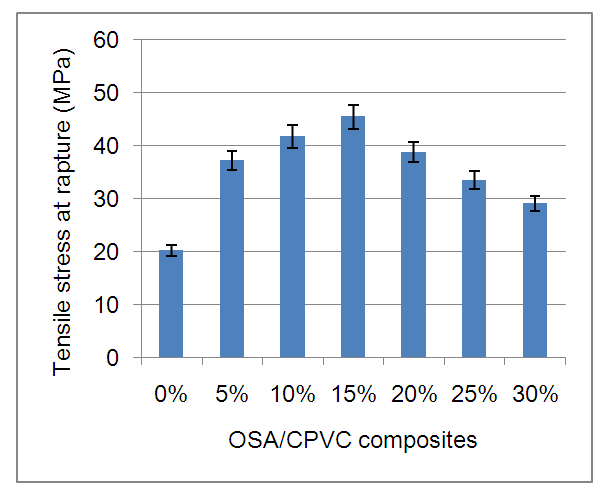
Figure 3. Tensile stress at rupture of the neat CPVC and OSA/CPVC polymer composite
The tensile stress at rupture for the unfilled CPVC showed the lower value than the filled polymer composite. This was because of the de-bonding of OSA particles did not occur before the plastic deformation or in the ductile elongation region of the CPVC matrix. We expect that the bond strength between OSA and CPVS is higher than the strength essential for the ductile elongation of the polymer matrix, so that the elastic deformation is not break up by de-bonding of OSA filler which leads to void creation [34].
Tensile strain at yield
While adding OSA to CPVC increased the tensile strain at yield, it decreased tensile strain when oil shale ash level exceeded 20%, Figure 4. For the neat CPVC, the value of the tensile strain at yield 22% was measured. Addition of OSA to CPVC had relatively some impact on the tensile strain at yield at levels of 5% (27%), 10% (27%), and 15% (30%). When the proportion of OSA to CPVC was increased by more than 15%, the value of tensile strain at yield decreased at levels of 20% (20%), 25% (19%), and 30% (17%).
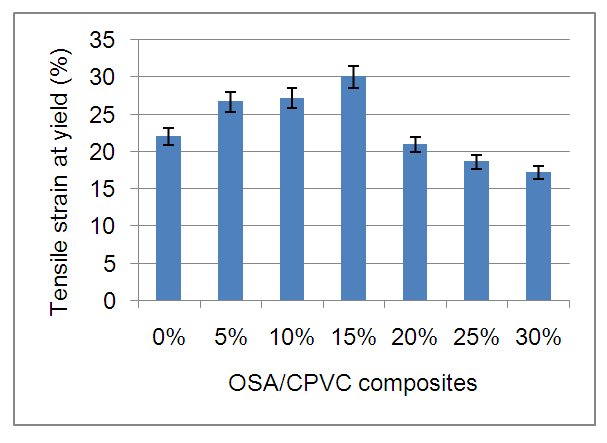
Figure 4. Tensile strain at yield of the neat CPVC and OSA/CPVC polymer composite
Tensile strain at break
Tensile strain at break is the percentage derived from the increase within the length of a specimen beneath stress while the specimen breaks relative to its initial length, some materials could be break pointedly (brittle) whereas some others can deform or elongate before breaking. Tensile strain at break is a measurement of the resistance to a modification in form of a plastic specimen [33]. Tensile strain at break (%) of the manufactured OSA/CPVC polymer composite of the OSA in different weight ratio is shown in Figure 5. Tensile strain at break for neat CPVC was 27%, addition of OSA to CPVC had relatively minor impact on the tensile strain at break at levels of 5% (29%), 10% (30%), and 15% (32%). When the proportion of the OSA to CPVC was increased by more than 15%, the value of the tensile strain at break decreased to 20%, 19% and 18% for filler loading level 20%, 25% and 30%, respectively.
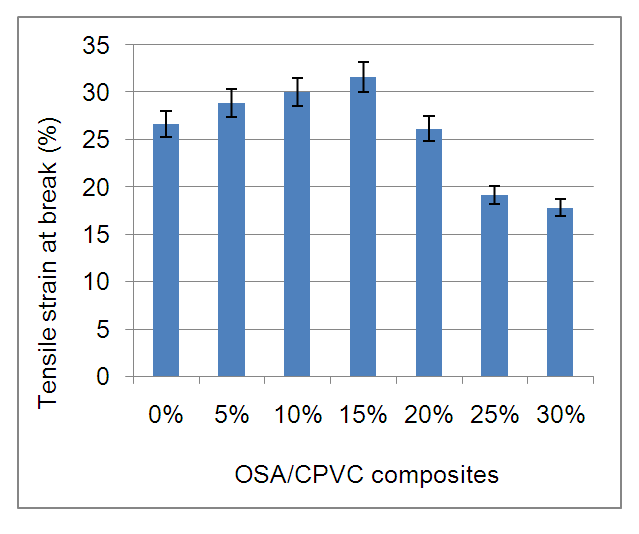
Figure 5. Tensile strain at break of the neat CPVC and OSA/CPVC polymer composite
The strain at yield and at break of the composite may attributed to the interfacial interaction between the OSA and CPVC matrix which contributes well to a proper adhesion and control the debonding process. This validates the OSA particles transfer the stress and stabilizes the fracture at the early stage of the deformation. The OSA fillers would ease the motion of the CPVC chains which led to the delay in plastic deformation of the CPVC after the debonding occurs [35].
Young’s modulus (MPa)
Young’s modulus is the ratio of the stress to strain and is a measurement of the materials resistance to elastic deformation [36]. For the neat CPVC, the value of Young’s modulus 477 MPa was measured. When OSA is added by 5, 10, 15% to CPVC the Young’s modulus increased to 545, 592 and 663 MPa, respectively. For 20, 25 and 30% OSA addition to the polymer composite, the Young’s modulus was measured 633, 520 and 430 MPa, respectively.
Young’s modulus results pointed out that adding OSA to CPVC significantly increased Young’s modulus Figure 6. The Young’s modulus improved as the ratio of the added OSA is raised, but at a certain ratio there was a decrease in the value of the Young’s modulus. However, this decrease is better than the value of the neat CPVC except for the ratio of 30% OSA, where the lowest value was measured. It is reported that while the Young's modulus of crystalline material was not sensitive to filler load, amorphous materials were highly affected by the filler load. The polymer chain mobility and the intermolecular movements become more hard in the polymer structure, thus increasing the elastic modulus. At high filler load 30% the decrease in modulus my attribute to agglomeration phenomenon which makes poor dispersion between the filler and polymer. a higher Young’s modulus manifests high stretch ability of the composite prior to experience permanent deformation keeping a good stiffness [37].
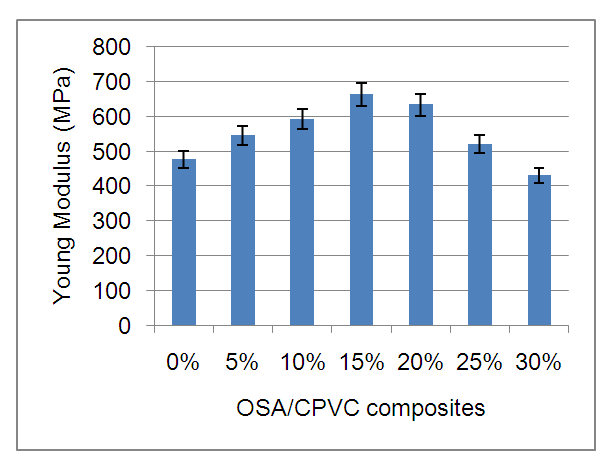
Figure 6. Young’s Modulus of the neat CPVC and OSA/CPVC polymer composite

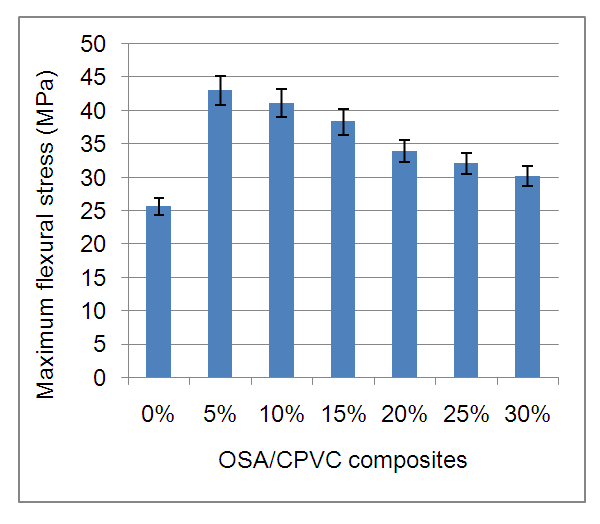
3.3. Flexural Strength

Maximum flexural stress
For the neat CPVC, the lowest value of maximum flexural stress 26 MPa was measured, Figure 7. Addition of the OSA to CPVC had relatively high impact on the maximum flexural stress at 5% (43 MPa), the highest of all tested sample. After this increase in the maximum flexural stress, we noticed that when the OSA is added in higher proportions, the observed maximum flexural stress values were 41 MPa, 38 MPa, 34 MPa, 32 MPa, and 30 MPa for 10%, 15%, 20%, 25% and 30%, respectively. However, the observed decrease in these values was better than that of the maximum flexural stress of the neat CPVC.
Figure 7. Maximum flexural stress of the neat CPVC and OSA/CPVC polymer composite
Flexural strain of maximum force
For the neat CPVC, the value of the flexural strain of maximum force 1.0% was measured. Addition of OSA to the CPVC had relatively minor improvement on flexural strain of maximum force Figure 8. We noticed that when the OSA is added in higher proportions, the observed flexural strain of maximum force values was 0.9% and 0.7% for 25% and 30% OSA filled CPVC, respectively.
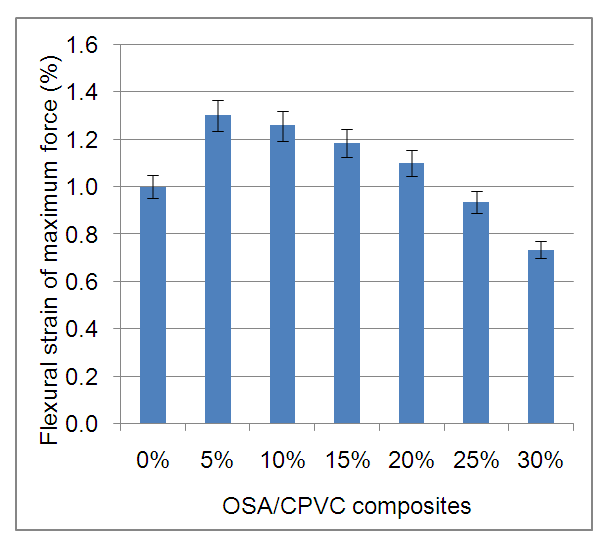
Figure 8. Flexural strain of maximum force of the neat CPVC and OSA/CPVC polymer composite
Flexural modulus
The flexural modulus measures the resistance in bending of a specific material and cross-sectional when placed under stress [38]. Adding the OSA to the CPVC significantly increased the flexural modulus but at a certain ratio there was a decrease in the value of the modulus. However, this decrease is better than the value of the neat CPVC as shown in Figure 9.
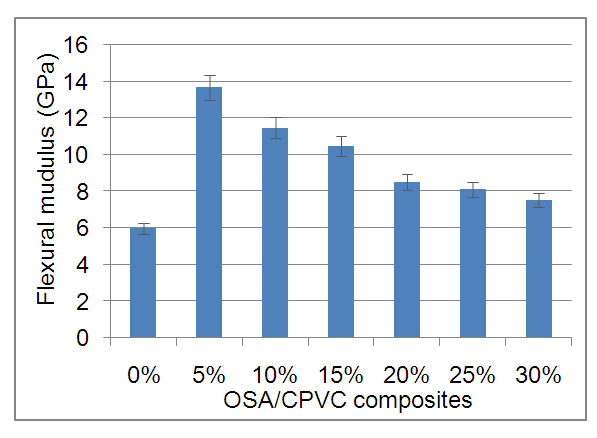
Figure 9. Flexural modulus of the neat CPVC and OSA/CPVC polymer composite
The addition of the OSA fillers to CPVC polymer composites improved the flexural properties, especially when the particle size is small so that the particle surface area is large, which contribute to a high surface energy at the filler-matrix interface. It is expected that the OSA filler with high surface area would assist to capture the polymeric molecular chain on their surfaces. Small OSA particle size would induce good physical interaction and contact area, thus boost the interfacial adhesion between the OSA and CPVC. Furthermore, rigid filler particles could withstand higher applied stress. While agglomerated OSA filler would restrict macromolecular chain motion and speed up crack growth, uniformly dispersed OSA particles assumed to delay crack growth by stress distribution which would significantly improve the flexural behavior of the composite material [39].

3.4. Water Absorption

An increase in water uptake of the OSA/CPVC composites may enhance the loss of the mechanical properties which would restrict their end use. Water absorption versus soak time of OSA/CPVC polymer composite of different filler contents is shown in Figure 10. Small-scale water uptake elevation was often noticed at the early days of immersion in water. Water uptake then systematically decline until impregnation was attained after 25 days, where equilibrium is reached, for most composite formulations. While neat CPVC showed maximum water absorption of 0.76%, 30% OSA filled CPVC polymer showed a maximum water uptake of 2.19%. Accordingly, the observed composite water absorption increased by an average of two folds compared to the neat CPVC polymer.
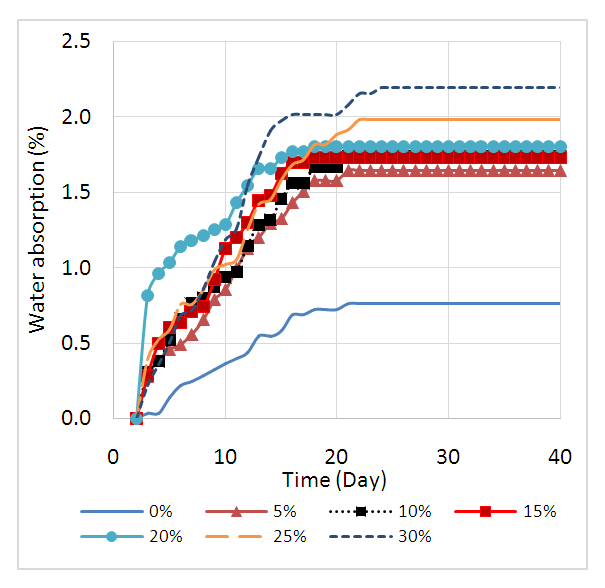
Figure 10. Variation of water absorption (%) of OSA/CPVC composite with various OSA content (%) versus time (day)
The water uptake behavior of the OSA filled CPVC deviated from that of the neat CPVC, and the variation was obvious at the filler high weight fraction. The matrix free volume controlled the water diffusion, but after water reached the OSA particles, the hydration developed and water uptake increased until equilibrium is reached. The particle interspacing gap, at OSA low loading level, was larger than that of at high loading level, so water filled the free volume and interrelate with the CPVC matrix before reaching the OSA particle. However, as the soak time increased, the absorbed water might begin to react with the OSA particles, so more water was needed for this interaction and increased the water uptake. The water uptake of the filled polymer matrix was higher than the equilibrium water uptake of the neat CPVC. Henceforth, for high OSA content, the particles interspacing gap was smaller than that of the low loaded OSA content. Nevertheless, as the time for water to reach the OSA particle was shorter than that of the low loaded OSA composite, the absorbed water was directly approached and encountered by the OSA particles. Subsequently, water uptake occurred quickly with higher magnitude compared to that of the neat CPVC polymer. The present finding was in good agreement with previously published work by S. Sugiman et al. [40].

3.5. Fractured Surface Morphology

The fractured surfaces of OSA/CPVC polymer composites were examined by SEM and shown in Figures 11 (A-G). Interfacial tension between CPVC polymer matrix and the OSA filler is very important in determining the composite phase morphology. The good interfacial adhesion between the filler the polymer was observed and evidenced by less filler pullout and cavities. The morphology of the filler at all loading levels (5%-30%) as seen in (Figures 11 B-G) differs from that of the neat CPVC polymer (Figure 11 A). Low level of OSA filler pullout from the matrix CPVC polymer was observed and considered as an evidence for good interfacial adhesion between the two phases, OSA and CPVC, in the composite. In another words, the presence of voids due to filler de-bonding is less pronounced in the polymer composite Consequently, an improvement in the impact, tensile and flexural properties of the OSA/CPVC composite was noticed compared to that of neat CPVC.
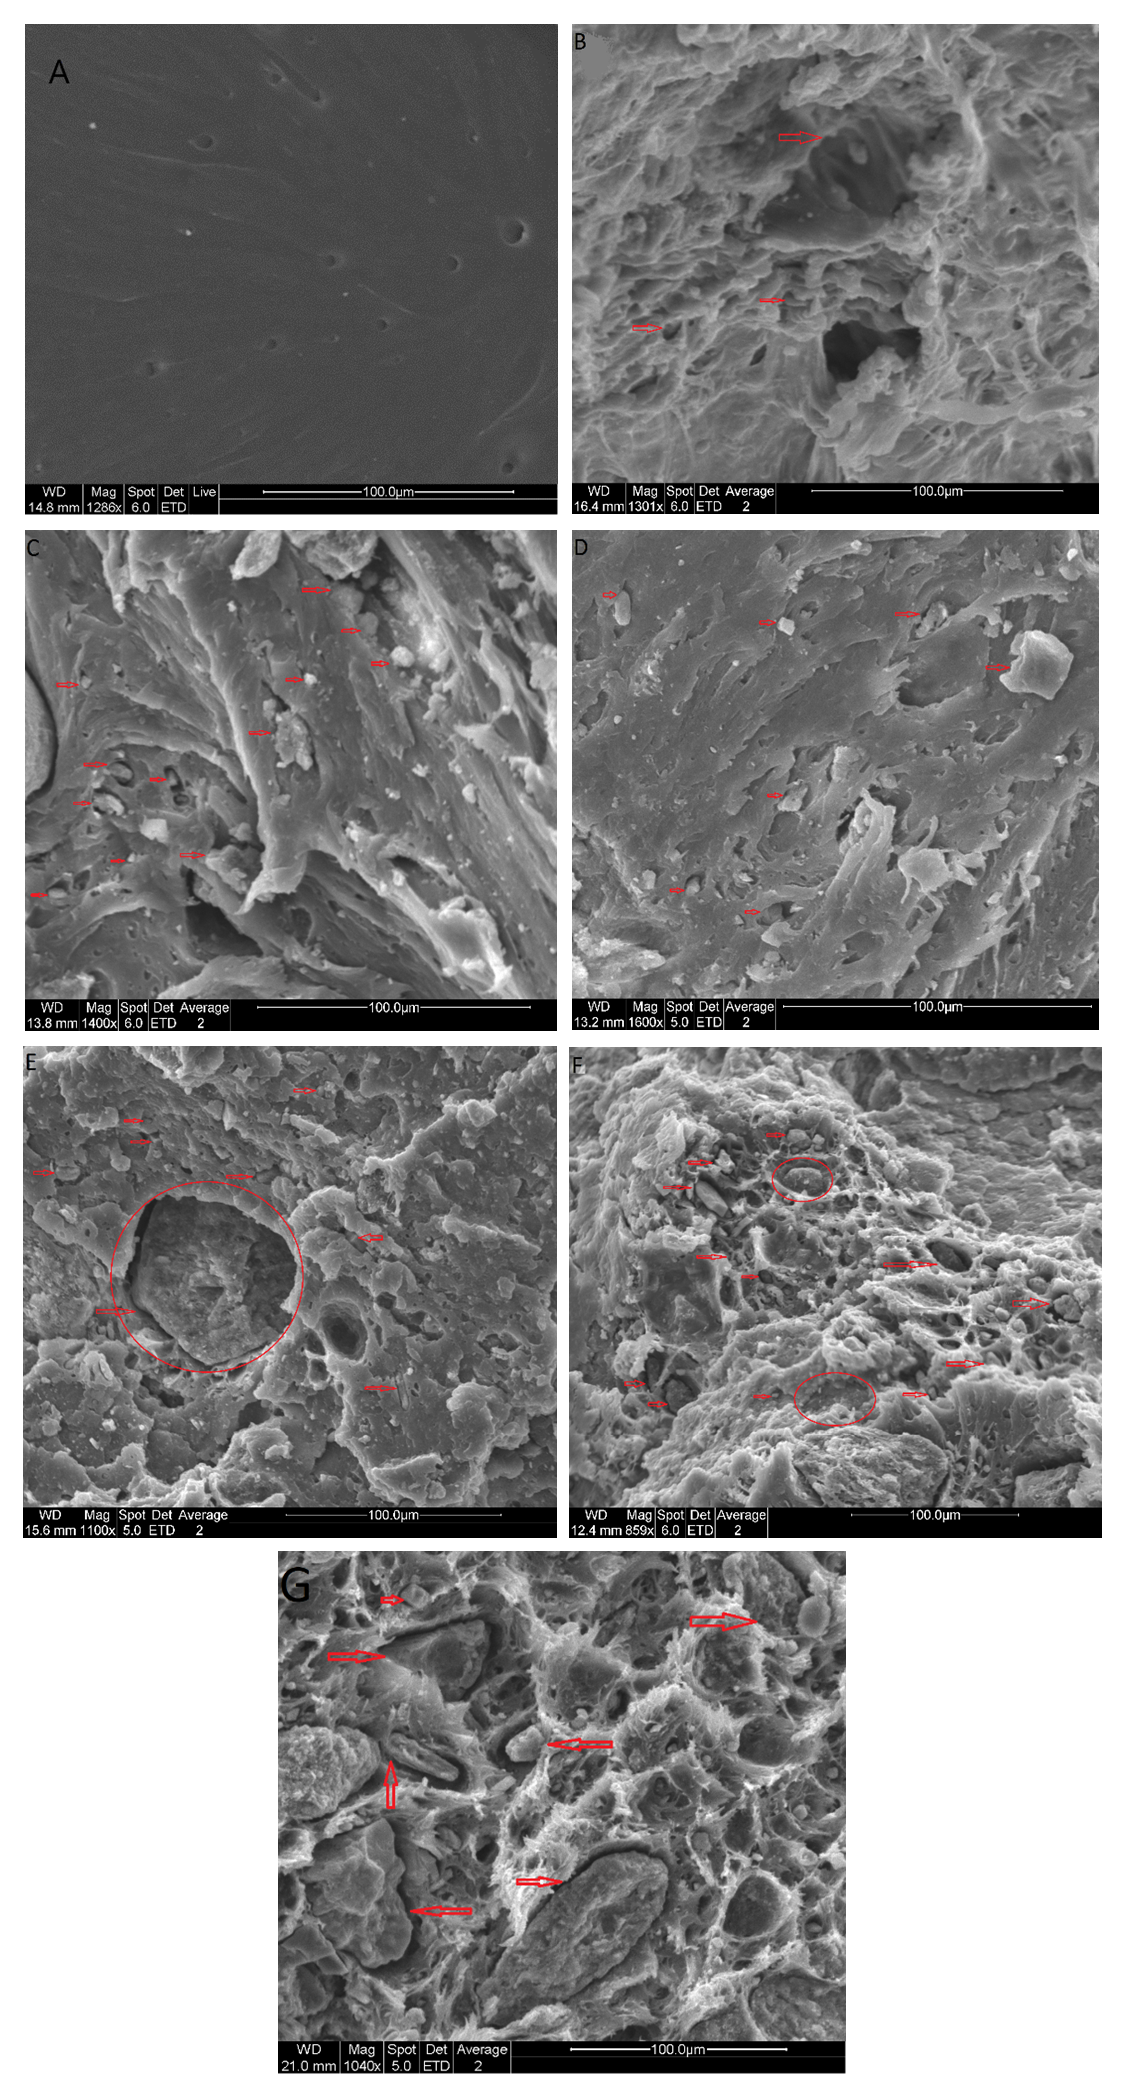
Figure 11. SEM micrographs of the tensile fractured specimens of OSA/CPVC composite at different filler contents (A) 0, (B) 5, (C) 15, (D) 20, (E) 25 and (G) 30 wt.%

4. Conclusions

The addition of the 5% to 30% OSA filler to CPVC polymer matrix significantly improved the impact strength of OSA/CPVC composite material by 77% to 35% respectively. The tensile and flexural stress at yield, stress at rupture, strain at yield, and strain at break increased with the addition of OSA. All these increases can be attributed to the significant interfacial adhesion between the OSA and the CPVC polymer matrix. The good dispersion of the OSA filler clearly appeared at the low loading level of 5% to 15% of the OSA filler. The composition of 5%-15% OSA filled CPVC polymer composite is considered as the optimum range in respect to all the properties measured in this study, where an optimum mechanical values are obtained. This improved dispersion, which has been seen in SEM micrographs, enhances the interfacial adhesion between the filler and the polymer matrix. The addition of OSA to neat CPVC did result in a marginal increase in water absorption. Finally, the addition of OSA to CPVC makes it more environmentally friendly product. In particular, this composite can be viewed as an alternative to conventional neat polymers in the production of superior composite material of lower cost.

References

[1]  Bailey, M. P. “Advanced polymer recycling.” Chemical Engineering, 121(3), 17, 2014.
[2]  Zhou, R., Huang, B., Ding, Y., Li, W., & Mu, J. “Thermal decomposition mechanism and kinetics study of plastic waste chlorinated polyvinyl chloride.” Polymers, 11(12), 2080, 2019.
[3]  Liu, J., Shimanoe, H., Ko, S., Lee, H., Jo, C., Lee, J., ... & Yoon, S. H. “Highly chlorinated polyvinyl chloride as a novel precursor for fibrous carbon material.” Polymers, 12(2), 328, 2020.
[4]  Merah, N., Saghir, F., Khan, Z., & Bazoune, A. “A study of frequency and temperature effects on fatigue crack growth resistance of CPVC. Engineering fracture mechanics,” 72(11), 1691-1701, 2005.
[5]  Merah, N., Bazoune, A., Fazal, A., & Khan, Z. “Weathering degradation mechanisms of chlorinated PVC. International Journal of Plastics Technology,” 17(2), 111-122, 2013.
[6]  Merah, N., Bazoune, A., & Khan, Z. (2013). “Artificial and natural weathering of chlorinated polyvinyl chloride (CPVC).” In Advanced Materials Research (Vol. 652, pp. 1277-1282). Trans Tech Publications Ltd.
[7]  Joseph, P., & Ebdon, J. R. “Recent developments in flame-retarding thermoplastics and thermosets.” Fire retardant materials, 1, 220-263, 2000.
[8]  Gugouch, F., Sandabad, S., Mouhib, N., En-Naji, A., & El Ghorba, M. (2019). Damage Prediction of CPVC Based on Energy Method at Different Temperatures. In Key Engineering Materials (Vol. 820, pp. 179-187). Trans Tech Publications Ltd.
[9]  Luo, P., Wen, S., Prakashan, K., Zhang, Z. X., Sinha, T. K., & Kim, J. K. “Physico-mechanical properties of NBR/CPVC blend vulcanizates and foams.” Journal of Vinyl and Additive Technology, 25(2), 182-188, 2019.
[10]  Kim, J., Lee, J., Jo, C., & Kang, C. “Development of low cost carbon fibers based on chlorinated polyvinyl chloride (CPVC) for automotive applications.” Materials & Design, 204, 109682, 2021.
[11]  Waples, D. W. (2013). Geochemistry in petroleum exploration. Springer Science & Business Media.
[12]  Philp, R. P., & Calvin, M. “Possible origin for insoluble organic (kerogen) debris in sediments from insoluble cell-wall materials of algae and bacteria.” Nature, 262(5564), 134-136, 1976.
[13]  Pihu, T., Konist, A., Puura, E., Liira, M., & Kirsimae, K. “Properties and environmental impact of oil shale ash landfills.” Oil shale, 36(2), 257-271, 2019.
[14]  Reinik, J., Irha, N., Koroljova, A., & Meriste, T. “Use of oil shale ash in road construction: results of follow-up environmental monitoring.” Environmental monitoring and assessment, 190(2), 1-16, 2018.
[15]  Irha, N., Uibu, M., Jefimova, J., Raado, L. M., Hain, T., & Kuusik, R. “Leaching behaviour of Estonian oil shale ash-based construction mortars.” Oil Shale, 31(4), 394, 2014.
[16]  Winkler, H. “Closed-loop production systems—A sustainable supply chain approach.” CIRP Journal of Manufacturing Science and Technology, 4(3), 243-246, 2011.
[17]  Sibanda, V., Ndlovu, S., Dombo, G., Shemi, A., & Rampou, M. “Towards the utilization of fly ash as a feedstock for smelter grade alumina production: a review of the developments.” Journal of Sustainable Metallurgy, 2(2), 167-184, 2016.
[18]  Pitman, R. M. “Wood ash use in forestry–a review of the environmental impacts. Forestry:” An International Journal of Forest Research, 79(5), 563-588, 2006.
[19]  Lanzerstorfer, C. “Fly ash from coal combustion: Dependence of the concentration of various elements on the particle size.” Fuel, 228, 263-271, 2018.
[20]  Al-Otoom, A. Y., Shawabkeh, R. A., Al-Harahsheh, A. M., & Shawaqfeh, A. T. “The chemistry of minerals obtained from the combustion of Jordanian oil shale.” Energy, 30(5), 611-619, 2005.
[21]  Aljbour, S. H. “Production of ceramics from waste glass and Jordanian oil shale ash.” Oil shale, 33(3), 2016.
[22]  Sharo, A. A., Ashteyat, A. M., Alawneh, A. S., & Khaled, B. A. B. “The use of oil shale fly ash to improve the properties of Irbid soil.” World Journal of Engineering, 2018.
[23]  Raado, L. M., Hain, T., Liisma, E., & Kuusik, R. “Composition and properties of oil shale ash concrete.” Oil shale, 31(2), 2014.
[24]  Shawabkeh, R., Al-Harahsheh, A., Hami, M., & Khlaifat, A. “Conversion of oil shale ash into zeolite for cadmium and lead removal from wastewater.” Fuel, 83(7-8), 981-985, 2004.
[25]  Wang, W., Cheng, Y., Tan, G., Liu, Z., & Shi, C. “Laboratory investigation on high-and low-temperature performances of asphalt mastics modified by waste oil shale ash.” Journal of Material Cycles and Waste Management, 20(3), 1710-1723, 2018.
[26]  Asi, I., & Assa’ad, A. “Effect of Jordanian oil shale fly ash on asphalt mixes.” Journal of Materials in Civil Engineering, 17(5), 553-559, 2005.
[27]  Gorokhovskii, A. V., Gorokhovskii, V. A., Mescheryakov, D. V., & Kopchekchi, A. A. “Glass ceramics based on oil shale ash.” Glass and ceramics, 59(5), 191-193, 2002.
[28]  Thomas, S., Joseph, K., Malhotra, S. K., Goda, K., & Sreekala, M. S. (Eds.). (2012). Polymer composites, macro-and microcomposites (Vol. 1). John Wiley & Sons.
[29]  Oja, V., Elenurm, A., Rohtla, I., Tearo, E., & Tali, E. “Thermal processing of polyvinylchloride waste with oil shale ash to capture chloride.” Oil Shale, 25(2), 2008.
[30]  Abo Elfettouh, A. E. M. A., Haroun, A. A. A., RABIE, A. G. M., Ali, G. A. M., & Abdelrahim, M. Y. M. “Improving the mechanical and thermal properties of chlorinated poly (vinyl chloride) by incorporating modified CaCO3 nanoparticles as a filler.” Turkish Journal of Chemistry, 43(3), 750-759, 2019.
[31]  Kim, J., Lee, J., Jo, C., & Kang, C. “Development of low cost carbon fibers based on chlorinated polyvinyl chloride (CPVC) for automotive applications.” Materials & Design, 204, 109682, 2021.
[32]  Gupta, N., Brar, B. S., & Woldesenbet, E. “Effect of filler addition on the compressive and impact properties of glass fibre reinforced epoxy.” Bulletin of Materials Science, 24(2), 219-223, 2001.
[33]  Davis, J. R. (Ed.). (2004). Tensile testing. ASM international.
[34]  Ahmad, I., & Mahanwar, P. A. “Mechanical properties of fly ash filled high density polyethylene.” Journal of m inerals and materials characterization and engineering, 9(03), 183, 2010.
[35]  Wang, K., Wu, J., Ye, L., & Zeng, H. “Mechanical properties and toughening mechanisms of polypropylene/barium sulfate composites.” Composites Part A: Applied Science and Manufacturing, 34(12), 1199-1205, 2003.
[36]  Pelleg, J. (2012). Mechanical properties of materials (Vol. 190). Springer Science & Business Media.
[37]  Zhu, J., Abeykoon, C., & Karim, N. “Investigation into the effects of fillers in polymer processing.” International Journal of Lightweight Materials and Manufacture, 4(3), 370-382, 2021.
[38]  Mandal, T., Edil, T. B., & Tinjum, J. M. “Study on flexural strength, modulus, and fatigue cracking of cementitiously stabilised materials.” Road Materials and Pavement Design, 19(7), 1546-1562, 2018.
[39]  Kundie, F., Azhari, C. H., Muchtar, A., & Ahmad, Z. A. “Effects of filler size on the mechanical properties of polymer-filled dental composites: A review of recent developments.” Journal of Physical Science, 29(1), 141-165, 2018.
[40]  Sugiman, S., Salman, S., & Maryudi, M. “Effects of volume fraction on water uptake and tensile properties of epoxy filled with inorganic fillers having different reactivity to water.” Materials Today Communications, 24, 101360, 2020.