-
Paper Information
- Previous Paper
- Paper Submission
-
Journal Information
- About This Journal
- Editorial Board
- Current Issue
- Archive
- Author Guidelines
- Contact Us
International Journal of Composite Materials
p-ISSN: 2166-479X e-ISSN: 2166-4919
2017; 7(6): 161-170
doi:10.5923/j.cmaterials.20170706.02

Inter-ply Friction of Unidirectional Tape and Woven Fabric Out-of-autoclave Prepregs
 Abstract
 Reference
 Full-Text PDF
 Full-text HTML
Harinderpal Singh Grewal, Mehdi Hojjati
Concordia Centre for Composites, Concordia University, Montreal, Quebec, Canada
Correspondence to: Mehdi Hojjati, Concordia Centre for Composites, Concordia University, Montreal, Quebec, Canada.
| Email: |  |
Copyright © 2017 Scientific & Academic Publishing. All Rights Reserved.
This work is licensed under the Creative Commons Attribution International License (CC BY).
http://creativecommons.org/licenses/by/4.0/

This paper describes experimental measurements and modelling of friction between two plies of out-of-autoclave thermoset prepregs with different fiber structures including unidirectional, 8-Harness and 5-Harness satin prepregs. Effects of four parameters including temperature, pressure, forming rate and fabric orientation were studied. Results show that the temperature is the most influencing processing parameter due to resin viscosity reduction. For the same processing conditions, unidirectional prepreg has the maximum friction followed by 8-Harness and 5-Harness prepregs. Fabric orientation has effect on interply friction. For fabrics, friction is symmetric with respect to the fabric orientation 45° due to fiber architecture symmetry. For unidirectional prepreg, the friction decrease from fabric orientation 0° to 90°. A friction model was developed based on the linear relationship between friction coefficient and Hersey number which could be used to predict coefficient of friction for any set of processing conditions (temperature, pulling rate, normal pressure) at any fabric orientation.
Keywords: Forming, Prepreg, Out of autoclave processing, Inter-ply Friction, Hersey Number
Cite this paper: Harinderpal Singh Grewal, Mehdi Hojjati, Inter-ply Friction of Unidirectional Tape and Woven Fabric Out-of-autoclave Prepregs, International Journal of Composite Materials, Vol. 7 No. 6, 2017, pp. 161-170. doi: 10.5923/j.cmaterials.20170706.02.
Article Outline
1. Introduction
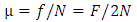
- With the advancement in the technology, composite materials are replacing metals in more and more sectors of aerospace and automobile industries. Their superior properties like high specific stiffness, high strength to weight ratio, low thermal expansion, and corrosion resistance make them more versatile. Composite materials basically consist of fibre reinforcements bonded together with a matrix material. Composite structures allow the strength and stiffness of the material to be controlled with the direction of loading.The increasing demand of composite materials in aerospace industry has resulted in great developments in the field of composites with the improvement in automated manufacturing technologies and materials used. It has become a necessity for aerospace industries to improve their manufacturing methods to achieve less manufacturing time and less cost to meet the present needs. From traditional way of hand lay-up to advanced manufacturing techniques like Automated Tape Laying (ATL) or Automated Fiber Placement (AFP), a wide range of fabrication methods are available for making composite components. Traditional hand lay-up technique is very time consuming and labor intensive. Advanced techniques like ATL or AFP are more efficient way of laying-up for larger structures. For making smaller parts, AFP will lose its advantages because of the head size and speed reduction. One way to handle this deficiency is to use automated manufacturing techniques (ATL and AFP) to make flat preforms relatively fast. Then preforms are transferred to the forming units such as double-diaphragm forming machine to turn the flat stack of material to the final shape.Additionally, overall manufacturing cost can be reduced by avoiding autoclave based curing process. This need is satisfied by the use of Out-of-Autoclave (OOA) prepregs manufacturing technology. The use of out-of-autoclave (OOA) prepregs can reduce cost as well as production time. The OOA prepregs can be formed by the application of temperature and vacuum only, without the need of high pressure and thus, saving the expenses for costly autoclave. Void contents can be reduced in OOA prepregs by the use of tooling of appropriate type and identifying a maximum corner angle for a laminate of given thickness and a desired thickness uniformity [1].In thermoforming of composites many deformation mechanisms take place, such as intra-ply shear, inter-ply slippage, ply-bending, and intra-ply tensile loading [2-7]. Inter-ply slippage plays the most important role in forming of prepreg plies and deciding the quality of the final product [8-9]. Friction between different layers of prepreg plies is dominated by processing parameters like temperature, forming rate, and normal pressure. In addition, material properties such as fiber structure, resin viscosity and fiber tow thickness influence inter-ply friction.Forming of stack of prepregs needs all the plies to deform according to the shape of tool without causing any defect in the final component. Intraply shear deformation mechanism and interply slippage deformation mechanism dominate the process of forming, but this paper focuses only on slippage mechanism between adjacent plies. Various test methods were adopted by researchers to measure interply frictional forces and shear stresses [8-14]. Murtagh et al. used friction sled method in which composite specimen was sandwiched between two sheets of steel shim [12]. Scherer and Friedrich used pull-out test method in which individual ply was pulled out of the stack of plies [14]. Friction between prepregs can be considered as a combination of both Coulomb friction and hydrodynamic friction. Coulomb friction is governed according to the equation 1 in which f is the frictional force, µ is the coefficient of friction and N is the normal force to the friction interface.
 | (1) |
 | (2) |
 | (3) |
 | (4) |
2. Material and Test Methods
2.1. Material Selection and Specimen
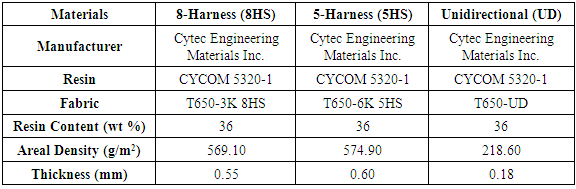
- The composite material selected for this research was Cytec engineered material. This prepreg material is called CYCOM 5320-1 system. It is an out-of-autoclave curing prepreg material. CYCOM 5320-1 is a newly developed out-of-autoclave material for automated manufacturing in aerospace industry [18, 19]. Due to the low temperature curing ability of this material, it can be used for prototyping where low cost and vacuum-bag-only curing is needed [19]. This composites material is suitable to be used in the primary structure of the aircrafts as it has the mechanical properties equivalent to the autoclave cured epoxy systems. Three different forms of this composite material were used which are unidirectional, 8-Harness satin, and 5-Harness satin carbon/epoxy prepreg materials. Table 1 shows the properties of the three different forms of CYCOM 5320-1 carbon/epoxy system.
|
2.2. Friction Test Rig
- To perform the interply friction tests, a test rig was designed and manufactured as shown in Figure 1. Test rig consists of a steel middle plate and two steel platens for applying normal pressure to prepreg plies. Six cartridge heaters and a thermocouple were inserted in the middle plate. Three cartridge heaters and a thermocouple were inserted in each platen. Temperature was controlled by using three controllers through feedback system. Four springs were used to apply normal pressure to prepreg plies. Springs were calibrated according to their force-displacement curves. Inner prepreg ply was clamped on the middle plate with the help of clamping plates. C-clamps were used to help clamping plates hold the prepreg material firmly. The middle plate was held in between two platens.
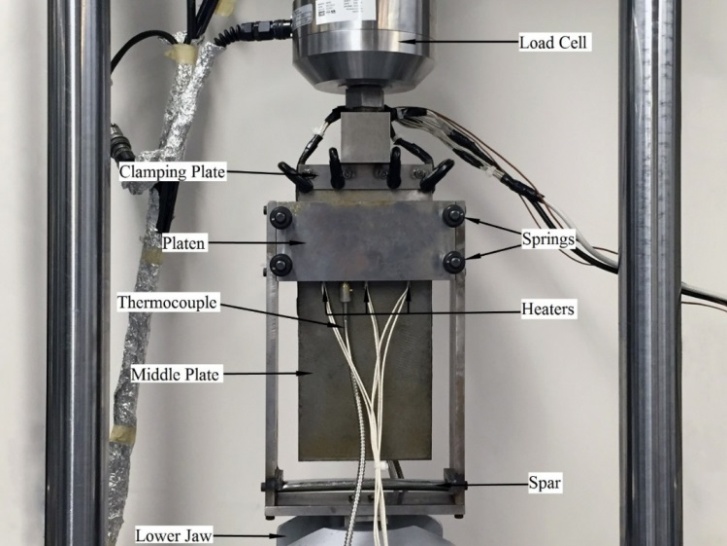 | Figure 1. Friction Test Rig |
 | (5) |
 | (6) |
3. Experiments
3.1. Processing Parameters and Their Ranges
- Determination of the processing parameters and their range depends on the forming technique. The forming process under investigation is the double diaphragm forming. In this process the laminate will be placed between two plastic or silicon rubbers bagging under vacuum which hold and compact the laminate for the forming process. Then heat applied to the material and under the controlled vacuum inside the tool, the material deforms and takes the final shape. The processing parameters will be heat (temperature), compaction force (level of vacuum between the plastic bags) and forming rate (controlled vacuum inside the tool). Next step is to determine the range of each processing parameters. Effect of temperature is to reduce the resin viscosity to decrease the friction. However, higher temperature makes the reaction get faster and curing accelerates. To find the processing window for temperature, DSC tests were performed. The dynamic runs were performed at rate of 2°C/min to monitor the difference in heat flow. The result is shown in Figure 2. The onset of reaction is about 100°C and therefore any forming operation has to be done at temperature lower that 100°C. Considering the manufacturer recommended cure cycle which propose the temperature of 93°C for 12 hours, it was decided to limit the forming temperature to maximum 90°C. To investigate further the temperature effect, rheometer was used to monitor the viscosity development during isothermal conditions. Three different temperatures 70°C, 90°C and 100°C were selected for this study. The results are shown in Figure 3. The results indicate that there is enough time for forming operation without having significant reaction. At 90°C, we have about two hours. Based on these observations, three temperatures 50°C, 70°C and 90°C were selected for the rest of the investigation.
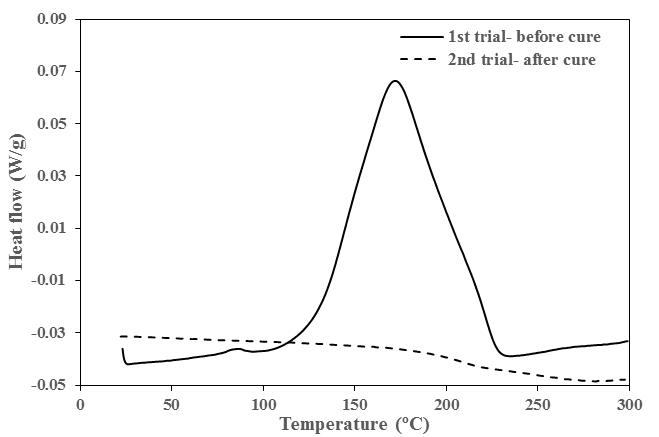 | Figure 2. Heat flow for prepreg at 2°C/min |
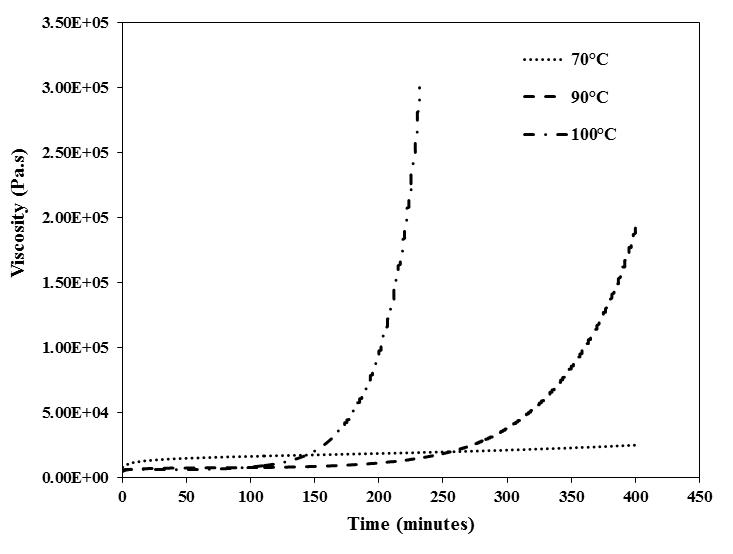 | Figure 3. Viscosity development at different temperatures |
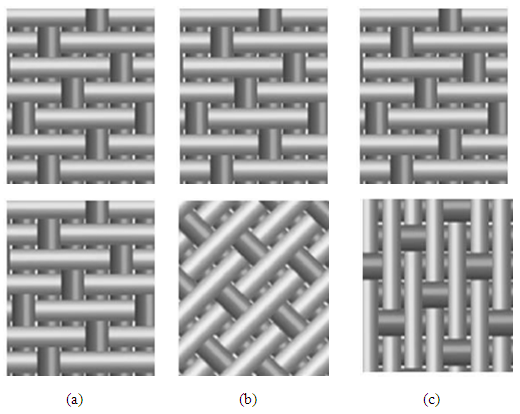 | Figure 4. Friction test between two 5-harnerss satin fabric at (a) 0° fabric orientation (b) 45° fabric orientation (c) 90° fabric orientation |
3.2. Experimental Method
- A pair of two samples was used in each test, i.e. inner and outer ply. Samples from 8-harness, 5-harness and unidirectional material were cut rectangular in shape. The inner prepreg ply was clamped on the middle plate with the help of clamping plates. The outer prepreg ply was placed over the inner ply between the two platens. The outer ply was mounted over a wide spar at the bottom of the test rig to ensure that it would not move when inner ply is pulled upwards. Figure 5 shows the start, mid and end of the friction test.
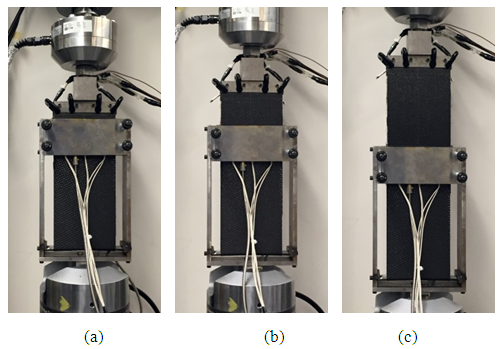 | Figure 5. (a) Start, (b) Mid and (c) End of the test |
4. Results and Discussion
4.1. Temperature Effect
- In order to facilitate the forming operation, these processes usually take place at high temperatures. To investigate the influence of operating temperature, tests were performed at a constant pulling rate of 0.5 mm/sec, a constant normal pressure of 0.5 atmosphere and fabric orientation at 0° to the pulling direction at different temperatures. All the three kinds of composite prepregs, 8HS, 5HS and UD, were analysed in the tests. Results are based on load-displacement graphs that were obtained from tensile testing machine at different conditions of test parameters. Figure 6 shows load-displacement graphs for 8HS at 50, 70 and 90°C to analyse the effect of processing temperature on inter-ply friction. The graphs show that frictional load measured by load cell reduces as the temperature increases from 50°C to 90°C. This is in agreement with the fact that the viscosity of resin decreases with the increase in temperature and resin changes from rubbery state to liquid state. According to the equation 2, shear stress is directly proportional to the viscosity of fluid. Therefore, force of friction is reduced at higher temperatures. The rheological tests show that with the rise in temperature resin viscosity reduces at initial stages while later it increases drastically [20]. The later rise in viscosity is due to the increase in degree of cure of the resin. In this study we are interested only in the initial stage as actual forming operation takes place during this period. As stated earlier, load-displacement graphs show high peak in the frictional load at the start of test and steady state afterwards.
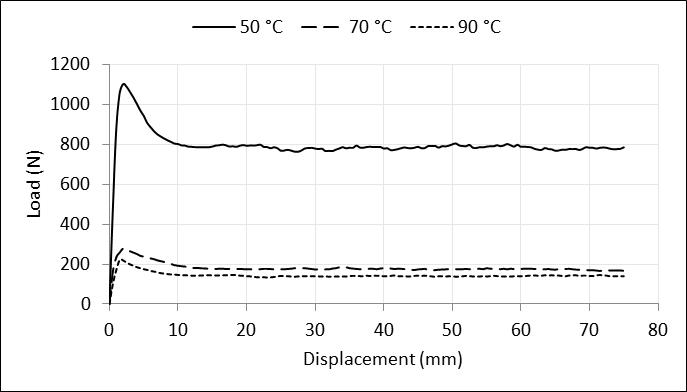 | Figure 6. Influence of temperature on Inter-Ply friction at 0.5 mm/sec, 0.5 atm and 0° fiber orientation for 8HS prepregs |
|
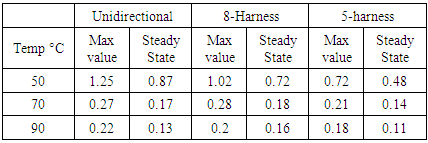
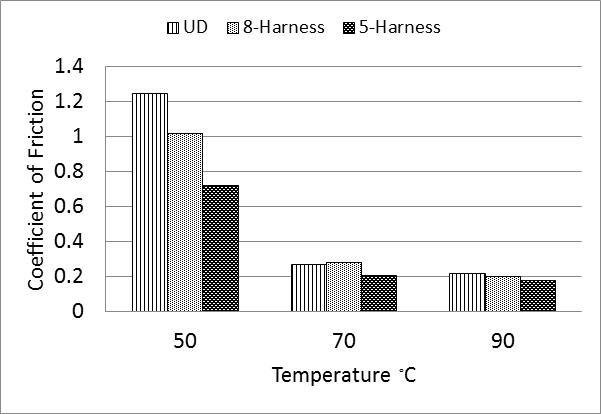 | Figure 7. Influence of temperature on coefficients of friction for UD, 8HS, and 5HS at 0.5 mm/sec, 0.5 atm and 0° fiber orientation |
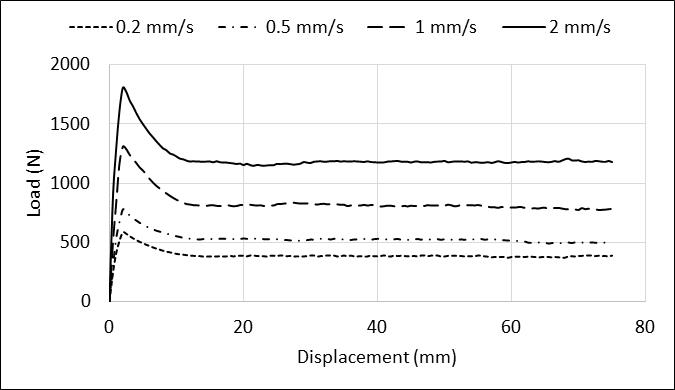
4.2. Influence of Pulling Rate
- Pulling rate during experiments represents the slippage speed of one prepreg ply over other. Tests were performed at a constant temperature of 50°C and a constant normal pressure of 0.5 atmosphere at different pulling rates. The tensile testing machine provided the different pulling rates. Fabric orientation was 0° in these experiments. Results were recorded from tensile testing machine at various conditions of test parameters. Figure 8 shows load-displacement graphs at 0.2, 0.5, 1 and 2 mm/sec, for 5HS, to investigate the influence of pulling rate on inter-ply friction. It could be noticed that these graphs have similar stick-slip peaks of dry-coulomb as they were in the graphs for elevated temperatures. The graphs show that frictional load increases as pulling velocity increases from 0.2 mm/sec to 2 mm/sec. This is in agreement with the fact that the shear stress between prepreg plies is directly proportional to the velocity of one ply with respect to other.
 | Figure 8. Influence of pulling rate on inter-ply friction at 50°C, 0.5 atm and 0° fabric orientation for 5HS prepregs |
|
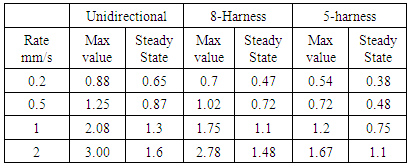
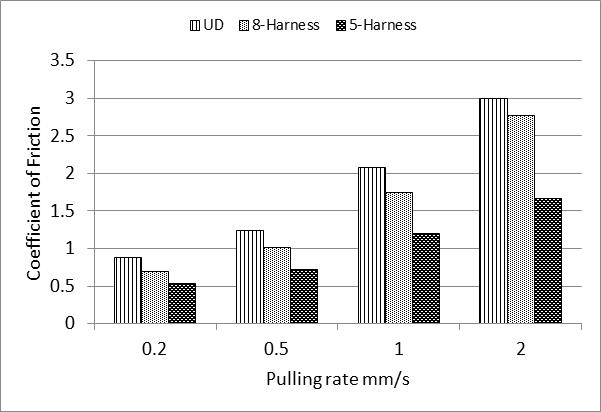 | Figure 9. Influence of pulling rate on coefficients of friction for UD, 8HS, and 5HS at 50°C, 0.5 atm and 0° fiber orientation |
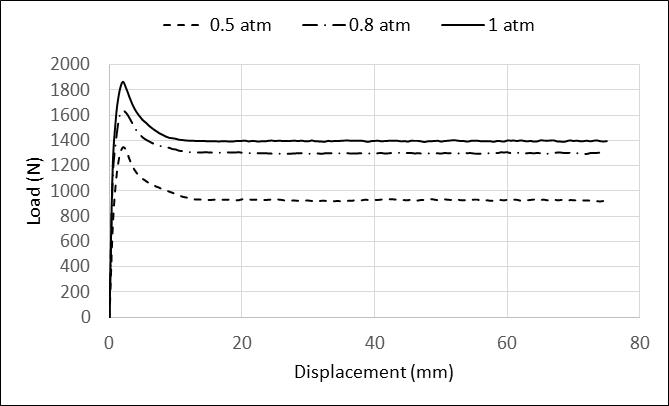
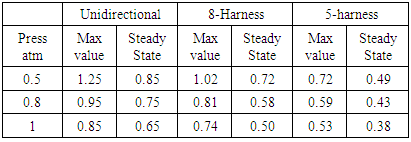
4.3. Effect of Normal Pressure (Compaction Force)
- Normal pressure in the thermoforming operations is essential to consolidate the prepreg plies with each other. To study the influence of normal pressure on Inter-Ply friction, tests were performed at a constant pulling rate of 0.5 mm/sec and a constant processing temperature of 50°C at different pressures on 8-harness satin, 5-harness satin and unidirectional carbon/epoxy prepregs. Plies were oriented at 0° to the direction of movement. Figure 10 shows load-displacement graphs at 0.5, 0.8 and 1 atmosphere for UD prepregs. The results show that frictional load increases as the pressure increases from 0.5 to 1 atm.
 | Figure 10. Influence of normal pressure on inter-ply friction at 50°C, 0.5 mm/sec and 0° fiber orientation for UD prepregs |
|
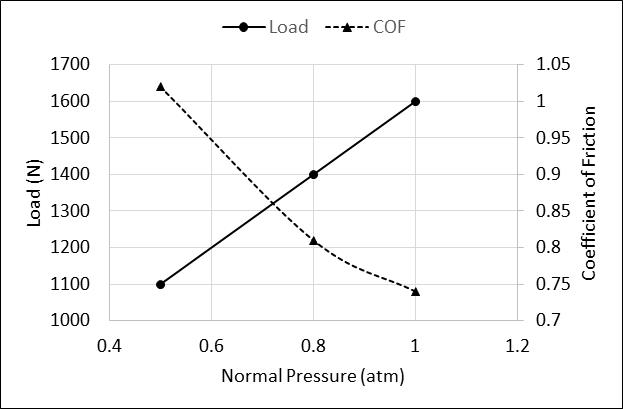 | Figure 11. Relationship between Load, Normal Pressure and Friction Coefficient for 8HS |
4.4. Fabric Orientation
- For a stack of laminate, the orientation of the fibers in each prepreg ply is very important to obtain desired mechanical properties. During forming operations, fiber orientation could affect the occurrence of wrinkles and other defects in the final product. To analyse the influence of fabric orientation, friction tests were performed at a constant normal pressure of 0.5 atmosphere, a constant temperature of 50°C and a varying pulling rate of 0.2 mm/sec, 0.5 mm/sec, 1 mm/sec and 2 mm/sec. The orientation of the fibers to the pulling direction was changed to study its influence on inter-ply friction. 8-harness, 5-harness and unidirectional carbon/epoxy prepreg composites were analysed in the tests. Results are based on load vs. pulling rate graphs that were obtained from tensile testing machine at different conditions of test parameters. Figure 12 shows load vs. pulling rate graphs for 8HS at 0°, 15°, 30° and 45° fabric angle to the direction of ply movement to analyse its effect on inter-ply friction (See Figure 4). The graphs show that frictional resistance decreases as fiber angle changes from 0° to some angle to the pulling direction. Force of friction decreases as the angle changes from 15° to 30° to 45°.
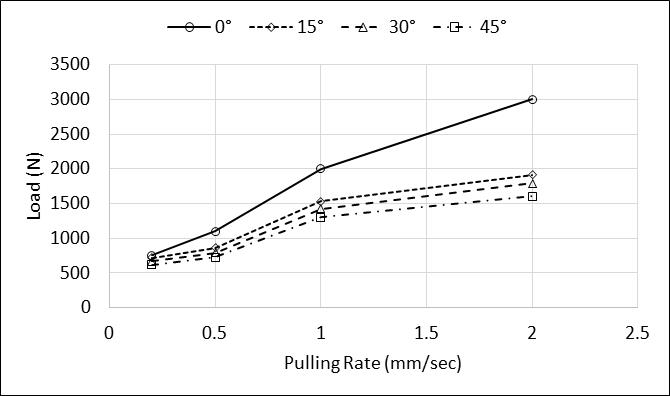 | Figure 12. Plot of load versus pulling rate for 8HS at different fiber orientations |
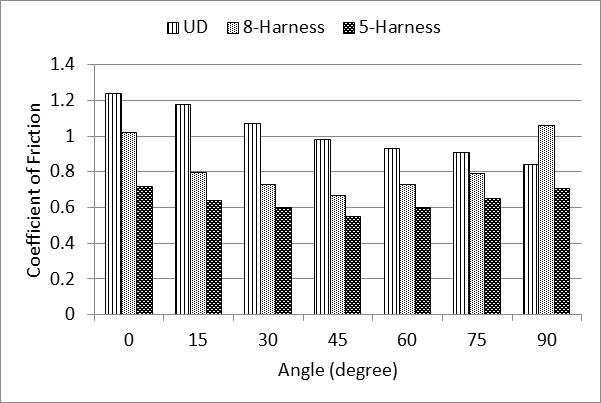 | Figure 13. Influence of fabric orientation on coefficients of friction for UD, 8HS, and 5HS at temperature 50°C, pulling rate 0.5 mm/s, and pressure 0.5 atm |
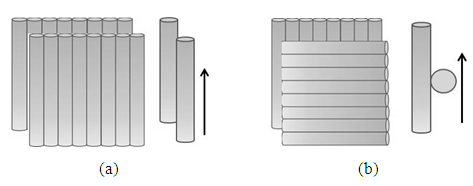 | Figure 14. Friction test between two unidirectional prepreg at (a) 0° fiber orientation with line contact between fibers (b) 90° fiber orientation with point contact between the fibers |
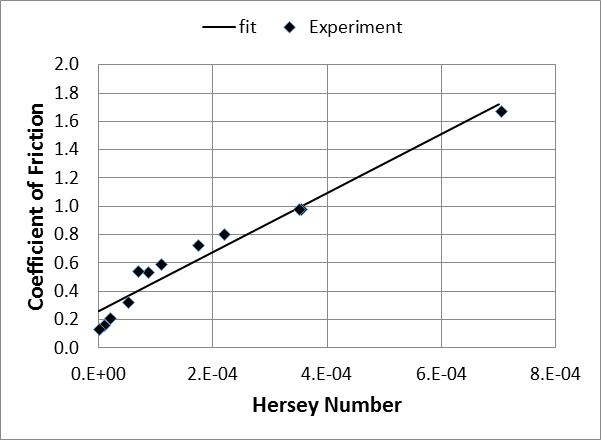
4.5. Stribeck Analysis
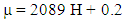
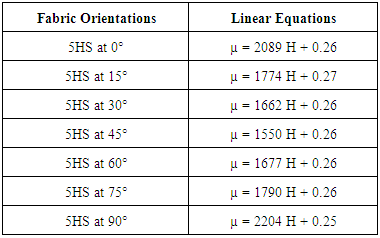
- The coefficient of friction is a function of various parameters including temperature, pressure, rate, and fabric orientation. For each set of processing conditions, experiment has to be performed to obtain the frictional force and subsequently the coefficient of friction. Having a model that can predict the coefficient of friction based on different processing condition and fabric orientation is useful, particularly for the forming simulation. To develop the analytical model for frictional behavior of prepreg plies, Hersey number can be calculated for each set of processing parameters [21-25]. Hersey number combines three processing parameters including viscosity (temperature), pressure, and forming rate into one characteristic number. Resin viscosity at different temperatures calculated using equation provided in [26]. Hersey numbers were plotted against coefficients of friction for 5HS as shown in Figure 15. The curves were fitted to the intersecting points of friction coefficients and Hersey numbers. It is observed from the Stribeck curves that coefficients of friction increases with the increase in Hersey numbers. The curve show that inter-ply friction of carbon/epoxy prepregs are hydrodynamic in nature as the slope of the curves are positive.
 | Figure 15. Experimental Stribeck curve for 5-harness satin carbon/epoxy prepreg oriented at 0° to the direction of slippage |
 | (6) |
|
 | (7) |
 | (8) |
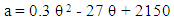
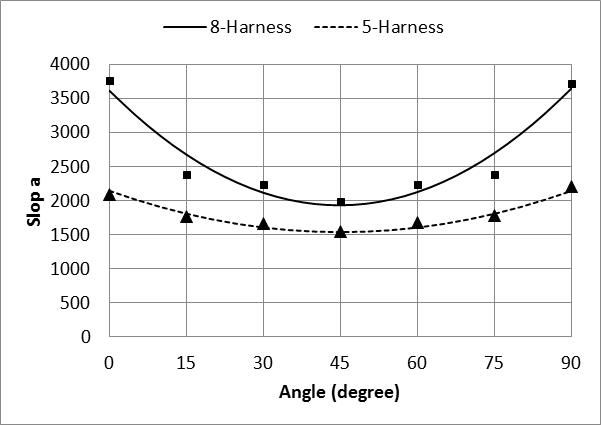 | Figure 16. Relationship between “a” and fabric angle “θ” for 8HS and 5HS |
 | (9) |
 | (10) |
|
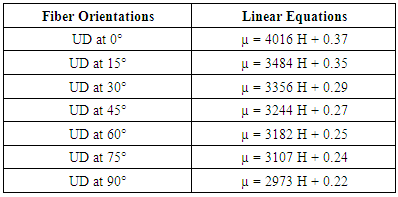
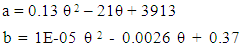 | (11) |
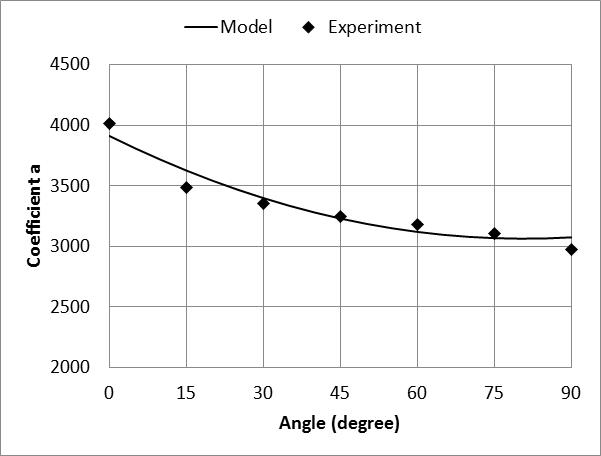 | Figure 17. Relationship between “a” and fiber angle “θ” for UD |
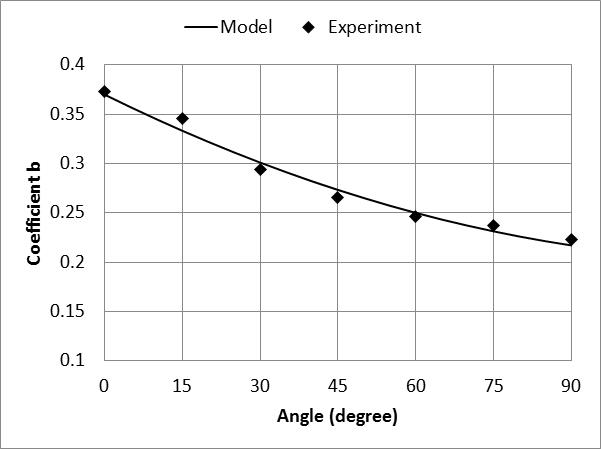 | Figure 18. Relationship between “b” and fiber angle “θ” for UD |
5. Conclusions
- The inter-ply friction behavior of 8-harness satin, 5-harness satin and unidirectional carbon/epoxy prepreg was investigated at different processing conditions using a friction test-rig developed for this study. Results show that temperature, pulling rate and normal pressure have different impacts on inter-ply friction. Increase in temperature and decrease in the pulling rate can enhance slipping between prepreg plies. Decrease in normal pressure is helpful in inter-ply slippage. The change in fiber orientation of the prepreg plies has influence on the frictional resistance between layers of the composite laminate. For woven fabric, the frictional resistance was found maximum at 0° fabric orientation and it decreases when orientation of fiber was changed to 15°, 30° and 45°. As the angle of warp yarn increases, the force of friction decreases and reached the minimum value as the warp fiber angle reaches 45°. From 45° to 90° the coefficient of friction increases again due to the fabric architecture symmetry. For UD, the coefficient of friction decreases from 0° to 90°. Stribeck curve analysis was used to predict the coefficient of friction using linear relationship between friction coefficient and Hersey number. Equations were developed that could be used to predict coefficient of friction for any set of processing conditions (temperature, pulling rate, normal pressure) at any fabric orientation.
ACKNOWLEDGEMENTS
- The authors would like to thank NSERC (Natural Sciences and Engineering Research Council of Canada) for financial support. The authors would also like to gratefully acknowledge Bombardier Aerospace for providing the material.