-
Paper Information
- Paper Submission
-
Journal Information
- About This Journal
- Editorial Board
- Current Issue
- Archive
- Author Guidelines
- Contact Us
International Journal of Composite Materials
p-ISSN: 2166-479X e-ISSN: 2166-4919
2017; 7(2): 46-50
doi:10.5923/j.cmaterials.20170702.02

Electrical and Mechanical Properties of ZnO/(UPE-PMMA) Blend Nanocomposites
 Abstract
 Reference
 Full-Text PDF
 Full-text HTML
Fadhil K. Farhan1, Zainab AL- Ramadhan2, Widad A. Abd-AL Hussein2
1Ministry of Science and Technology, Baghdad, Iraq
2Department of Physics, College of Education, Al- Mustansiriyah University, Baghdad, Iraq
Copyright © 2017 Scientific & Academic Publishing. All Rights Reserved.
This work is licensed under the Creative Commons Attribution International License (CC BY).
http://creativecommons.org/licenses/by/4.0/

Electrical and mechanical properties of the blend un saturated polyester – poly methyl methacrylate (UPE – PMMA) after consolidation nanoscale zinc oxide in terms of weight percentage have been studied. Mechanical – layup Liquid mixture method to prepare polymer blend coupled with ultrasonic technique to distribution and dispersion of the nanoparticles within the polymeric blend to get the best homogeneity was used. Impedance analyzer device for a range of frequencies (5-50 MHz) for the purpose of making electrical tests have been used. Micro hardness device was used to examine the micro hardness, as well as Universal Machine device was used to the examination the bending strength. The results of the examination of the electrical properties of a clear improvement in the values of capacitance, dielectric constant, resistance, resistivity, electrical conductivity with increasing the weight ratio of zinc oxide. Mechanical properties test results also showed a positive increase in the hardness and durability of bending and a clear increase in the values of the elastic modulus values with increasing the percentage of zinc oxide at room temperature.
Keywords: Resistivity, Nanocomposite, Elastic modulus and micro hardness
Cite this paper: Fadhil K. Farhan, Zainab AL- Ramadhan, Widad A. Abd-AL Hussein, Electrical and Mechanical Properties of ZnO/(UPE-PMMA) Blend Nanocomposites, International Journal of Composite Materials, Vol. 7 No. 2, 2017, pp. 46-50. doi: 10.5923/j.cmaterials.20170702.02.
Article Outline
1. Introduction
- Zinc oxide (ZnO) is a technologically important semiconducting material having unique physical and chemical properties. A wide and direct band (0.37eV), large exciton binding energy (60 meV), high electron mobility and high thermal conductivity makes it suitable for a wide range of device applications [1]. The study of the electrical properties of ZnO nanostructures developed their future applications in nanoelectronics. The electrical properties of ZnO resulting from point native defects as oxygen vacancies (Vo) and zinc interstitial (Zni+) [2]. Generally, the electrical properties of a nanostructure material depend on high surface to volume ratio of grains, small size, enhanced contribution from grain and grain boundaries, band structure modification, defect and quantum confinement of charge carriers [3]. A relatively small change in concentration of native point defects and impurities (down to 10-14 cm-3 or 0.01ppm) significantly affect the electrical and optical properties of ZnO [1]. Doping is a suitable and facile method to tune the electrical, optical, magnetic, piezoelectric and electronic properties of ZnO [4]. Composites have attracted attention of material scientists as it can combine advantages of different materials. In recent years, material scientists are looking for nanocomposites based on polymer matrix due to several added advantages. The advantages include balanced physical and mechanical properties, ease of process ability and low production cost [5]. Many previous works have been carried out to improve the optical and electrical properties of polymers through suitable doping [6, 7]. Polymer based dielectric materials can give flexible and light weight electrical devices. It is discovered that nano-particles like Al2O3, TiO2, SiO2 ZnO etc. heterogeneously distributed within the polymer matrix can enhance dielectric properties [8]. The effects of inorganic fillers on properties of the composites strongly depend on filler size and shape, type of particles, the fraction surface characteristics, and degree of dispersion [9]. Various nanoscale fillers, including montmorillonite, silica, calcium carbonate, and some metal oxides have been reported to enhance the mechanical properties, thermal stability, electrical properties, gas barrier properties, and flame retardancy of the polymer matrix [10]. Among various metal oxide fillers, nano zinc oxide (ZnO), zirconium oxide (ZrO2) and cerium oxide (CeO2) fillers have attracted considerable attention because of the unique physical properties as well as their low cost and extensive applications in diverse areas [11]. The Electrical properties of polymer have been studied by Baker and Thomas. They studied the effect of the addition of Ag+ ions to cellulose acetate. The result showed that the addition of ions not only increases conductivity but also increases the glass transition temperature. They studied the activation energy of conduction and the effects of the ionic concentration of the ion on the electrical conductivity [12].
2. Theoretical Approach
- The electrical properties of the neat and nanophase polymer blend were measured by using an Agilent 4294-A precision impedance analyzer. The nanocomposites were cut into disc with dimension of 20 mm × 4 mm (diameter, and thickness). The measurement was carried out at frequencies from 50 Hz to 5 MHz at room temperature. In the measurement, the impedance of the sample at each frequency was measured and recorded. The resistivity of the nanocomposites was calculated using the measured impedance and the geometry of the sample [13]. The impedance is given by the Equation:
 | (1) |
 | (2) |
 | (3) |
 | (4) |
 | (5) |
 | (6) |
 | (7) |
3. Materials and Methods
- The polymer UPE is supplied by Don Construction Products (DCP), commercially in the form of liquid, low viscosity, good adhesion. The ratio between resin and hardener for this study is 100g: 2g by weight. The polymer blend prepared 80% UPE with 20% PMMA. Nano ZnO is 52 nm diameters and its purity is 99.5% manufactured by (Nanjing Nano technology). Nanocomposites samples have been prepared by adding well dispersed nanoparticles to the polymer blend. The zinc oxide nanoparticles have been dispersed in acetone using ultrasonic technique for 30 min. Then the suspension was added to the polyester resin blended with 20% PMMA. The mixtures have been further ultrasonicated for another 30 min. and cold casted in Teflon molds (d=10mm, l=30mm). For curing, the samples have been placed in oven for 8 hr. at 100°C to be ready for various tests and measurements.
4. Results and Discussion
- The application of conductive nanoparticles to an insulating polymer matrix is supposed to induce an electrical conductivity, when the volume fraction exceeds the percolation threshold. The results in Figures (1, 2 and 3) are shown the resistivity of the neat and nanophase polymer blend at frequency 1MHz. In this Figures, the impedance results of each specimens are consistent, even some specimens are not very uniform. A dramatic decrease in resistivity has been found in nanocomposites, with only 1 wt. % ZnO, resistivity of polymer blend decreased from 1013 Ω.m of neat to 3x10⁶ Ω.m for nanocomposites. From experimental results resistivity, permittivity, and capacity of nanocomposites were ploted them as function of ZnO content. As we expected, resistivity decreased, and permittivity with capacity increased with increasing of ZnO percentages. The effect of frequency on resistivity impedance of the sample decreases significantly with frequency at frequencies higher than 100 KHz, of nanophase polymer blend. It is interesting that the indicating that at high frequency the impedance of the sample is dominated by the capacitance of the polymer matrix. Therefore, it is possible to determine a broad frequency of the electrical connectivity between the nano- ZnO and polymer blend by using the complex resistivity of the sample at different frequencies over range as shown in Figure 4. Figure (5) showed the electric resistance at 1MHz decreases with increases weight percentage of nano – ZnO.
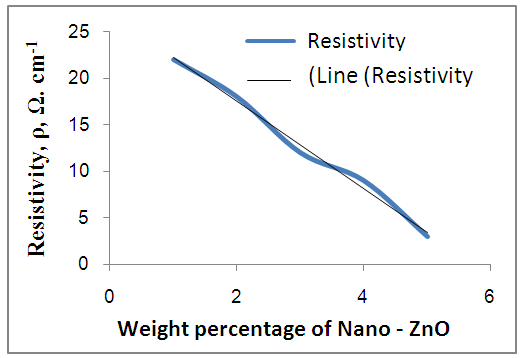 | Figure 1. Resistivity values with wt. % ZnO Nano |
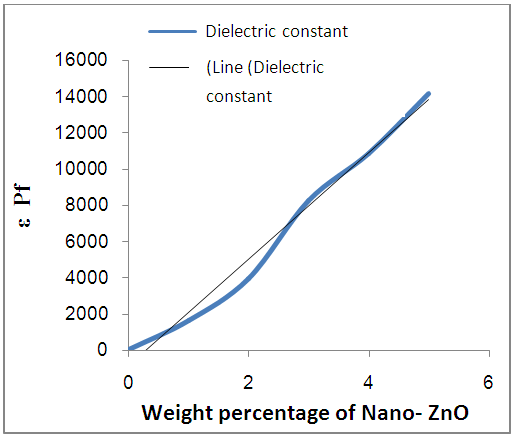 | Figure 2. Dielectric constant values with wt. % nano ZnO |
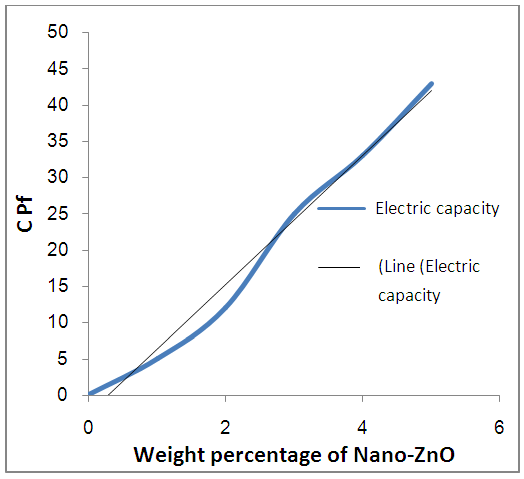 | Figure 3. Electric capacity values with wt. % ZnO nano |
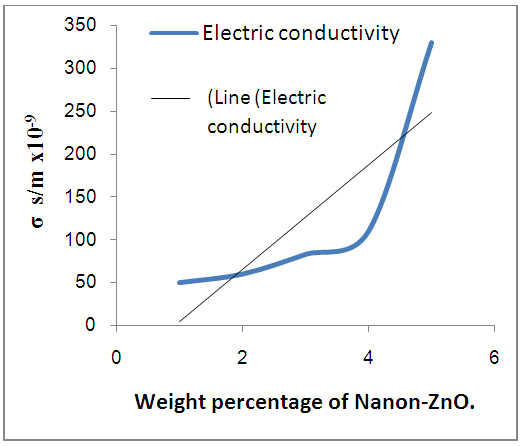 | Figure 4. Electric conductivity values with wt. % nano – ZnO |
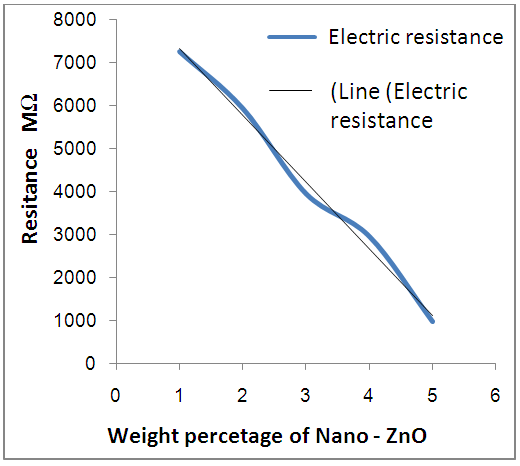 | Figure 5. Electric Resistance values with wt. % nano- ZnO |
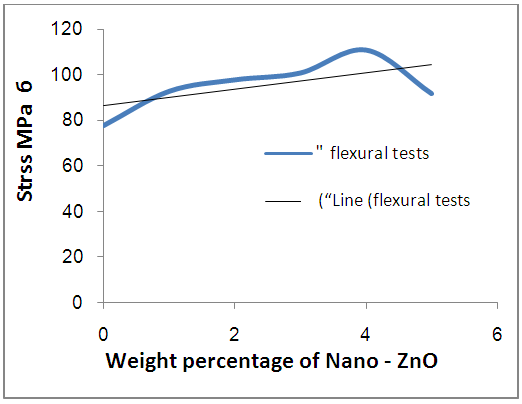 | Figure 6. Bending strength Values with wt. % nano -ZnO |
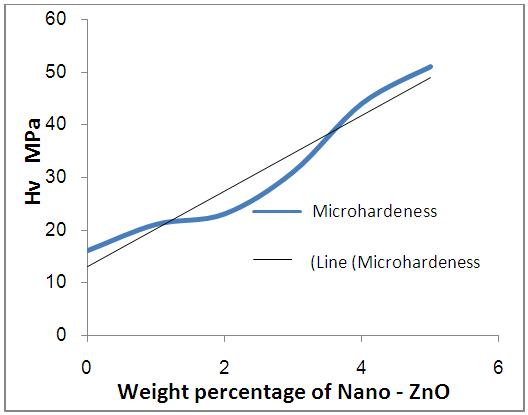 | Figure 7. Micro-hardness values with wt. % nano- ZnO |
5. Conclusions
- Ultrasonic cavitation is an efficient method of infusing ZnO nanoparticles into UPE/PMA blend resin when ZnO weight percentages are lower than 4 wt. %. Above the 4 wt. %, ZnO agglomerated. The frequency dependent behavior of nano ZnO /UPE - PMMA can be described by using as R-C circuit model. The resistivity of polymer blend decreased with nano ZnO content, and permittivity increased with increasing of fillers. Compared to neat UPE-PMMA blend, mechanical properties results indicated a 93% improvement in storage modulus in 4 wt. % nanocomposites at room temperature. Flexural modulus steadily increases with higher ZnO weight percentage. Modulus improved by 15% with an addition of a 0.4 wt. % of a ZnO. Flexural strength peaked in a 4 wt. % nanocomposites.