-
Paper Information
- Paper Submission
-
Journal Information
- About This Journal
- Editorial Board
- Current Issue
- Archive
- Author Guidelines
- Contact Us
International Journal of Composite Materials
p-ISSN: 2166-479X e-ISSN: 2166-4919
2016; 6(6): 172-182
doi:10.5923/j.cmaterials.20160606.02

Morphology, Thermal Stability, Electrical, and Mechanical Properties of Graphene Incorporated Poly(vinyl alcohol)-Gelatin Nanocomposites
 Abstract
 Reference
 Full-Text PDF
 Full-text HTML
Md Arephin Al Islam1, A. F. M. Mustafizur Rahman1, Sazia Iftekhar1, Khandoker Samaher Salem1, Nahida Sultana1, Md. Latiful Bari2
1Department of Applied Chemistry and Chemical Engineering, University of Dhaka, Dhaka, Bangladesh
2Center for Advanced Research in Science, University of Dhaka, Dhaka, Bangladesh
Correspondence to: A. F. M. Mustafizur Rahman, Department of Applied Chemistry and Chemical Engineering, University of Dhaka, Dhaka, Bangladesh.
| Email: |  |
Copyright © 2016 Scientific & Academic Publishing. All Rights Reserved.
This work is licensed under the Creative Commons Attribution International License (CC BY).
http://creativecommons.org/licenses/by/4.0/

Significant research is done towards utilizing graphene’s unique characteristics and it is highly possible that the super conductivity and transparency of graphene might help create the next generation devices more efficient, durable and cost effective. This research is intended to create usable graphene polymer based nanocomposites for potential applications especially in electronics by effectively dispersing and stabilizing the graphene platelets in a polymer matrix. Uniform and highly stable dispersion of graphene platelets in aqueous solution has been prepared. The optical image and incubation for specific time frame assured homogeneous dispersion of graphene in solution and in the polymer matrix as well. Graphene-Polyvinyl alcohol (PVA)-Gelatin composite films were prepared by solution casting method. The effect of solvents and surfactants on dispersion of graphene and the effect of graphene on the physico-mechanical, thermal and electrical properties of the nanocomposites were evaluated. The chemical change of graphene in PVA-Gelatin matrix was studied using FTIR-ATR analysis. Structural and morphological properties were determined by Scanning Electron Microscopy (SEM) and X-ray diffraction analysis (XRD). Thermal characterization of the nanocomposites was evaluated by Thermo Gravimetric Analysis (TGA) and Differential Scanning Calorimetry (DSC). The mechanical properties of the nanocomposite containing 1.0% (w/w) pristine graphene were found to be the highest (Hard and Tough). The current versus voltage (I-V) curves of the composite containing pristine graphene at various percentages was obtained and it was found that they nearly follow Ohm's law. The conductivity of the nanocomposite containing 2.0% (w/w) pristine graphene was found to be the highest (14.28 x 10⁻⁴ S/m).
Keywords: Graphene, Poly(vinyl alcohol), Nanocomposite, Thermal Analysis, Mechanical Properties, Percolation Behavior, X-ray Diffraction Analysis
Cite this paper: Md Arephin Al Islam, A. F. M. Mustafizur Rahman, Sazia Iftekhar, Khandoker Samaher Salem, Nahida Sultana, Md. Latiful Bari, Morphology, Thermal Stability, Electrical, and Mechanical Properties of Graphene Incorporated Poly(vinyl alcohol)-Gelatin Nanocomposites, International Journal of Composite Materials, Vol. 6 No. 6, 2016, pp. 172-182. doi: 10.5923/j.cmaterials.20160606.02.
Article Outline
1. Introduction
- Since its discovery in 2004 by Prof. Andre Geim and Prof. Kostya Novoselov [1], graphene has been extensively studied by researchers in various fields such as chemical, physical, materials and bio-chemical sciences as it exhibits superior characteristics in view of electrical, mechanical, thermal and optical behavior. These properties include ambipolar field effect [2], high mechanical strength [3], large surface area [4], high transparency [5, 6], high thermal conductivity [7] and some unique properties including an extraordinarily high carrier mobility, half-integer quantum Hall effect for both holes and electrons [8], and single-molecule detection [9]. Therefore a huge number of research projects are aiming at a great number of their potential applications with possible uses in fuel cells, capacitors, batteries, touch screens, conductive films, solar cells [10], electrical shielding devices [11], protective glass, high-frequency circuits, sensors [12] and the removal of toxic materials.Graphene has many outstanding properties that can be best exploited by incorporating them into some form of matrix and the fabrication of graphene reinforced composite materials is now a rapidly growing subject. Graphene possess excellent mechanical, optical and electrical properties, which have made them attractive candidates for nanocomposite reinforcement. In this context, graphene assisted polymer nanocomposites have found to show their large enhancement in effective electrical and thermal conductivity [13, 14]. Several methods have been developed such as ultra-sonication, acid treatment and surfactant treating are needed to make the most extraordinary electrical properties at the lowest percentage of the graphene loading.To date, a wide variety of processing techniques have been reported for dispersing both graphite oxide (GO) and graphite nano-platelet (GNP) derived fillers into polymer matrices. Although many of these procedures are similar to those used for other nanocomposite systems [15], some techniques have been applied uniquely to graphene-based composites. However, the final composite properties largely depend on the nature of the bonding interaction between the matrix and filler at the interface and some other factors as well. Usually non-covalent assemblies are found in the composites when dispersion technique is applied to produce composite materials where fillers and the polymer matrices are found to interact through relatively weak dispersive forces. However, the number of projects focusing on introducing covalent linkages between graphene-based filler and the supporting polymer to promote stronger interfacial bonding is growing. Here we will emphasis on the non-covalent dispersion methods such as solution casting of polymer-filler blend on glass plates.Solution-based methods are considered as the mixing of colloidal suspensions of graphene or graphene oxide platelets with the water soluble polymer. This can be done either by dissolving graphene-based materials in the polymer solution or by simple stirring, mixing or agitating the individual solutions or suspensions of polymer and graphene. The resulting blend thus obtained can be directly cast into a mold or flat plate and the solvent is evaporated out. However, this method might lead to aggregation of the filler in the composite, which may be unfavorable to composite properties [15]. Despite this problem chemically modified graphene (CMG) platelets in either water or organic solvents has been reported. This approach has been used for incorporating GO derived fillers into a variety of polymers. Thus the composites of water-soluble polymers and biopolymers such as poly(vinyl) alcohol (PVA) [16, 17] and gelatin can be produced via sonication of aqueous graphene platelet suspensions and polymer solution followed by simple filtration [16].The development of more effective strategy for preparing well dispersed and homogeneous graphene-PVA-gelatin nanocomposite was the main objective of this research, driven by the fact that incorporation of multi-walled carbon nanotubes (MWCNTs) in PVA-gelatin blend to such a high percentage by solution casting has been successfully reported by us previously [18]. In this paper, we report on the first development of Graphene-PVA-gelatin blend nanocomposite with high electrical, thermal, mechanical, structural, crystallographic and morphological evaluation.
2. Experimental
- The overall fabrication process of nanocomposites was done by a simple two-steps procedure. First, a homogeneous and stable suspension of graphene nanoplatelets was prepared and then it was mixed with PVA-gelatin blend.Graphite powder was purchased from Wako Pure Chemical Industries, Ltd., Japan (Product Number 072-03845). Gelatin Type B (Bloom strength-240, Pharmaceutical grade, Pyrogen free) was purchased from the OPSO Saline Limited, Bangladesh. Triton X100 (AR grade) was obtained from Fluka, Belgium. Gum Arabic (GA), Sodium dodecyl sulfate (SDS) and Sodium lauryl sulfate (SLS) were purchased from Sigma Aldrich, UK. All other chemicals and solvents were of reagent grade or better.
2.1. Preparation of Graphene Dispersion
- 50 mg of pristine graphite powder was added into 100 ml distilled water containing 1% surfactant Gum Arabic (GA) or Sodium lauryl sulfate (SLS). The solution was ultrasonicated for 36 hours in 40 Khz 50-60W bath ultrasonicator. Then the sonicated solution was centrifuged at 8,000 rpm in a high speed refrigerated centrifuge H-9R KOKUSAN CORPORATION, JAPAN, for 1 hour followed by vacuum filtration to remove the non-dispersed graphite powder. Here around 90% oversized graphite powder was removed to get 10% well dispersed and homogeneous graphene dispersion. Using same graphite powder (Wako, Japan, Product Number 072-03845) Komatsu et al. also obtained 9% pristine graphine having few layers [19]. Thus it is expected that our graphine also may contain few layers although we could not determine the layers due to lack of AFM instrument.
2.2. Preparation of the Composite
- Gelatin (5 gm) were soaked in 95 ml of distilled water for swelling and heated for an hour in water bath (40 to 45 °C) with constant stirring on Hotplate Stirrer, Lab Tech, Co. LTD, until the entire gelatin dissolved. In the same process 5% solution of PVA was prepared. Then both the solution was mixed in 50:50 ratios. Graphene dispersion (0.125% to 2% w/w) was added into the polymer blend prepared before. The mixture was stirred and sonicated to remove air bubbles before film casting. The graphene-polymer mixture was poured on frame mounted flat glass plate, covered with silicon cloth for film formulation. The poured mixture on glass plate was refrigerated for half an hour to fix the fillers in the matrix so that they do not settle down or aggregate. After that the films were dried in Nüve LN-120 laminar air flow chamber overnight and peeled (about 0.20 mm thickness) off the plate.
2.3. Characterization Methods
- The distribution of the graphene in the solid film matrix as well as the dispersed graphene in distilled water for different surfactants was observed through optical microscopic (OM) images, which were taken by Olympus Culture Microscope, CKX41 having lenses of 10x, 20x and 40x.The tensile strength (TS) and elongation at break (EB) of the films were determined by universal testing machine (UTM) of Hounsfield Series S (Model H10KS) Testing Machine (UK). The test specimens were cut according to ISO 3167 and ASTM standard D638M with dumbbell or dog bone shape and the size was 150 mm in length with the center section 10 mm wide and 80 mm long. The load range and gauge length were 500 N and 110 mm, respectively, where the velocities were adjusted to 10 mm/sec at room temperature.The thermo gravimetric analysis (TGA) and derivative thermo gravimetric analysis (DTG) were conducted in a TGA-50H SHIMADZU thermo gravimetric analyzer, Japan from room temperature (22 to 25°C) to 600°C with a heating rate of 10°C/min under nitrogen atmosphere and the flow rate was maintained at 10 ml/min.The Differential Scanning Calorimetric (DSC) analysis was conducted in a Differential Scanning Calorimeter, SHIMADZU, Japan from room temperature (22 to 25°C) to 600°C with a heating rate of 10°C/min under nitrogen atmosphere maintaining a flow rate of 20 ml/min.The IR spectra of the nanocomposites were taken in a transmittance mode and the IR spectroscopy was performed by IR Spectrophotometer, IR Prestige-21 model, Shimadzu Corporation, JAPAN.In order to know the swelling properties of the prepared nanocomposits, some square shaped pieces of dry samples were weighed (Wd) and immersed in distilled water for 72h at 25°C. Then they were removed from water periodically, blot dried and weighed (Ww) again. The percentage of swelling (S%)was calculated by using the equation: swelling (S%)=[Ww - Wd/ Wd] × 100. Thus the water sorption resistance of the nanocomposite was evaluated.The morphological study of the PVA-Gelatin nanocomposites was performed in a JEOL JSM-6490 SEM at an accelerating voltage of 20kV. The X-Ray diffraction (XRD) analysis was carried out on Rigaku Ultima IV X-ray diffractometer, Japan at the step size of 0.02° (2θ) and the speed of 3° (2θ) per minute. Cu Kα radiation (λ=0.154 nm), from a broad focus Cu tube operated at 40 kV and40 mA, was applied to the sample for measurement. The range of diffraction angle (2θ) was 5°–70°.The nanocomposite films were cut into square shape with an edge length of about 16 mm to measure Direct Current (DC) conductivity by four point probe method (Agilent 6545 A, DC Supply 0–120V and 0–1.5A). The voltage vs. current (I–V) responses of the samples were also observed. Here, conductivity σ = G × (d/A).
3. Results and Discussion
3.1. Dispersion of Graphene
- Due to the high hydrophobic [20] nature of graphene which is revealed by both experimental observations [21] and theoretical studies [22], and strong Van der Waals forces [23] between carbon surfaces, dispersion in aqueous medium seems to be challenging. These factors make it difficult to disperse graphene in water under normal conditions. Even when they are being dispersed, they have a tendency to settle down and form agglomerates or clusters. In the present work two different solvents were attempted which are tetrahydrofuran (THF) and water to get stable dispersion of graphene using two different kinds of surfactants, Gum Arabic (GA) as non-ionic surfactant and Sodium Lauryl Sulfate (SLS) as anionic surfactant. At first, organic solvent THF was chosen for its moderate polarity and as it has the ability to dissolve a wide range of nonpolar and polar chemical compounds. Graphene was dispersed in THF under sonication for 36 hours resulting suspension in aqueous medium. To observe its stability the suspension was centrifuged at a speed of 8000 rpm for one hour and almost all the dispersed graphene settled down in the centrifuge tube. This instability was also confirmed by observing the deposited graphene at the bottom of vial which was incubated without any centrifugation for seven days. To solve this problem more polar solvent water was used as medium and more stable dispersion was observed for longer duration. The stability in water was investigated by testing the dispersing power of GA on graphene dispersion and comparing with that of SLS. The formation of Coulombic attractions is considered as the driving force to adsorb the ionic surfactants on charged surfaces; for example, between the negatively-charged solid surface and the surfactant's positively-charged head group. Nonionic surfactants, i.e. GA, adsorb onto a hydrophobic surface by a mechanism which is based on a strong hydrophobic attraction between the surfactant's hydrophobic tail and the solid surface. Above a critical micelle concentration, a self-organization of the surfactant into micelles occurs once the adsorption of surfactant molecules on particle surfaces is established. Figure 1 shows photographic images of various graphene dispersions in GA (Figure 1A, 1C) and SLS (Figure 1B, 1D).
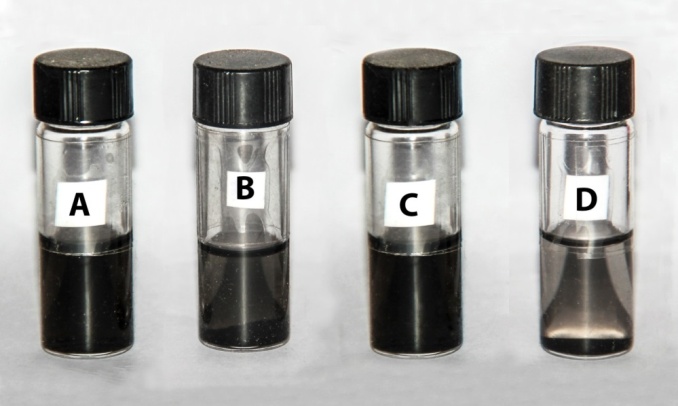 | Figure 1. Graphene 0.05% (w/v) dispersion in distilled water after 36 hours of ultra-sanitation and 1 hour of centrifugation at 8000 rpm speed in A) 1% GA solution after 7 days, B) 1% SLS solution after 7 days, C) 1% GA solution after 6 months and D) 1% SLS solution after 6 months |
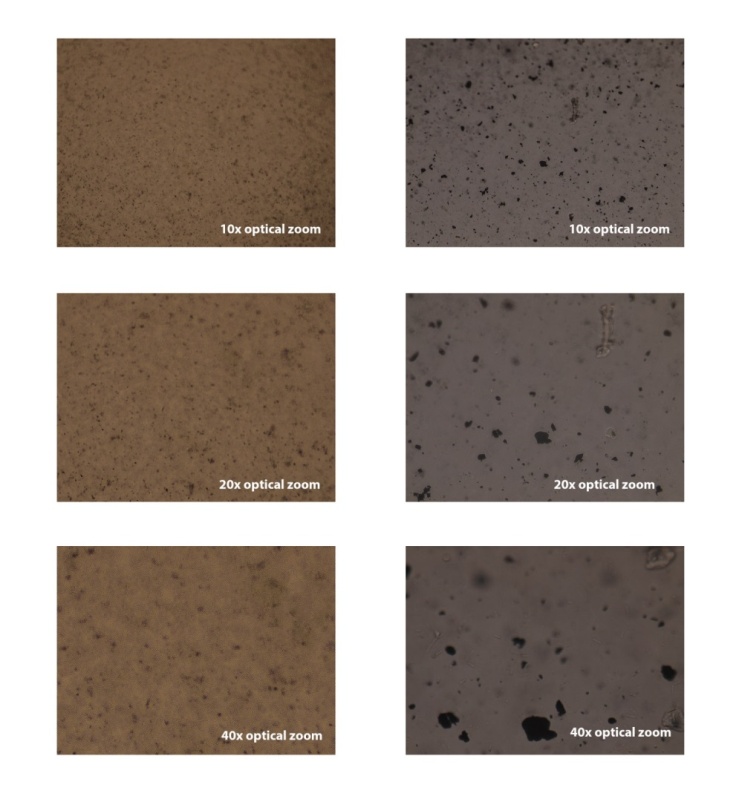 | Figure 2. Optical microscopic images of the graphene dispersed in distilled water with A) GA and B) SLS |
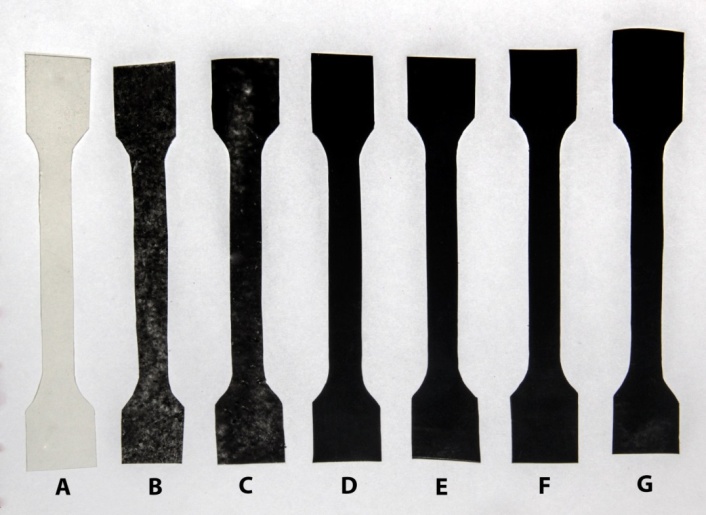 | Figure 3. Photographic image of graphene-PVA-gelatin nanocomposite films: (A) without graphene loading (B) with 0.125% (w/w) graphene loading (C) with 0.25% (w/w) graphene loading (D) with 0.5% (w/w) graphene loading (E) with 0.75% (w/w) graphene loading (F) with 1.0% (w/w) graphene loading (G) with 2.0% (w/w) graphene loading |
3.2. IR Characterization
- The FTIR-ATR spectra of polymer represent the presence of different functional groups in it. In polymers the IR absorption spectrum is often surprisingly simple, if large number of atoms is considered. This simplicity results from the fact that many of the normal vibrations have almost the same frequency and therefore appear in the spectrum as one absorption band. Using ATR the detection of new bonds in the sample compared with its pure one is also possible. The ATR spectra of PVA-Gelatin (Figure 4) showed peaks at different regions of wave number for different types of molecular vibration of the functional groups. The ATR spectroscopy shows that the addition of pristine graphene does not cause any new bond and the peaks are more or less in the same region. This is because the bonding frequencies related to C=C at 1444.7 cm-1; C-O at 1635.6 cm-1, 1039.6 cm-1 and 1080.1 cm-1; N-H at 3304.1 cm-1 and 1546.9 cm-1; C-H 2941.4 cm-1 and 1317.4 cm-1; C-N at 1253.7 cm-1 of the pure PVA-Gelatin blend which have not been changed. But the intensity of the peaks increased due to presence of graphene in the matrix. Here graphene is acting as filler in the polymer matrix.
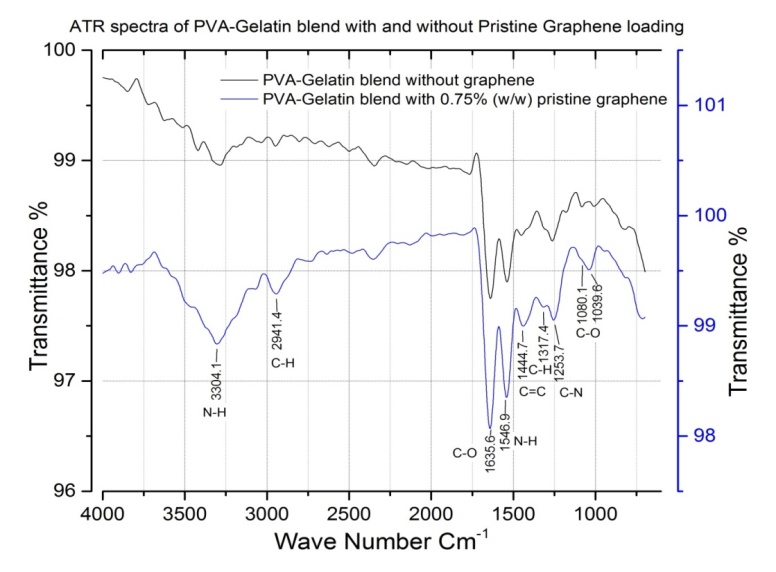 | Figure 4. ATR spectra of the PVA-gelatin blend with and without pristine graphene |
3.3. Physico-Mechanical Property
- Physico-mechanical properties of the pure PVA, pure gelatin, PVA-Gelatin composite films and graphene incorporated composites were investigated. Figure 5 shows the effect of graphene load on tensile strength (TS), elongation at break (EB) and tensile modulus (TMod) of PVA-Gelatin films with different graphene loading. It has been found that with the incorporation of graphene in matrix tensile strength and tensile modulus decreases, elongation at break increases from that of PVA-Gelatin film with no graphene in it. It is also seen that tensile strength of composites increases from 18.11 MPa to 38.78 MPa when graphene loading is increased from 0.125% to 2% (w/w). So, the TS value of composite containing 2.0% graphene increases about 114.14% compared to that of containing 0.125% graphene. The marked increment of tensile strength with the increase of graphene fillers in the PVA-Gelatin films indicates that the presence of graphene has reduced the mobility of molecular chains of PVA and gelatin.
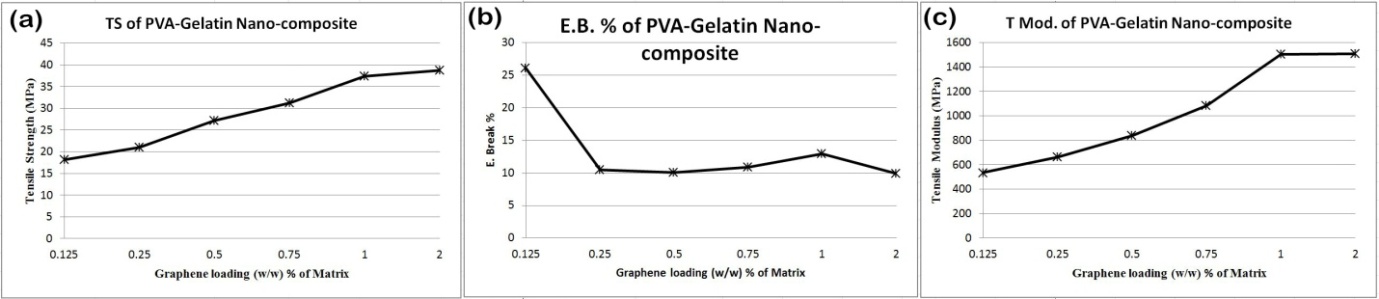 | Figure 5. Effect of graphene loading on (a) tensile strength (b) elongation at break and (c) tensile modulus of PVA-gelatin nanocomposite |
3.4. Swelling Behaviour
- Water uptake tendency of some specimens at varying percentages of graphene load was investigated to understand the effect of graphene on the swelling behavior of the PVA-Gelatin blend nanocomposites. The composites were kept submersed in water up to 72 hours. The results show that the swelling behavior of nanocomposite is obviously different from that of pure blend and the rate of water uptake is higher initially, reaches at a maximum point and then decreases. This is due to dissolution of some polymer molecules of the composite surface into water as both PVA and gelatin are soluble in pure form. The swelling tendency increases with the increase of graphene load in the composites. Figure 6 shows the initial water uptake of composites with filler is higher than that of the blank composite and this trend increases with the percentage load of graphene in the polymer matrix. This happens due to the lower hydrophobic nature of composites with increasing filler loads. It is also clear that with the increase of graphene load the swelling property also increases. This is due to the capillarity of graphene filler in the matrix, which facilitates the diffusion of solvent into the nanocomposite matrix.
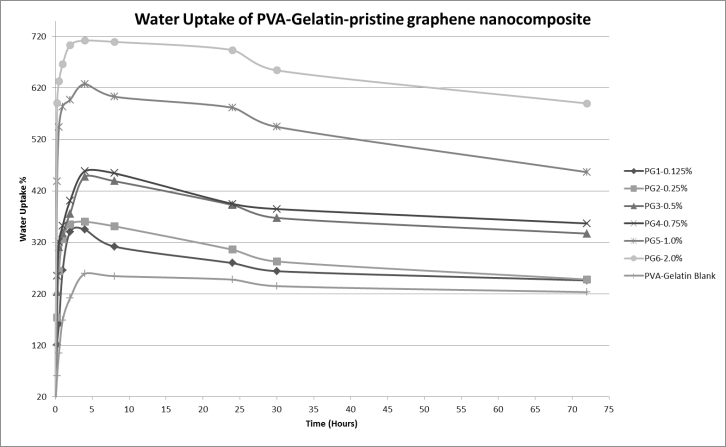 | Figure 6. Graphical representation of effect of graphene on water uptake of PVA-gelatin nanocomposites |
3.5. Electrical Property
- For electrical application, the zero-band gap [24, 25] semimetal nature of graphene is very useful with its very high electrical conductivity. As part of characterization of the electrical properties of the prepared nanocomposites, response to the applied voltage (0 to 40 volt) was measured and the conductivity was calculated from current flow (I) and applied voltage (v) values. Figure 7 and Figure 8 show the graphical representation of the current versus voltage curve and concentration dependencies of direct current conductivity, σdc of blend nanocomposite at different percentage of pristine graphene loading. The current flow through pure PVA-Gelatin blend was considered zero (0) as it was out of the measuring range of the instrument, i.e., the film is highly dielectric in nature. It was found that all the nanocomposites exhibit a characteristic percolation behavior [26].
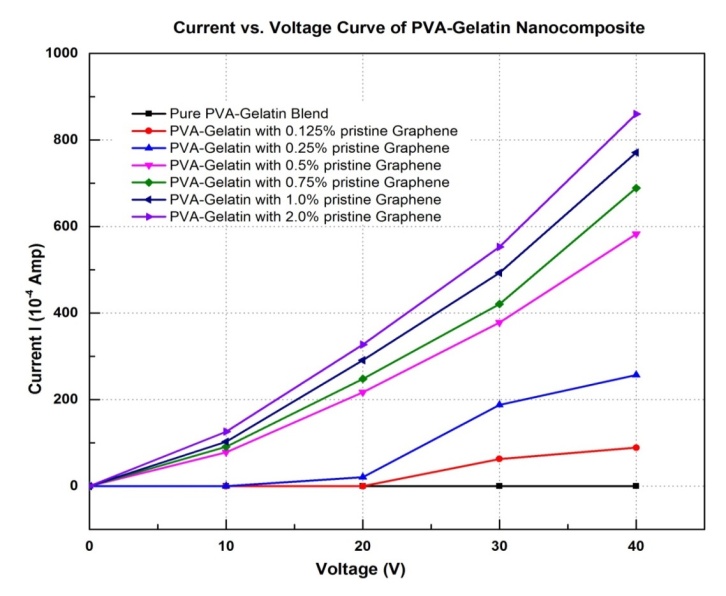 | Figure 7. Current vs. Voltage curve of PVA-gelatin nanocomposite at different pristine graphene loading |
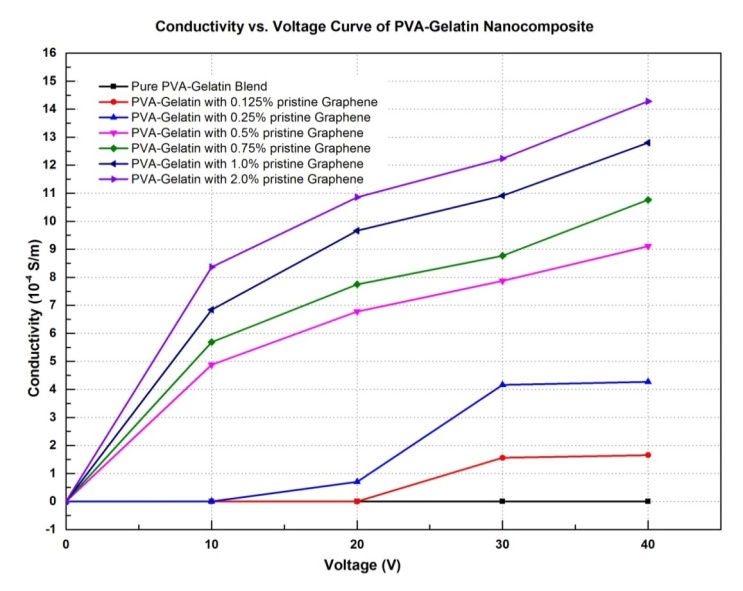 | Figure 8. Conductivity of PVA-gelatin nanocomposite at different graphene loading |
3.6. Thermal Property
- To evaluate the thermal properties of the nanocomposite samples, TGA and DSC were carried out. The effects of pristine graphene loading on the thermal behavior of the nanocomposite were studied and from the curves it is clear that the thermal stability of the nanocomposites is similar to the pure PVA-Gelatin film but the stabilities vary insignificantly with an increase in the pristine graphene loading. Figure 9 shows TGA, derivative thermogravimetric (DrTGA) and DSC thermograms of PVA-Gelatin nanocomposite with various pristine graphene loading. The total thermal degradation of composites occurs in four stages shown in Figure 9(i). DrTGA curves in Figure 9(ii) showed a broad peak representing maximum degradation rate temperature (Tp) corresponding to regions between point C and D in Figure 9(i). The maximum decomposition of composite occurs at Tp, whose position is used for the measurement of thermal stability. The higher the shift towards right side the higher is the thermal stability. In the curve the nanocomposite containing pristine graphene is found to be a bit less stable as their positions shifted to the left side but composite containing 0.75% of pristine graphene (Tp at 327.55°C) is found to be more stable. Therefore, the data thus obtained confirms that the thermal stability is almost independent on graphene content in the blended samples as the shifts in Tp at higher or lower temperature ranges are not that much significant. The DSC thermogram in Figure 9(iii) shows the glass transition temperature (Tg) and melting transition temperature (Tm) of nanocomposites at various graphene loading. The increase of the graphene percentages in composites has little effect on Tg and Tm. For pure blend three endothermic phase transitions were seen at about 50-100, 219, and 251°C. The last peaks are minor, distributed from 230 to 300°C, whereas the intermediate peak is intense one and the first peak is broader. An electro-thermal apparatus was used to measure the melting point of blend and it was about 219°C. Thus, the endothermic curve that was found at 219°C, in the DSC thermogram of Figure 9(iii) is due to the melting-phase transition of PVA-Gelatin blend. The endothermic phase transition peak at 50-100°C might be due to the helix–coil transition of gelatin, which overlapped with the glass-transition temperature (Tg). However, an uncertain peak at 251°C is probably due to the denaturation of the gelatin segments. The broadness of the first peak may be considered as the overlapping of Tg of the 18 amino acids present in the gelatin.
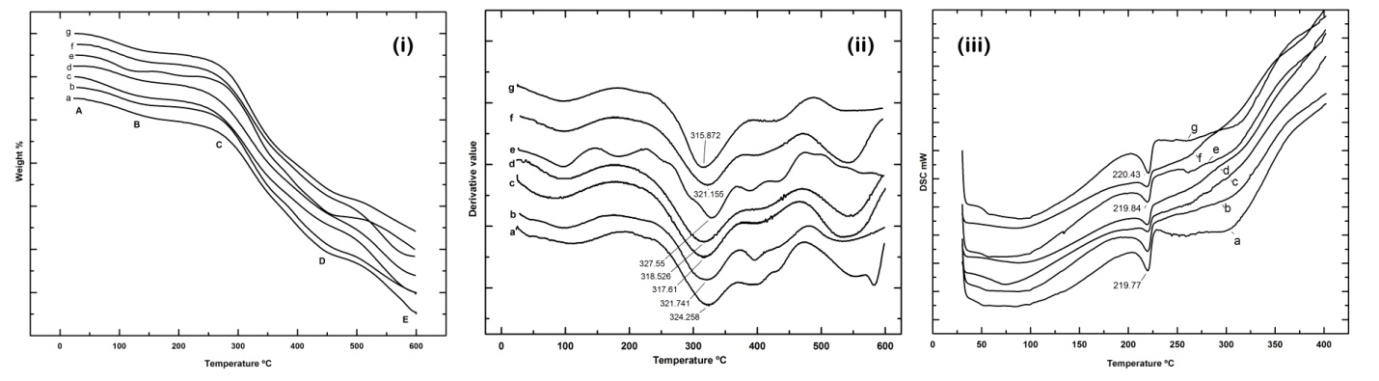 | Figure 9. (i) TGA, (ii) DTG and (iii) DSC thermo grams of PVA-gelatin nanocomposite with a) 0% b) 0.125% c) 0.25% d) 0.5% e) 0.75% f) 1.0% g) 2.0% pristine graphene loading |
3.7. XRD Analysis
- Figure 10 shows the XRD pattern of pure gelatin, pure PVA, blend of PVA-Gelatin, and graphene loaded PVA-Gelatin nanocomposite where curve (a) represents the XRD pattern for gelatin with a sharp peak at 7.7° 2θ and a broad peak at 19.3° 2θ with intensity of 246 and 407 counts respectively, indicating that gelatin possesses both amorphous and crystalline region in its structure. A sharp peak at 19.38° 2θ in curve (b) confirms the crystalline structure of PVA. Whereas, curve (c) represents the amorphous dominated gelatin molecules in PVA-Gelatin blend. Two broad peaks in curve (c) are found to show at 7.52° 2θ with intensity of 182 counts and 19.98° 2θ with intensity of 212 counts. Here sharp peak of PVA at 19.38° 2θ disappears which confirms the amorphous structure of polymers in the blend. In curve (d), the XRD pattern of graphene loaded PVA-Gelatin nanocomposite shows a sharp peak at 19.82° 2θ and a relatively less sharp peak at 7.66° 2θ with intensities 645 and 111 counts, respectively.
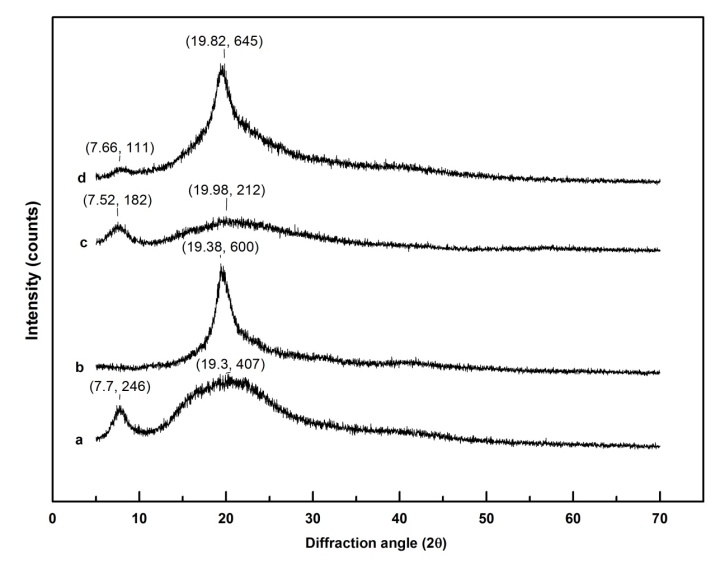 | Figure 10. XRD spectra of (a) gelatin, (b) PVA, (c) PVA-gelatin blend, (d) graphene loaded PVA-gelatin nanocomposite |
3.8. Morphology and Structure
- The SEM images of both the surface and interface (fractured surface) of nanocomposite are shown in Figure 11. The clear surface of the composite indicates that graphene fillers are absent on the composite surface and this is may be due to the fact that graphene fillers may penetrated inside the PVA-Gelatin matrix with homogeneous distribution within it. The images at higher magnification in Figure 11(a) and 11(b) illustrates the layered structure of nanocomposite where graphene fillers remain in between the layers. However, graphene fillers have been seen on the interface (fractured surface) of nanocomposite and that would enhance the thermal stability and mechanical properties to the composites. Similar phenomena were found in the SEM images of CNT reinforced polymer-based nanocomposites [18, 29] and completely support the findings of the present investigation. The images also confirm homogeneously dispersed incorporation of graphene in PVA-Gelatin nanocomposite matrix.
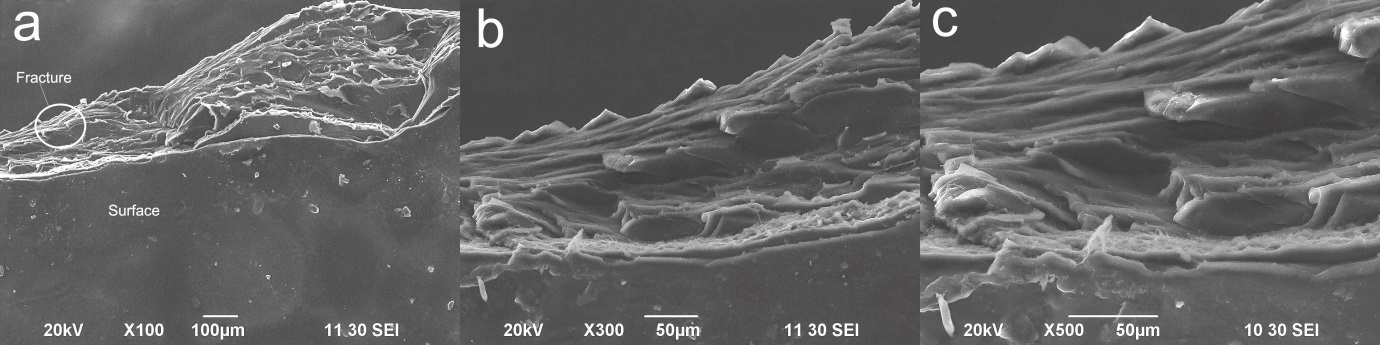 | Figure 11. SEM images of the surface and interface (fractured surface) of graphene incorporated PVA-gelatin nanocomposite at (a) 100x, (b) 300x and (c) 500x zoom |
4. Conclusions
- The main obstacle in dispersing pristine graphene in organic solvents homogeneously was overcome by changing the organic solvent media to aqueous media. Homogeneous and stable dispersion of graphene in aqueous solution was prepared successfully by using 1% surfactant Gum Arabic. Graphene-PVA-Gelatin nanocomposite films with uniformly dispersed fillers were successfully prepared by solution casting method. Highest 2% (w/w) graphene incorporation was possible without agglomeration of graphene within the nanocomposite matrix which was confirmed by observing scanning electron microscopic (SEM) images of them. Conductivity, physico-mechanical, thermal and swelling properties improved with the increase of graphene loading in PVA-Gelatin nanocomposites. The thermal stability of the nanocomposites was found to enhance with the increase in pristine graphene loading in the nanocomposite when compared with of pure PVA-Gelatin film. Nanocomposite containing 0.75% (w/w) graphene possesses highest thermal stability which was confirmed by TGA, DrTGA and DSC characterization. With the increase of graphene load in composites the swelling property also increases and the highest water uptake is 712% for composite containing 2% (w/w) pristine graphene which is an important feature for its compatibility in biomedical applications. Homogeneously incorporated highest 2% (w/w) graphene loaded nanocomposite showed highest tensile strength (TS) by 114% increment compared to that of 0.125% graphene loaded PVA-Gelatin blend film. Based on tensile strength (TS), elongation at break (EB) and tensile modulus (T. Mod.) the optimized composition of the film has 1% (w/w) pristine graphene loading. The incorporation of graphene to polymer matrix introduces conductive property in it and conductivity of nanocomposites increases with increasing load of graphene. The highest conductivity is 14.28 x 10⁻⁴ S/m which was found in the composite containing 2% (w/w) pristine graphene. Nanocomposite chemistry is considered as very promising for their electrical as well as biomedical applications, such as solar cells, energy storage devices, biosensors and actuators. Addressing the device performance for the realization or commercialization of graphene incorporated blend polymer devices will be our future study.
ACKNOWLEDGEMENTS
- Md Arephin al Islam is grateful to the Ministry of Science and Technology, Government of the People’s Republic of Bangladesh for providing partial financial support as National Science and Technology Fellowship. We are also thankful to the Centre for Advanced Research in Sciences (CARS), University of Dhaka, Bangladesh and Bangladesh Council for Scientific and Industrial Research (BCSIR) for providing partial laboratory facilities.