-
Paper Information
- Previous Paper
- Paper Submission
-
Journal Information
- About This Journal
- Editorial Board
- Current Issue
- Archive
- Author Guidelines
- Contact Us
International Journal of Composite Materials
p-ISSN: 2166-479X e-ISSN: 2166-4919
2016; 6(4): 95-99
doi:10.5923/j.cmaterials.20160604.02

Effect of CNTs on the Wear and Friction Performance of Carbon Fibre Woven Fabric Reinforced Epoxy Resin Composites
V. K. Srivastava
Department of Mechanical Engineering, Indian Institute of Technology (BHU), Varanasi, India
Correspondence to: V. K. Srivastava, Department of Mechanical Engineering, Indian Institute of Technology (BHU), Varanasi, India.
| Email: |  |
Copyright © 2016 Scientific & Academic Publishing. All Rights Reserved.
This work is licensed under the Creative Commons Attribution International License (CC BY).
http://creativecommons.org/licenses/by/4.0/

Multi-walled carbon nanotubes (MWCNTs) filled carbon fibre woven fabric reinforced epoxy resin composites were fabricated by hand lay-up method. The tribological properties of the composites were investigated systematically using reciprocating wear and friction machine under different sliding conditions. Experimental results show that the friction force, wear loss and friction coefficient significantly increases with increase of load at fixed sliding time whereas wear loss reduces sharply with increase of sliding time at fixed applied load. However, sliding temperature gradually reduces and stabilized after 5 min. The worn surfaces of the composites were examined by scanning electron microscope (SEM). The friction and wear of the MWCNT filled carbon fabric composites result indicates that the wear and friction coefficient increases with increasing applied load.
Keywords: Carbon Fibre Woven Fabric, MWCNTs Particles, Epoxy Resin, Friction Force, Friction Coefficient, Wear
Cite this paper: V. K. Srivastava, Effect of CNTs on the Wear and Friction Performance of Carbon Fibre Woven Fabric Reinforced Epoxy Resin Composites, International Journal of Composite Materials, Vol. 6 No. 4, 2016, pp. 95-99. doi: 10.5923/j.cmaterials.20160604.02.
Article Outline
1. Introduction
- Carbon nanotubes (CNTs) have been recognized as a potential candidate for the reinforcement of polymeric composites due to their many excellent physical, mechanical and functional properties, and extremely high aspect ratios. Depending on the area of applications, CNT/polymer composite can be classified into structural and functional composites [1-3]. For structural applications, much improved mechanical properties are explored based on the high modulus, tensile strength and strain to fracture, and excellent damping characteristics of CNTs. The degree of improvement of CNTs on mechanical properties of composites totally depends on the dispersion and interfacial adhesion of CNTs in the composites [4-6]. The incorporation of CNTs with conventional micro-scale fibre reinforcements in a common polymer matrix can be achieved by modifying the matrix resin or the fibre reinforcement using CNTs. Various techniques have been used for CNTs dispersion into polymer matrix, which include shear mixing, calendaring, extrusion, ultrasonication and ball milling [7]. One of the major problems is that the viscosity of CNT modified matrix increases dramatically with increasing CNT content, even with a very small content below 1 wt%, leading to severe agglomeration of CNTs in the bulk of composite. The highly viscous and CNT agglomerated resin systems cannot be processed using conventional composite method [8, 9]. Therefore, conventional approach of mixing CNTs with a polymer epoxy resin require before the fibre reinforcements. Due to attractive application of epoxy resin in many fields, the demand for the wear resistance of epoxy resin is becoming strict because epoxy resin displaying a lower wear resistance [10]. The combination of epoxy resin with inorganic particles has become an attractive approach to improve the wear resistance of epoxy resin to meet the demand of automotive industries.Hence, CNTs as reinforcement can be used in the epoxy resin to improve the mechanical properties of epoxy resin [8]. Since, multi-walled carbon nanotubes consists of hollow rolled-up graphite-like structure, resulting in self-lubricating property of MWCNTs, which makes MWCNTs promising candidates as antifriction and abrasion resistance material. Many groups have reported friction and wear behaviour of CNTs/epoxy resin composites [11-14]. They reported that the friction coefficient and wear rate of MWCNTs/epoxy resin composite gives lower value compared to pure epoxy resin. The wear rate decreased with the increase of MWCNT loading [13].Carbon fibres exhibit self-lubricating properties due to the composition of various graphite planes. Compared with short carbon fibres or continuous carbon fibres, the carbon fabric shows better load-carrying capacity and tribological properties due to the properly aligned structure. The carbon fibre reinforced friction material shows lower wear rate than glass fibre and asbestos fibre reinforced composites within the temperature range of 100-300°C. The friction coefficients of carbon fibre reinforced plastic composite (CFRP) increases as friction temperature increases from 100 to 300°C due to fibre thinning and pull-out [15-17]. The modification of tribological behaviour of carbon fabric polymer composite by the addition of micro or nano filler material has been introduced to be quite encouraging. Many researchers studied the effect of solid lubricants and nanoparticles on the tribological properties of carbon fabric composites [18-20]. Among the various inorganic fillers, potassium titanate wisker (PTW) has been considered to be a promising reinforcement for the wear resistant composites. The small size and high ratio of length to diameter of PTW are very useful for reinforcing polymer [20]. To the best of my knowledge, there is hardly any work reported on the tribology of MWCNT filled woven carbon fabric reinforced epoxy resin composites.In this work, friction coefficient and wear of MWCNT filled woven carbon fabric reinforced epoxy resin composites have been studied with the variation of applied load and time. The worn surfaces were examined by scanning electron microscope (SEM) to explain the wear mechanisms of CNTs filler in the woven carbon fabric and epoxy resin. It is believed that this result will provide the application of CNT filler in the woven carbon fabric composites for self-lubricating bearings.
2. Experimental Work
2.1. Materials and Specimen
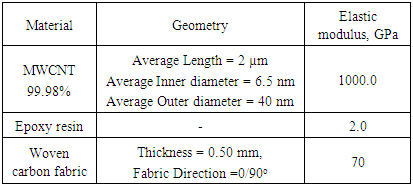
- Araldite (LY-556) 55%, hardener (HY-917) 49% and accelerator (DY-070) 0.28% were used as epoxy resin matrix obtained from Ciba Gaigy Ltd., Mumbai, India. MWCNT nanoparticle was used as fillers. This was procured from J.K. Impex Company, Mumbai with 99.5% purities. Woven carbon fabric (0/90°) was obtained from Carbon Nexus, Institute of Frontier Materials, Deakin University, Geelong, Victoria, Melbourne, Australia. The material properties are listed in Table-1.
|
2.2. Friction and Wear Measurements
- Wear and coefficient of friction was measured from reciprocating sliding wear and friction monitor instrument (TE-200ST). Reciprocating wear test was performed against high chromium steel ball having a 10 mm diameter with 3.3 Hz reciprocating frequency. The total stroke length was set at 3mm for all tests and was conducted for 10 min at a normal load 50N. The variation in coefficient of friction and temperature were obtained from the machine itself and the wear loss was measured with the help of electronic digital balance.
2.3. Morphological Observations
- The morphological behaviour of MWCNT filled woven carbon fabric composites were observed through a scanning electron microscope (SEM). SEM samples were prepared into 10x10 mm sizes via a diamond cutter and placed on a SEM grid for the characterization of composite features. The samples were observed using a Hitachi HF-2000, 200kV SEM.The carbon fibres are stacked and impregnated with phenolic resin using hand laying procedures. The mould is then warm pressed, cured and post-cured in a vacuum oven to obtain the carbon fibre reinforced plastic composites (CFRP). The open porosity of the matrix is nearly about 1% at this step.
3. Results and Discussion
3.1. Effect of Sliding Time on Friction and Wear
- The sliding temperature, friction force, friction coefficient and wear loss with variation of sliding time of 2% MWCNTs filled woven carbon fabric reinforced epoxy resin composites at constant applied load 50N are shown in Figs.1-3. Fig.1 clearly shows the sliding temperature fluctuating within the range of 23.5 to 25.5°C with the increase of sliding time from 0 to 30 min.
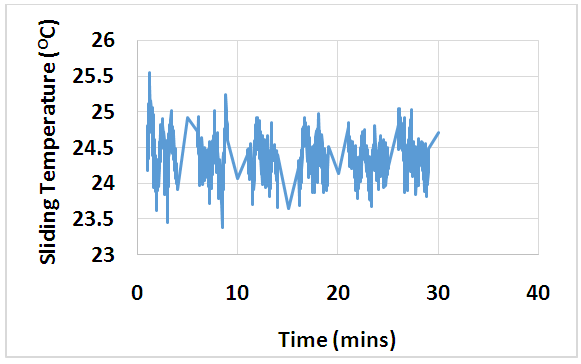 | Figure 1. Variation of sliding temperature with time at constant load 50N |
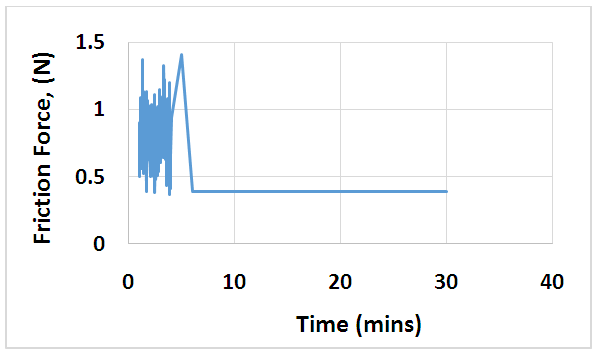 | Figure 2. Variation of friction force with sliding time at constant load 50N |
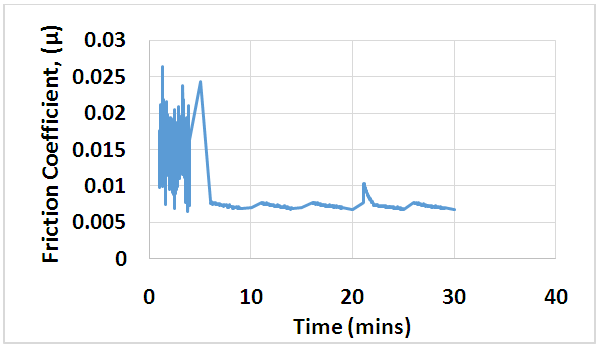 | Figure 3. Variation of coefficient of friction with sliding time at constant load 50N |
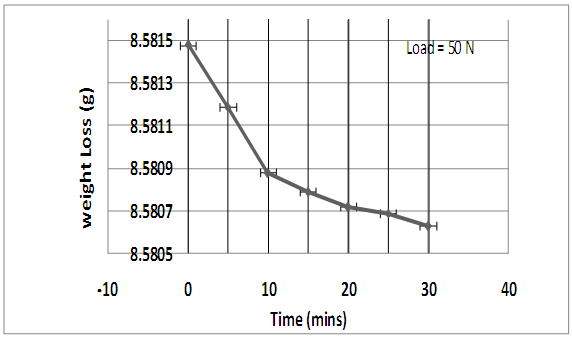 | Figure 4. Variation of weight loss with time at constant load 50 N |
3.2. Effect of Applied Load on Friction and Wear
- Figs. 5-7 clearly indicate that the friction force, friction coefficient and wear loss increased with increase of applied load at constant 30 min sliding time. These figures show the gradual increase of friction force, friction coefficient and wear loss up to 70 N and then drastically increased till 80N load.
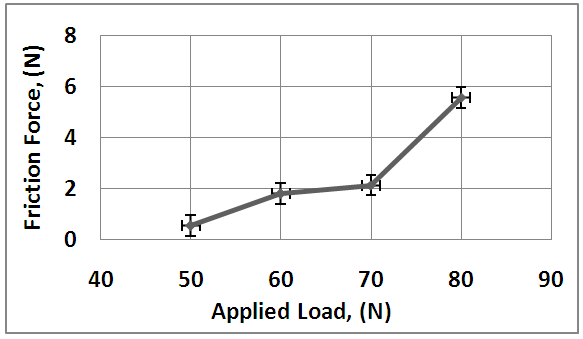 | Figure 5. Variation of friction force with applied load at constant time 30 min |
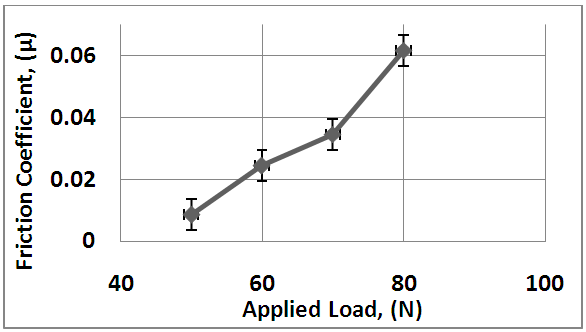 | Figure 6. Variation of friction coefficient with applied load at constant 30 min |
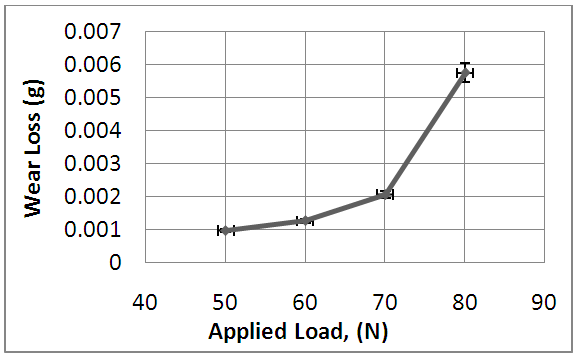 | Figure 7. Variation of wear loss with applied load at constant time 30 min |
3.3. Morphology of Worn Surfaces
- In order to understand the morphology of the worn surfaces of the counterpart 2% MWCNT filled woven carbon fabric reinforced epoxy resin composite pins sliding against steel surface at load 80N and sliding time 30 min are shown in Figs. 8 & 9. It is seen that the debris formation and broken fibres take place. The worn surface is not smoother and visible as blocky fragments.The abrasion mechanisms of 2% MWCNT woven carbon fibre composite are mainly due to adhesion wear and deformation of epoxy resin matrix. This indicates that the MWCNT particle is an effective method to decrease adhesion wear and improve the wear resistance [16]. From Fig. 8, it can be seen that the worn surface of the composite appears straight furrows, indicating that abrasive wear is the main wear mechanism of the composites under 80N load.
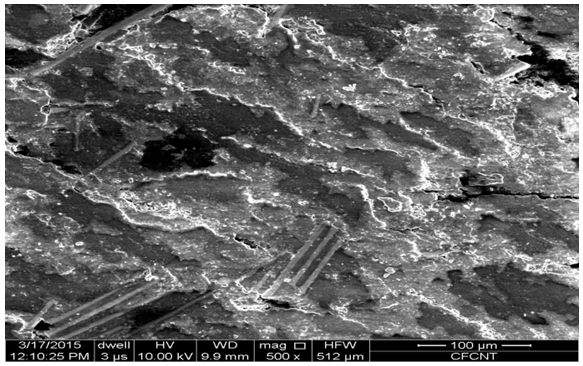 | Figure 8. SEM image showing the wear surfaces and debris |
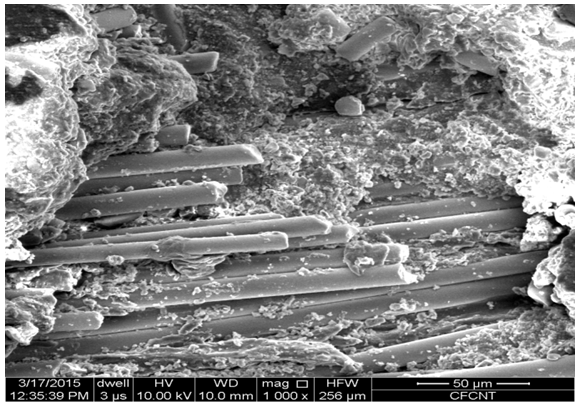 | Figure 9. SEM image showing the worn surfaces, fibre fracture and debris |
4. Conclusions
- This study investigated the effect of MWCNTs, applied load and sliding time on the friction and wear behaviours of woven carbon fabric reinforced epoxy resin composite. The sliding temperature, friction force, friction coefficient and wear loss are dependent on the applied load and sliding time. The friction coefficient and wear loss increased with increase of applied load. However, incorporation of 2% MWCNT increase the wear resistance and reducing the friction abilities of the woven carbon fabric reinforced epoxy resin composite. The woven carbon fabric filled 2% MWCNT epoxy resin composite exhibit the smallest friction coefficient and the wear loss compared to reported work [15, 20].
ACKNOWLEDGEMENTS
- Author is thankful to Department of Mechanical Engineering, and Department of Metallurgical Engineering, Indian Institute of Technology (BHU), Varanasi-221005, India for providing the experimental supports.
 Abstract
 Reference
 Full-Text PDF
 Full-text HTML