International Journal of Composite Materials

p-ISSN: 2166-479X    e-ISSN: 2166-4919

2015;  5(6): 195-201

doi:10.5923/j.cmaterials.20150506.08


X-ray Studies and Electrical Properties of the Zinc-substituted Copper Nanoferrite Synthesized by Sol-gel Method

Sabah M. Ali Ridha

Department of Physics, College of Education for Pure Sciences, University of Kirkuk, Kirkuk, Iraq

Correspondence to: Sabah M. Ali Ridha , Department of Physics, College of Education for Pure Sciences, University of Kirkuk, Kirkuk, Iraq.

Email:

Copyright © 2015 Scientific & Academic Publishing. All Rights Reserved.

This work is licensed under the Creative Commons Attribution International License (CC BY).
http://creativecommons.org/licenses/by/4.0/

Abstract

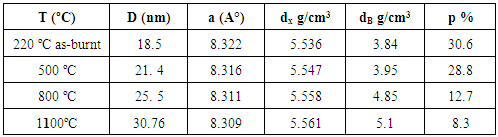
The structural and dielectric properties were studied for Zn substituted copper spinel ferrite having the formula Cu1-xZnxFe2O4 where [x = 0.0, 0.2, 0.4, 0.6, 0.8, and 1.0]. This ferrite prepared by an auto-combustion sol-gel method and calcined at different temperatures (500, 800, and 1100°C). The X-ray diffraction pattern of these compositions showed the formation of the single phase spinel structure. Furthermore, the XRD have been used to calculate the lattice parameter, particle size, bulk density and porosity for all ferrite samples. The particle size varied from 18.5 nm to 36 nm, while the lattice parameter decreased with calcination temperatures and Zn-ion content in the range (8.2688-8.3304 A°). X-ray density decreases from 5.536 to 5.562 g/cm3 and porosity increases from 6.4 to 12.8% with increasing Zn-ion content. The dielectric constant decreases from 56*103 to 26*103 and the loss tangent from 8.52 to 0.33 with frequency (in the range of 50 Hz – 5MHz), while the dielectric constant takes high values with high Copper content ferrites. a.c. Conductivity increases (from 0.27*10-5 to 168 *10-5-1.cm-1) with increasing frequency. On other hand; A.C. Resistivity decreases (from 361*103 to 0.59*103 Ω.cm) with frequency for all Cu-Zn ferrite samples.

Keywords: Cu-Zn ferrites, ac. conductivity, Spinel ferrites, Nanoferrite samples, Auto-Combustion method

Cite this paper: Sabah M. Ali Ridha , X-ray Studies and Electrical Properties of the Zinc-substituted Copper Nanoferrite Synthesized by Sol-gel Method, International Journal of Composite Materials, Vol. 5 No. 6, 2015, pp. 195-201. doi: 10.5923/j.cmaterials.20150506.08.

1. Introduction

Spinel structure ferrites are an important class of electrical materials due to their high electrical resistance and low eddy current losses which make them useful in radiofrequency circuits, high quality factors, transformer core, magnetic recording media, magnetic fluids and other devices [1-5].
Polycrystalline nanoferrites are very good dielectric materials and depends on several factors, including the method of preparation, sintering conditions, chemical composition, crystallite size and cation distribution in the two sublattices i.e. tetrahedral (A) and octahedral [B] lattice sites, [6-17]. According to the crystal structure, copper ferrite is an inverse spinel ferrite and Zn ferrite is normal spinal, and the substitution of zinc in copper ferrite modifies the dielectric properties of copper ferrite which are useful in many device applications [18, 19]. Cu-Zn nanoferrite play significant role among ferrite materials due to their high electrical resistivity, high dielectric and low tangent losses [20, 21]. Hence it is important to study their dielectric behavior at different frequencies.
The auto-combustion sol-gel method has been chosen in the present study to synthesize the Cu-Zn nanoferrites (Cu1-xZnxFe2O4; where x= 0.0 to 1.0) at temperature 220°C, and calcined at temperatures 500, 800, 1100°C. Spinel structures, crystallite size, lattice parameter, and theoretical densities were characterized using X-ray diffractometry patterns date for Cu-Zn ferrites. The variations of dielectric constant, dielectric loss and a.c. conductivity for Cu-Zn ferrite samples sintered at 1100°C with different Zn content have been studied as a function of frequency using impedance analyzer LCR meter in the range 50Hz- 5MHz.

2. Experimental

2.1. Synthesis

Cu-Zn ferrites of composition Cu1-xZnxFe2O4 (where; x=0-1.0) were synthesized using auto-combustion sol-gel method. The appropriate amount of nitrates [Zn(NO3)2.6H2O, Cu(NO3)2.3H2O and Fe(NO3)3.9H2O] and citric acid [C6H8O7..H2O] were dissolved in distilled water to form aqueous solution. The pH value of solution was adjusted to pH=7 using ammonia solution. Then the aqueous solution was heated and evaporated at 90°C under intensive stirring to transform into a highly viscous gel. The obtained gel is dried inside electric oven at a temperature of 120°C. Auto combustion reaction is initiated by heating the dry gel at 220°C.
The as-burnt powders were divided into four parts and calcined separately at temperatures 220, 500, 800, and 1100°C for 3h] and then mixed with small amount (2% weight) of saturated polyvinyl-alcohol aqueous solution and uniaxially pressed at 3 ton/cm2 pressure to form pellet shaped samples with diameter ~12 mm and thickness ~1.5 mm. The pellet samples were sintered at 1100°C for 3 hours. High purity silver paint was added to the each face of the samples for good electric contacts.

2.2. Characterization

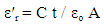
Structural characteristics of ferrite samples were determined by X-ray diffraction patterns obtained in the (2θ) range of (20°) to (70°) with (Cu Kα) radiation (λ =1.5406 Å). The average particle size was determined by using Scherrer formula assuming all the particles to be in spherical in shape, [22].
(1)
where, D is the crystallite size, β is the line width at half maximum ( rad), λ the X-ray wavelength and θ is the Bragg angle.
The lattice parameter (a) was determined as,
(2)
where; h, k, l are the Miller indices of the crystal planes.
The bulk density dB of the samples is determined by measuring the volume and mass of the sintered ferrite samples using the relation:
(3)
where; m is the mass of the bulk sample in grams and V is volume (in cm3).
The X-ray (theoretical) density of prepared ferrite powders was calculated using the relation;
(4)
where; M is molecular weight, (NA) the Avogadro's number and, (a) is the lattice parameter.
The porosity (P) of the sintered samples calculated using the relation;
(5)
a.c. conductivity and dielectric measurements as a function of the frequency for all ferrite samples were performed in the range of 50Hz - 5MHz using a impedance analyzer LCR meter.
The real dielectric constant (ɛ′r) was calculated using the relation;
(6)
where; (C) is the capacitance of the sample, (t): the thickness, (A): the surface area and εo the permittivity of free space. The imaginary part of dielectric constant (εr″) was calculated using the relation;
(7)
where (tan δ) is dielectric loss tangent.
(8)
From dielectric constant ε′r and dielectric loss tangent (tan δ), the a.c. conductivity (σac) of the ferrite samples can be calculated using the relation [23].
(9)
where; (ω=2πf) is the angular frequency. σac is frequency dependent and it is attributed to the dielectric characteristics.

3. Results and Discussions

3.1. Structural Properties

3.1.1. XRD Characteristics of
XRD studies have been carried out on the dried gel (120°C), the as-burnt (220°C) powder, and the ferrite samples calcined at 500, 800 and 1100°C.
Figure (1) shows the XRD patterns of five Cu.0.4Zn0.6Fe2O4 ferrite powders. The dried gel powder (at 120°C) is amorphous in nature. The as-burnt powder (at 220°C) is a single phase Cu-Zn ferrite with spinel structure; similar to that of the as-calcined samples at temperatures 500, 800, and 1100°C. The observed peaks at (220), (311), (222), (400), (422), (511), and (440), confirmed the spinel structure of the samples. This indicates that the Cu-Zn ferrite can be directly formed after the auto-combustion of the gel without calcinations.
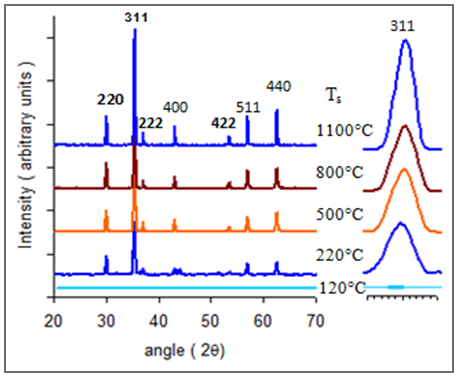
Figure (1). XRD patterns of Cu0.4Zn0.6Fe2O4 ferrite calcined at different temperatures
The increase of the calcinations temperatures results in sharper peaks with the increased intensity and higher crystallization without changes in the obtained phases.
The right side of figure (1) shows the XRD pattern of the most intense peak (311) of the Cu0.4Zn0.6Fe2O4 ferrite powders calcined at different temperatures. It can be clearly observed that the diffraction peak (311) became narrower and shifts toward bigger angles with increasing temperatures due to recrystallization processes and it results in the increase of crystallite size.
Crystallite size, lattice parameter, X-ray density and porosity of the ferrite powders were estimated from the more intense peak (311) of the X-ray diffraction patterns by equations (1-5) are listed in the Table (1).
Table (1). Observed XRD data for Cu0.4Zn0.6Fe2O4 ferrite calcined at different temperatures (for 311 peak)
     
Figure (2) shows the crystallite size increases from 18.5 to 33.9 nm with increasing calcination temperatures in the range of 220-1100 ºC for Cu0.4Zn0.6Fe2O4 ferrite, and it shows that the synthesized ferrite powders having nano-sized crystallites. The high calcinations temperature of the ferrite can cause the coalescence of smaller grains, resulting in an increased average grain size for the nano-particles. While the lattice constant decreases slightly from 8.322 to 8.309 A° with increasing calcination temperatures up to 1100°C.
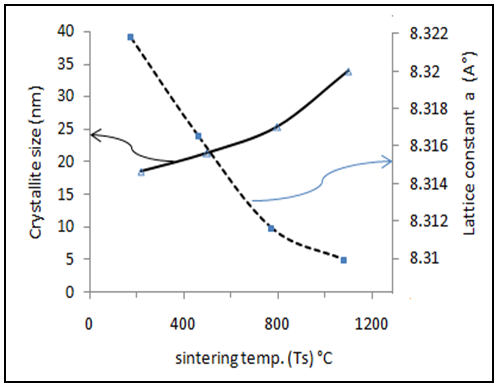
Figure (2). Variation of crystallite size and lattice parameter of the Cu0.4Zn0.6Fe2O4 ferrite with calcinations temperatures
Figure (3) shows the dependence of bulk density (dB), X-ray density (dx) and porosity (P) of the ferrite samples on the calcination temperatures. It is clearly observed that the density (dB) increases with increasing the calcination temperature and saturates at 1100°C, and consequently, the pores (porosity) decrease through diffusion kinetics.
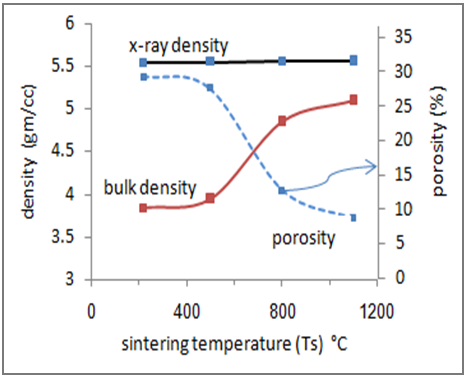
Figure (3). Variation of x-ray density, bulk density and porosity of the Cu0.4Zn0.6Fe2O4 ferrite with calcinations temperatures
Also the X-ray density (dx) depends upon the lattice parameter (a) as shown in figure (3). As the lattice constant decreases slightly with increasing calcination temperatures, a corresponding increase of the X-ray density is expected. It is also observed that X-ray densities are higher in magnitude than the corresponding bulk densities. This may be due to the decrease of pores (porosity) during the sample preparation or the calcination process.
3.1.2. XRD Characteristics of Cu1-xZnxFe2O4
The X-Ray powder diffraction pattern for the Cu1-xZnxFe2O4 ferrite samples (where; x=0.0, 0.2, 0.4, 0.6, 0.8 and 1.0) sintered at 1100°C for 3 h are shown in figure (4). The observed peaks (220), (311), (222), (400), (422), (511), and (440) confirmed the spinel structure of the samples.
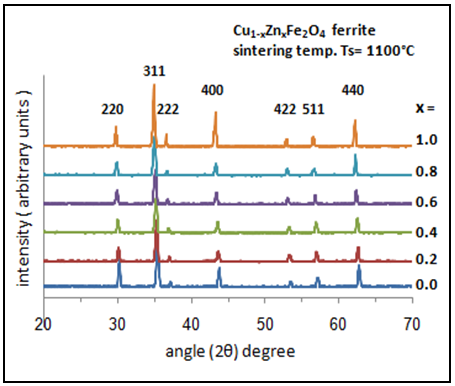
Figure (4). XRD patterns of Cu1-xZnxFe2O4 ferrite samples calcined at 1100°C with different x value
The XRD patterns in figure (4) shows that the peaks became broader and shifts toward smaller angles with increasing Zn-ion content (x), which may be attributed due to the reduced crystallite size with Zn-ion content. As a result, the mean particle size was found in the range 0f (27–36) nm calculated for more intense peak (311) of the XRD diffractogram employing by Scherrer’s formula.
Crystallite size, lattice parameter, x-ray density, bulk density and porosity of most intense XRD pattern peak (311) of Cu-Zn ferrite samples were calculated by using the relations (1-5) listed in Table (2).
Table (2). Observed data from XRD of Cu-Zn ferrite samples with Zn ion content (x)
     
The crystallite size and lattice parameter have been plotted as a function of Zn-ion content (x), in Figure (5). As can be seen, a decrease in crystallite size with respect to Zn ion content (x) has occurred, while the lattice constant (a) increase with Zn ion content (x). The increment of the lattice constant can be attributed to replacement of larger ions (RZn+2 = 0.82 Å) by smaller ones (RCu+2 = 0.70 Å).
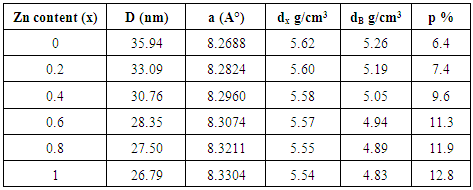
Figure (5). Crystallite size and lattice parameter of Cu-Zn ferrite samples with respect to Zn content
Bulk and x-ray densities plays important role in controlling the structural properties of the Cu-Zn ferrite. The effect of Zn substitution on the X-ray density, bulk density and porosity of the ferrite are listed in table (2) and shown in figure (6). It is observed that X-ray densities are higher in magnitude than the corresponding bulk densities. This may be due to the existence of pores which formed during sample preparation or sintering process.
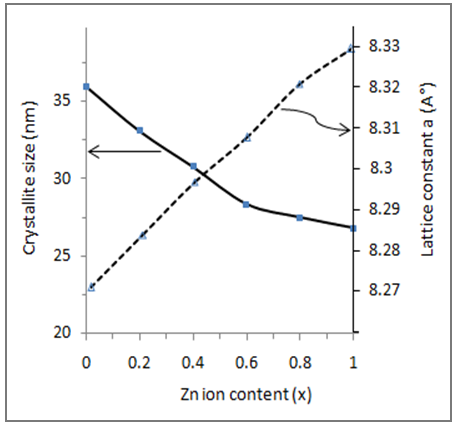
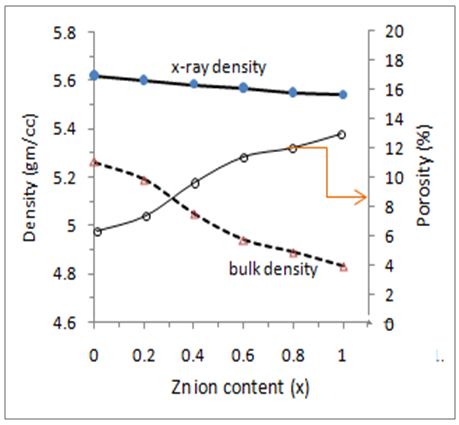
Figure (6). x-ray density, bulk density and porosity of Cu-Zn ferrite samples with respect to Zn-ion content
Figure (6) shows the effect of Zn content on the X-ray density, bulk density and porosity of the ferrite samples. It is observed that bulk density decreases with the increase in Zn content. This decrease in densities can be due to the density of Zn2+ (7.14 gm/cm3), which are lower than those of Cu2+ (8.96 gm/cm3) and Fe3+ (7.86 gm/cm3) [24]. Also the porosity values are found to be increases significantly with increasing Zn-ion content.
The Cu-ferrite at (x = 0.0) has the highest density of dB=5.16 g/cm3, dx= 5.26 g/cm3 and lowest porosity 6.4% as shown in figure (6). When the Zn content (x) increases, the bulk and x-ray densities reduced which in turn increases the porosity. Hence, it is concluded that porosity increases with the increasing Zn-ion content due to the creation of more cation vacancies with the reduction of oxygen vacancies.

3.2. Dielectric Characteristics

The variation of dielectric constant, dielectric loss tangent and a.c. conductivity with Zn-ion content were studied as a function of frequencies in the range of (50Hz to 5MHz) as shown in figures (7-14). It is seen that all the parameters decrease with increasing frequency and Zn-ion content.
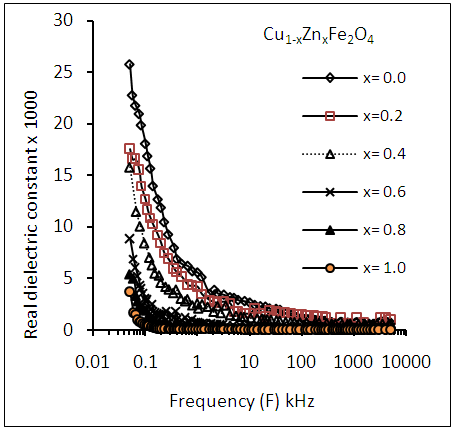
Figure (7). Variation of dielectric constant (εr' ) as a function of frequency for Cu-Zn ferrite samples for different Zn-ion content (x)
Figure (7) shows the variation of real dielectric constant εr' as a function of frequency at room temperature in the range of (50Hz to 5MHz) for Cu1-xZnxFe2O4 ferrite samples. It is observed that the dielectric constant εr' decreases with the increasing frequency. Ferrite samples are assumed to be composed of conducting grains and separated by non-conducting grain boundaries. When electrons reach such non conducting grain boundaries through hopping, and due to the high resistance of the grain boundaries, the electrons pile up at the grain boundaries and produce polarization. At higher frequencies, the electron does not follow the alternating field. This decreases the probability of electrons reaching the grain boundary and as a result the polarization decreases [25].
The dielectric constant εr' behavior of Cu-Zn ferrite is largely affected by Zn-ion content (x) at three selected frequencies 10kHz, 100kHz, and 1MHz as shown in figure (8). The decrease in dielectric constant with increasing Zn content and frequency may be due to the migration of Fe3+ ions from octahedral site to tetrahedral site which decreases the hopping and hence decreases the polarization.
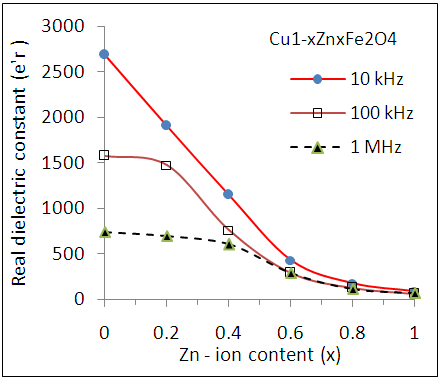
Figure (8). Variation of dielectric Constant (εr') as a function of Zn content (x) for Cu-Zn nanoferrite samples at different frequencies
The values of tangent loss (tan δε) depend on a number of factors such as stoichiometric, Fe2+ content and structural homogeneity, which in turn depend on the composition and calcination temperature of the ferrite samples.
Figure (9) shows the variation of tangent loss as a function of frequency for Cu-Zn ferrite samples with different Zn-ion content (x). This figure shows a high tangent loss initially (8.52) which decrease at high frequencies to value (0.33). The high loss tangent are due to hopping of electrons between Fe2+ and Fe3+ ions.
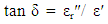
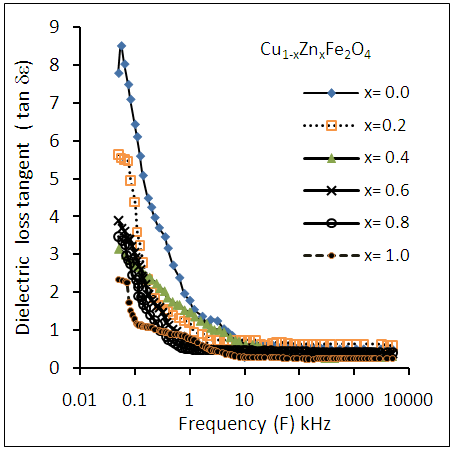
Figure (9). Variation of dielectric loss tangent (tan δε) as a function of frequency for Cu-Zn nanoferrite samples with different Zn content (x)
Imaginary part of dielectric constant (dielectric loss) εr" is calculated by using equation (7) and is an important parameter of the total core loss in ferrites. Hence for low core loss, low dielectric losses are desirable. Dielectric loss (εr") as a function of frequency for Cu-Zn nanoferrite samples with different Zn-ion content (x) is shown in figure (10). The dielectric loss profile is similar to those of the tangent loss in the previous figure. The increase in hopping electron result in a local displacement in the direction of the extent electric field causing an increase in electric polarization enhances dielectric loss factor.
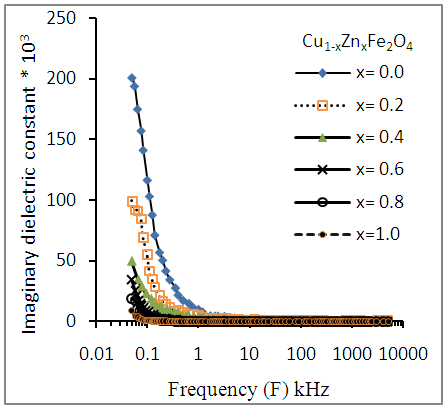
Figure (10). Variation of dielectric loss (εr") as a function of frequency for Cu-Zn nanoferrite samples with different Zn content (x)
The behavior of Cu-Zn ferrite is largely affected by Zn-ion content (x) at three selected frequencies 10 kHz, 100 kHz, and 1 MHz as shown in figure (11).
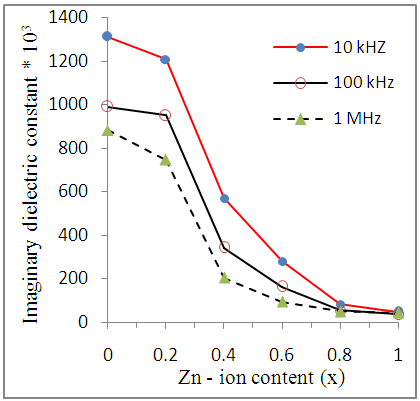
Figure (11). Variation of dielectric loss (εr") as a function of Zn-ion content (x) for Cu-Zn nanoferrite samples at different frequencies
The decrease in dielectric loss with increasing Zn-ion content and frequency takes place when the jumping frequency of electric charge carriers can not follow the alteration of applied electric field beyond certain critical frequency. And this confirms that the ferrite with high Zn-ion content suitable for use in high frequency applications.

3.3. ac. Conductivity

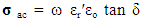
The a.c. conductivity (σa.c.) of Cu-Zn ferrites has been carried out at different frequencies in the range (50Hz to 5MHz) with different Zn-ion content (x). It was observed from the figure (12) that the σac increases with increasing applied frequency, while it decreases with increasing Zn-ion content (x) at each frequency.
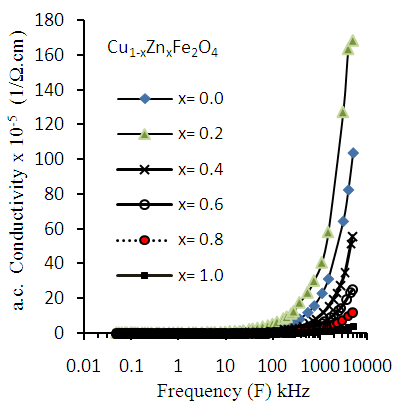
Figure (12). Variation of a.c. conductivity (σa.c.) as a function of frequency for Cu-Zn nanoferrite samples with different Zn content (x)
The hopping of electron between Fe2+ and Fe3+ ions on the octahedral sites is responsible for conduction in ferrites.
It is observed from Figure (13) that σac decreases with the increase in Zn-ion content of the Cu-Zn ferrite at different frequencies.
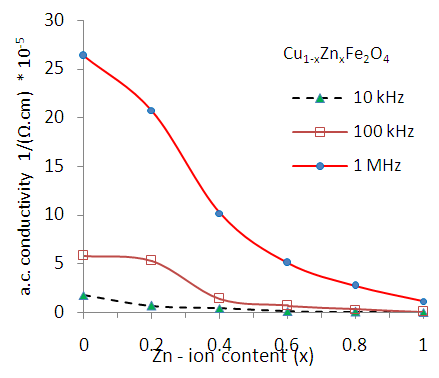
Figure (13). Variation of a.c. conductivity (σa.c.) as a function of Zn content (x) for Cu-Zn nanoferrite samples with different frequencies
In Cu1-xZnxFe2O4 ferrite system, the conduction depends upon the concentration of Zn ions on A-site to the concentration of Cu ions on B site [26].
Figure (14) shows the variation of a.c. resistivity (ρa.c.) as a function of frequency in the range 50 Hz to 5MHz for Cu-Zn ferrite samples with different Zn content (x). It can be seen that, the a.c. resistivity was decrease with increasing the applied frequency. a.c. resistivity decreases with increasing applied frequency.
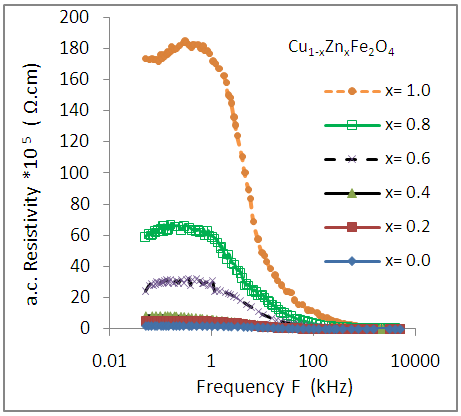
Figure (14). Variation of a.c. resistivity (ρa.c.) as a function of frequency for Cu-Zn nanoferrite samples with different Zn content (x)

4. Conclusions

The auto combustion technique yields nano crystalline single phase Cu-Zn ferrites. The XRD pattern shows the formation of single phase cubic spinel structure for all the samples. Lattice constant and porosity increase whereas X-ray density and bulk density decreases with increasing Zn-ion content in Cu-Zn samples. The crystallite size of the ferrite compositions varies from 27nm to 36 nm. Dielectric constant decreases with the increase in Zn-ion content. Dielectric constant and dielectric loss tangent both decrease with the increasing frequency and can be explained on the basis of space charge polarization. a.c. conductivity increases with increasing frequency, while, it decreases with increasing Zn-ion content This is due to the good conductivity of copper than that of Zinc. On the other hand, the a.c resistivity decreases with increasing frequency, while increases with increasing zinc content .The substitution of Zinc ion in the Cu1-xZnxFe2O4 ferrites causes appreciable changes in its structural, dielectric and electric properties. The obtained experimental results provide important information on improving properties of Cu- ferrites for electronic application.

References

[1]  Smit J. and Wijn H.P. (1959). ferrites: Physical properties of ferromagnetic oxides in relation to their technical applications, (Philips, Eindhoven).
[2]  Sellmyer D. and Skomski R. (2006). Advanced Magnetic Nanostructures, Springer, USA.
[3]  Ripka P. (2001). Magnetic sensors and magnetometers British library cataloguing in publication data, Artech House, Boston, London.
[4]  Goldman A. (2006). Modern Ferrite Technology, Springer, 2nd edition, Pittsburgh, PA, USA,
[5]  Charles S. W. (2002). The Preparation of Magnetic Fluids, Springer-Verlag Berlin Heidelberg, pp.3-18,
[6]  Awati V. V. (2013). Structural, dielectric and magnetic properties of Ni substitution in Cu-Zn nano ferrite, International Journal of Current Research, Vol. 5, Issue, 09, pp.2510-2514.
[7]  Ghasemi A. and Mousavinia M. (2014). Structural and magnetic evaluation of substituted NiZnFe2O4 particles synthesized by conventional sol–gel method, Ceramics International, V. 40, Issue 2, PP. 2825–2834.
[8]  Huq M. F., Saha D. K., Ahmed R., and Mahmood Z. H., (2013). Ni-Cu-Zn Ferrite Research: A Brief Review, J. Sci. Res., Vol. 5, No. 2, pp. 215-233.
[9]  Balavijayalakshmi J., Suriyanarayanan N., and Jayaprakash R., (2015). Role of copper on structural, magnetic and dielectric properties of nickel ferrite nano particles, Journal of Magnetism and Magnetic Materials, Vol. 385, Pages 302–307.
[10]  Rafeek ali K., Muhammed Maheem, and E.M. Mohammed, (2015). Structural and Dielectric Studies of Gadolinium Substituted Nickel Ferrite Nanoparticles, International Journal of Scientific & Engineering Research, Vol. 6, Issue 5, pp. 1688-1690.
[11]  Muhammed Maheen, Rafeek ali K., Rintu Sebastian, Mohammed E. M., (2015). Structural and Dielectric Studies of Cerium Substituted Nickel Ferrite Nano Particle, The International Journal Of Engineering And Science, Vol. 4, Issue 5, PP.33-37.
[12]  Farid M. T., Ahmad I., Aman S., Kanwal M., Murtaza G., Ali I. and Ishfaq M., (2015). Structural, electrical and dielectric behavior of NixCo1-xNdyFe2-yO4 nanoferrites synthesized by sol-gel method, Digest Journal of Nanomaterials and Biostructures Vol. 10, No. 1, pp. 265 – 275.
[13]  Bhise R. B., Rathod S. M. and Supekar A. K. (2013), Dielectric, Magnetic, Electric and Structural Properties of Ni0.2-Cox-Zn0.8-x Ferrite Nanoparticles Synthesized by Sol-Gel Auto Combustion Method, International Journal of Advancements in Research & Technology, Vol. 2, Issue1, pp. 1-6.
[14]  Pathan A. T. and Shaikh A. M. (2012). Dielectric Properties of Co-Substituted Li-Ni-Zn Nanostructured Ferrites Prepared Through Chemical Route, International Journal of Computer Applications, Vol. 45, No.21, pp. 0975-8887.
[15]  Krishna K. R., Ravinder D., Kumar K. V., Joshi U. S., Rana V. A. and Lincon A. (2012). Dielectric Properties of Ni-Zn Ferrites Synthesized by Citrate Gel Method" World Journal of Condensed Matter Physics, Vol. 2, pp. 57-60.
[16]  Kumar G. R., Kumar K. V. and Venudhar Y. C. (2012). Electrical conductivity and dielectric properties of copper doped nickel ferrites prepared by double sintering method" International Journal of Modern Engineering Research, Vol. 2, Issue.2, pp. 177-185.
[17]  Brinker C. J. and Scherer G. W. (1990)., Sol-Gel Sciences; the physical and chemistry of sol-gel processing, Academic Press, INC. New York, USA.
[18]  Standley K. J. (1962). Oxide Magnetic Materials, Oxford, Clarendon Press, Amen House, London,
[19]  Shwetambaram, AnujJain and Vakil Z. (2014). Synthesis of Zinc-Copper Nano-Ferrite and Characterization of their Structural, Electrical and Magnetic Behaviors, International Journal of Chem. Tech. Research, Vol. 6, No. 3, pp. 2207-2209.
[20]  Ajmal M. (2008). Fabrication and Physical Characterization of Ni-Zn and Cu-Zn Ferrites, Ph. D. thesis, Department of Physics, Quaid-i-Azam University, Islamabad, Pakistan,
[21]  Abbas T., Islam M. U. and Ashraf Ch. M. (1995). Study of sintering behavior and electrical properties of Cu-Zn-Fe-O system, Modern Physics Letters B, Vol. 9, No. 22, pp. 1419-1426.
[22]  Klug H. P. and Alexander L. E. (1997). X-Ray Diffraction procedures for Polycrystalline and Amorphous materials, Wiley, New York, p. 637.
[23]  Cullity B. D. (1972). Introduction to Magnetic Materials, Addison Wesley Publishing Company,
[24]  Smit J. and Wign H P. J. (1959). Ferrites, Wiley, New York
[25]  Maxwell J. C. (1973). A Treatise on Electricity and Magnetisim, Oxford University Press, New York, Vol. 1, p. 828.
[26]  Sindhu S., Anantharaman M. R., Thampi B. P., Malini K. A. and Kurian P. (2002). Evaluation of a.c. conductivity of rubber ferrite composites from dielectric measurements, Bull. Mater. Sci., Vol. 25, No. 7, pp. 599–607.