-
Paper Information
- Paper Submission
-
Journal Information
- About This Journal
- Editorial Board
- Current Issue
- Archive
- Author Guidelines
- Contact Us
International Journal of Composite Materials
p-ISSN: 2166-479X e-ISSN: 2166-4919
2015; 5(4): 81-87
doi:10.5923/j.cmaterials.20150504.03
Experimental Investigation of In-Plane Shear Deformation of Out-of-Autoclave Prepreg
 Abstract
 Reference
 Full-Text PDF
 Full-text HTML
Hassan Alshahrani , Rahul Mohan , Mehdi Hojjati
Department of Mechanical and Industrial Engineering, Concordia University, Montreal, Canada
Correspondence to: Hassan Alshahrani , Department of Mechanical and Industrial Engineering, Concordia University, Montreal, Canada.
| Email: |  |
Copyright © 2015 Scientific & Academic Publishing. All Rights Reserved.
To ensure the production of high-quality continuous fiber-reinforced composites when forming complex shapes, the potential for in-plane deformation of the woven reinforcements must be taken into consideration. The study presented here used a bias extension test to determine experimentally the in-plane shear behavior of out-of-autoclave 8-harness and 5-harness satin woven carbon/epoxy prepregs. The test was performed at different displacement rates; changes in tow geometry with respect to shear angle were observed. The various stages of deformation and the onset of wrinkling during the shearing of woven fabrics were determined by a digital image correlation (DIC) technique. An infrared (IR) heater was used to investigate the effect of different elevated temperatures on in-plane shear properties. The results of the study show that a rise in temperature results in decreased viscosity of the resin and shear force. This decrease in viscosity, in turn, increases the allowable shear deformation, which results in a reduction of wrinkling. Fabric style and yarn size were also found to have a significant influence on in-plane deformation.
Keywords: Bias extension test, Out of autoclave prepreg, In-Plane deformability, Digital image correlation
Cite this paper: Hassan Alshahrani , Rahul Mohan , Mehdi Hojjati , Experimental Investigation of In-Plane Shear Deformation of Out-of-Autoclave Prepreg, International Journal of Composite Materials, Vol. 5 No. 4, 2015, pp. 81-87. doi: 10.5923/j.cmaterials.20150504.03.
Article Outline
1. Introduction
- Composite parts are manufactured using a range of techniques, both conventional and automated. However, conventional composite manufacturing techniques, such as hand lay-up, are labor intensive, time consuming, and costly. Formability of textile composite through automated technologies can be used as an alternative process to conventional methods to reduce the manufacturing time and cost. Hot drape forming of thermoset composites has shown promising results in the aerospace and automotive industries, consistently producing a high-complexity and high-volume output [1]. This forming process works by transforming uncured flat laminates, created by automated technologies such as Automated Tape Laying (ATL) or Automated Fiber Placement (AFP), into three-dimensional shapes through the application of heat and pressure. This is followed by a curing process [1, 2]. In the aerospace industry, autoclaves are typically used to cure composite structures. However, there are disadvantages to the autoclave process, include long cycle times and high operational costs [3]. Therefore, the present study investigates out-of-autoclave (OOA) prepregs, which reduce overall processing time and cost of hot drape forming. To produce complex shapes without flaws (such as wrinkles), it is important to take into account the deformation mechanisms such as in-plane shear and inter-ply friction for multi-layers forming. However, the ability of the material systems to shear along fiber directions (in-plane shear) is considered to be a key deformation mechanism that increases the degree of formability [4]. Thus, both the material characteristics of uncured composites and the parameters that influence formability must be better understood. Research published on forming of prepreg is shown that formability is influenced by the uncured material properties and ply-thickness [5, 6]. Moreover, the resin compound and the impregnated level have impact on the forming results [7]. During the forming of woven fabric, the in-plane shear is the dominant deformation mechanism [1]. The in-plane deformation for woven reinforcements is characterized by rotation of the yarns at their crossovers, which causes a change in fiber orientation. This rotation around weave crossover is mainly limited by the ability of fiber yarns to become in contact with each other. A number of previous studies have investigated the in-plane shear deformation of woven reinforcements under conditions of bias extension [8-10]. However, not much data on the behavior of out-of-autoclave thermoset prepregs has been published. To describe the in-plane shear behavior of weaves, this study employed the pin-jointed net (PJN) model, originally proposed by Taylor and Mack [11]. The PJN model assumes that the fibers are inextensible and no slippage is permitted at crossover points, although it allows for free rotation of the fibers [12]. Degree of in-plane shear of woven is indicated by the shear angle between the weft and warp yarns. When this shear angle becomes locked, wrinkles may occur in the woven fabric [9, 10]. Both the bias extension test and the picture frame test are frequently employed to investigate the in-plane shear behavior of woven composites [8-10, 13].The present study aims to characterize the in-plane shear behavior of the out-of-autoclave 8-harness and 5-harness satin woven carbon/epoxy prepregs. In particular, the impact of displacement rate and temperature variation on in-plane shear deformation is examined. A digital image correlation (DIC) technique is employed to determine the various stages of deformation during woven fabric shearing. Finally, we apply the PJN model to the results of the experiments to examine how the material in question responds to in-plane shear and draw conclusions about how to avoid a potential wrinkling during OOA prepreg forming process.
1.1. Bias Extension Test
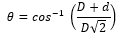
- In a bias extension test, the material is extended along the bias, beginning at ±45º to the direction of applied tensile force. The bias extension test has the advantage of being able to be performed on any tensile machine. The specimen for the test can be divided into three zones, as depicted in Fig. 1. In order to obtain a uniform deformation in zone A, the specimen’s length L must be equal to or greater than twice its width W. The initial angle θo is 45º, while the final angle θ can be deduced from the specimen geometry as shown in equation (1) [10, 14].
 | (1) |
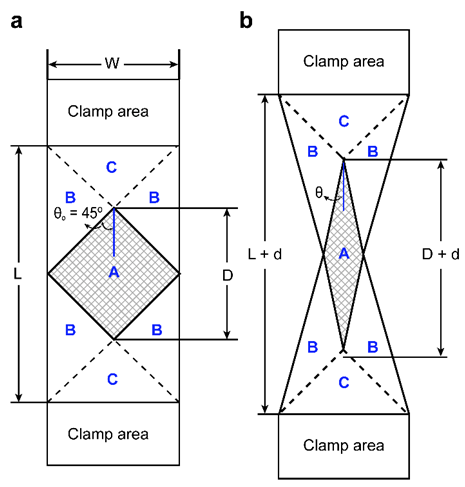 | Figure 1. Bias extension test: (a) initial specimen, (b) deformed specimen |
 between the weft and warp yarns in zone A can be calculated using equation (2). The shear angle in zone B is half that of zone A; zone C remains undeformed.
 | (2) |
2. Materials and Method
2.1. Materials
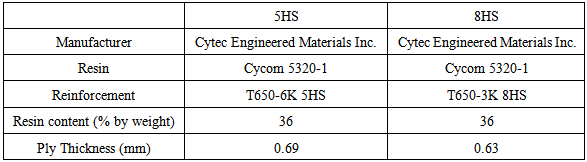
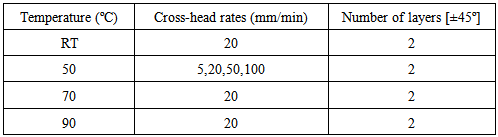
- The materials tested in this study were the 5-harness (5HS) and 8-harness (8HS) satin carbon/epoxy woven-fiber prepregs, toughened with epoxy resin (Cycom 5320-1) designed for OOA manufacturing applications. Table 1 summarizes the material properties of these two prepregs.
|
2.2. Specimens
- The specimens selected for the bias extension test were 150 mm long by 50 mm wide, with an ungripped length of 100 mm. White random speckle patterns were marked in zones A and B to assist in the measurement of in-plane displacement fields and the wrinkling occurrence via a digital image correlation (DIC) technique. The aspect ratio (L/W) was set at two in order to obtain a uniform deformation in zone A. The specimens cut from woven carbon/epoxy prepreg in both 5HS and 8HS satin had their fiber direction set at ±45º to the direction of applied tensile force. All tests were carried out on two layers at [±45º] and consolidated using vacuum bagging for 30 min.
2.3. Test Methods
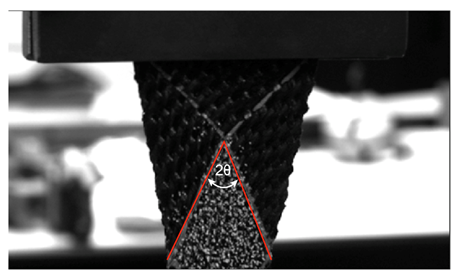
- The bias extension specimen was clamped using two custom-designed grips, which were tightened by two bolts to ensure uniform clamping force over the grip section as shown in Fig. 3. The tests were performed using a tensile testing machine and a non-contacted infrared heater for the elevated temperature tests. In order to ensure uniform heating during the elevated temperature tests, the specimen was held at the same heat for 10 minutes after reaching the processing temperature. Two digital cameras took regular snapshots of the test, which were subsequently fed to a DIC software program, Vic-3D correlated solution, to measure the strain fields in pixels between the speckle patterns. The images taken of each test were inserted into AutoCAD software in order to measure the change in fiber angle (2θ), as shown in Fig. 4. Tests were carried out at four cross-head rates and at four temperatures (see Table 2). At least two trails were conducted under each condition.
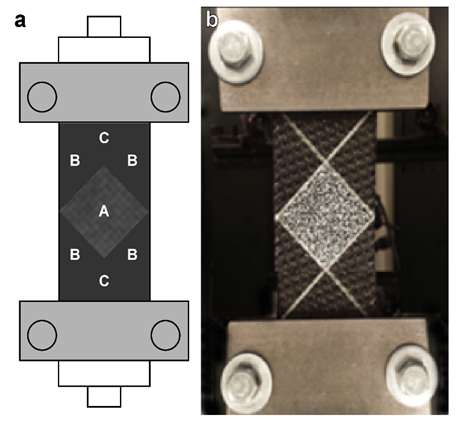 | Figure 2. Tensile custom grips with undeformed specimen: (a) schematic, (b) photograph |
 | Figure 3. Measurement of the material angles at zone A during the test |
|
3. Results and Discussion
3.1. Bias Extension Test
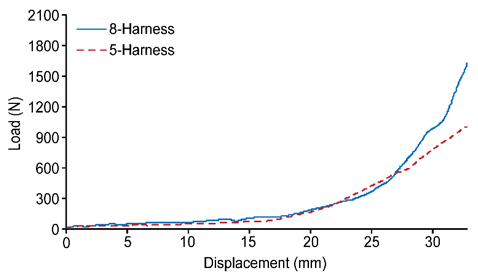
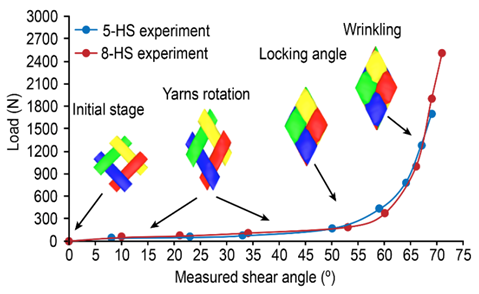
- The test results are based on load-displacement curves that were recorded from the tensile testing machine at different test conditions. Fig. 4 shows the typical load-displacement response of the 5HS and 8HS satin woven carbon/epoxy prepregs at room temperature with a constant displacement rate (20 mm/min). The initial stiffness variation is very low, particularly up to a displacement of 15 mm. However, the shear resistance of 8-harness is relatively high compared to 5-harness at that range. The load was compared to the measured shear angle to determine the limit of in-plane shear deformation (locking angle) of selected materials and to compare the behavior of these materials with respect to several processing parameters. Once the axial force increases sharply in the load-shear angle curve, the locking angle is reached and onset of wrinkles occurs [8, 11, 17].
 | Figure 4. Load-displacement response at room temperature and 20 mm/min |
 | Figure 5. Load vs. measured shear angle curves at room temperature and 20 mm/min |
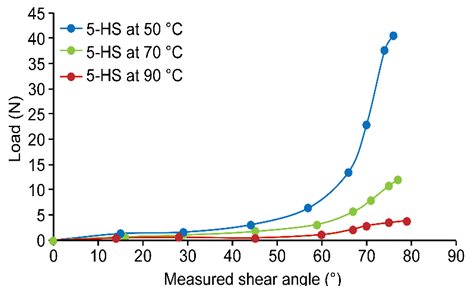
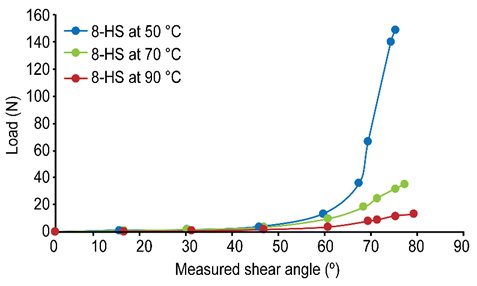
3.1.1. Influence of Elevated Temperature
- In the formation process, the sample is heated before being formed. The effect of processing temperature on the in-plane shear deformation must therefore be taken into consideration. Figs. 6 and 7 show the effect of elevated temperatures on the deformability of 5HS and 8HS materials respectively. The samples were tested at three different temperatures (50°C, 70°C and 90°C) and 20 mm/min. The results show that shear resistance decreased significantly with increasing temperature. Temperature is strongly correlated with matrix viscosity; thus, higher temperatures should reduce load and thus reduce the effect of frictional resistance between layers. Although the curves of 5HS and 8HS showed similar trends, the load respose was significantly higher for 8HS. However, the limit of deformation was also higher for 8HS at all temperatures. These results show that shear angle and the limit of deformation cannot be only attributed to the shear resistance. This observation confirms the findings of Larberg et al. [16], who compared three different material systems.
 | Figure 6. Bias extension test on 5-harness at different temperatures and 20 mm/min |
 | Figure 7. Bias extension test on 8-harness at different temperatures and 20 mm/min |
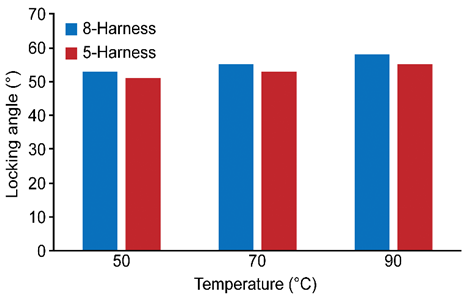 | Figure 8. Locking angles of 5-harness and 8-harness at different temperatures |
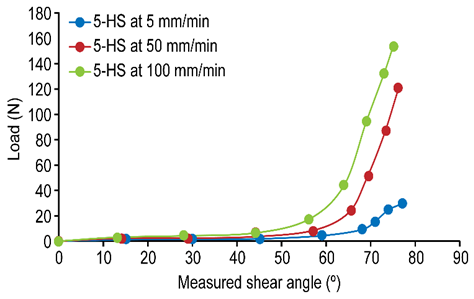
3.1.2. Influence of Strain Rate
- Strain rate simulates the rate of formation during the forming process. The effect of strain rate on in-plane shear at elevated temperature is shown in Figs. 9 and 10. For both the 5HS and 8HS prepregs, a clear correlation was found between strain rate and the load required to shear the material at a given temperature. The higher the strain rate, the higher the load required to shear the sample. For an increasing strain rate of 5 to 50 mm/min, load increases by approximately 35% and 40% up to 10 mm for the 5HS and 8HS prepregs, respectively; beyond a displacement of 10 mm, the load was more than double. At higher strain rates, the two prepregs showed different responses to variation (see Figs. 9 and 10).
 | Figure 9. Bias extension test on 5-harness at different strain rates and 50°C |
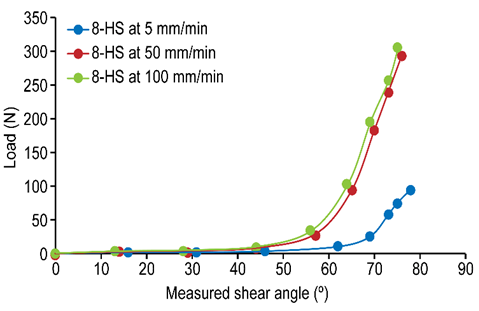 | Figure 10. Bias extension test on 8-harness at different strain rates and 50°C |
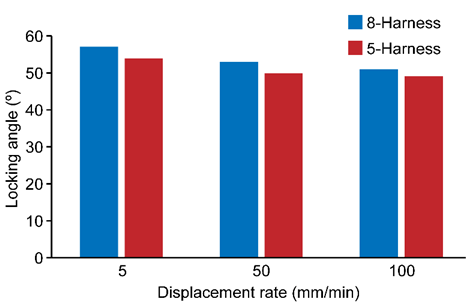 | Figure 11. Locking angles of 5-harness and 8-harness at different strain rates |
3.2. Digital Image Correlation Analysis
- In order to measure the strain fields on the sample surface, two digital cameras were used to take snapshots during the test. The resulting images are analyzed using the Vic-3D correlated solution [19], which measured the strain contours by calculating the strains at the sample surface based on the obtained displacement vectors. The contour plots of shear strain field at different deformation stages are shown in Fig. 12.
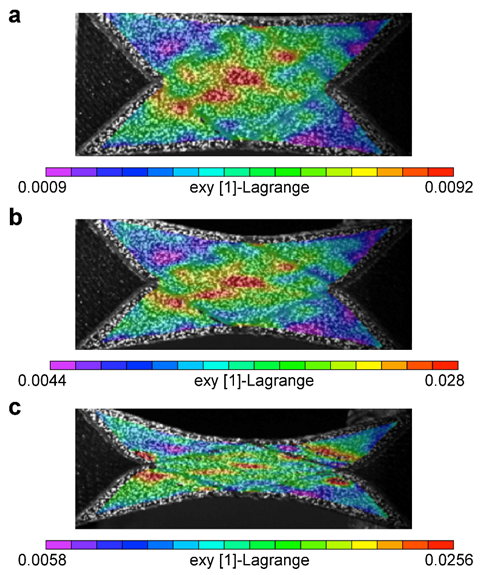 | Figure 12. Shear strain field at different measured shear angles: (a) = 22°, (b) = 43°, (c) = 66° |
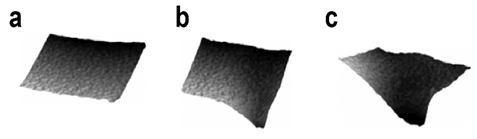 | Figure 13. 3D-images of zone A at different measured shear angles: (a) = 48°, (b) = 55°, (c) = 60° |
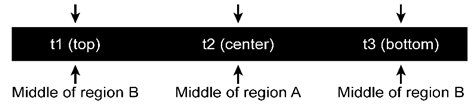
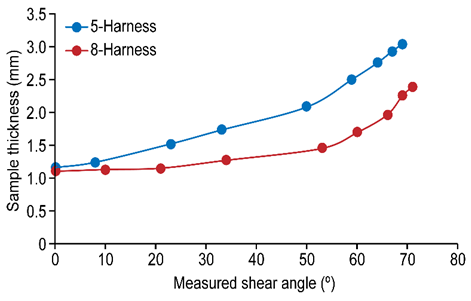
3.3. Thickness Variation
- The sample thickness was measured at room temperature to ±0.01 mm accuracy using a digital caliper and divided into three regions, t1, t2 and t3, as shown in Fig. 14. These three values of sample thickness were measured at each 5 mm of axial displacement and the average among them was calculated. The initial average sample thickness at 0º shear was 1.16 and 1.1 mm for 5HS and 8HS, respectively. The results of thickness variation of 5HS and 8HS during the bias extension test are shown in Fig. 15. For the 8HS sample, the thickness remained constant up to a shear angle of 21º and then increased by 26% up to the locking angle. Beyond the locking angle, the thickness increased rapidly, by approximately 65%. By contrast, the thickness of the 5HS material increased even at smaller shear angles, due to the alteration in yarn shape during deformation. Chang et al. [21] investigated the change in yarn geometry of dry satin weave fabric with shear angle in a microscopic level. The study showed that yarn thicknesses tends to increase as the shear angle increases; the authors found a relatively small change in yarn geometry at a smaller shear angle (up to about 15º). However, McBride et al. [22] observed that fabric thickness was independent of shear deformation on dry plain weave fabric during bias extension tests. This phenomena needs further investigation, particularly at the microscopic level during shear deformation.
 | Figure 14. Measurements of sample thickness during bias extension test |
 | Figure 15. Variation of sample thickness during bias extension test |
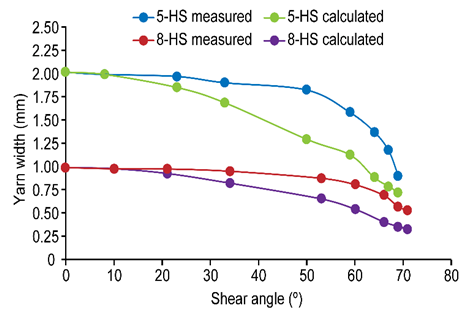
3.4. Yarn Width Variation
- The same sample that was tested for thickness variation was used to capture the change in yarn width during the test. Five yarn width values in zone A were measured and averaged. Fig. 16 shows how the yarn width changed with increasing shear angle. In the first stage (below the locking angle), the yarn width decreased slightly as the shear angle increased, for both the 5HS and 8HS samples. At this point, the lateral compression to the yarn is small and the spacing between them is not zero yet [4, 13]. However, once the shear angle is locked, the lateral compression increases substantially as the adjacent yarns start to compress each other. Zhu et al. [4] proposed a relationship between the shear angle and yarn width during the picture frame test, as shown in equation (3).
 | (3) |
 | Figure 16. Variation of yarn width during bias extension test |
 is the initial yarn width and
  is the measured shear angle. They found that the variation between measured and calculated yarn width is relatively small when the shear angle
  < 50º. However, the yarn width decreases more quickly when the shear angle is about 50º. The same equation was applied in the present study to examine the relation between measured and calculated yarn width during the bias extension test (see Fig. 20). The results show that the measured yarn width does not follow the calculated yarn width, especially beyond a shear angle of 15º. This observation is probably related to the boundary condition in the picture frame test, which makes that test more likely to introduce pure shear [10, 23]. In contrast, the yarn in the bias extension test is subject to free-end edges. Since yarn-width reduction is a key for wrinkling, as reported in [4], it is important to investigate the contribution of resin. This will be considered in a future study.
4. Conclusions
- This study investigated the in-plane shear deformation of out-of-autoclave 8-harness and 5-harness satin woven carbon/epoxy prepregs using a bias extension test. The results show that selecting a higher temperature and a slower forming rate may help to increase the limit of in-plane deformation, thereby prevent defects such as wrinkling and fiber misalignment. On a broader level, this study shows the effect of processing parameters such as viscosity, especially at elevated temperatures. However, it should also be noted that fabric architecture and yarn size have a significant influence on in-plane deformation, as can be seen by the different results reported for 8HS and 5HS in measures of locking angle. In particular, we found that the locking angles of 8HS carbon/epoxy prepregs are higher than for 5HS prepregs, which we attribute to the difference in fabric architecture and yarn width. Thus, the presence of fewer crossover regions between weft and warp in the fabric helps to increase the degree of drapability. However, the onset of wrinkling during the bias extension test is not always correlated with a locked shear angle. The results from the bias extension test can be used to predict the optimal processing parameters for prepreg formation. However, models that take into account slippage at the woven fabric crossover and the resin effect remain to be developed.
ACKNOWLEDGEMENTS
- The authors of this paper would like to acknowledge the financial support of NSERC (Natural Sciences and Engineering Research Council of Canada). Thanks to Bombardier Aerospace for supplying the materials and to Dr. Farjad Shadmehri for his cooperation. Supporting provided by Najran University is also gratefully acknowledged.