-
Paper Information
- Previous Paper
- Paper Submission
-
Journal Information
- About This Journal
- Editorial Board
- Current Issue
- Archive
- Author Guidelines
- Contact Us
International Journal of Composite Materials
p-ISSN: 2166-479X e-ISSN: 2166-4919
2015; 5(3): 65-70
doi:10.5923/j.cmaterials.20150503.03
SAXS Study of Silicon Nanocomposites
 Abstract
 Reference
 Full-Text PDF
 Full-text HTML
E. A. Odo1, D. T. Britton2, G. G. Gonfa3, M. Harting2
1Department of Physics, Federal University Oye-Ekiti, Oye-Ekiti, Ekiti State Nigeria
2Department of Physics, University of Cape Town, Rondebosch, Cape Town South Africa
3Department of Physics, Haramaya University, Dire Dawa, Ethiopia
Correspondence to: E. A. Odo, Department of Physics, Federal University Oye-Ekiti, Oye-Ekiti, Ekiti State Nigeria.
| Email: |  |
Copyright © 2015 Scientific & Academic Publishing. All Rights Reserved.
The structural and interfacial properties of the inclusion of silicon nanoparticles in two classes of polymeric binders (1) a soluble polymer, and (2) a polymerizing monomers were investigated using small angle x-ray (SAXs) technique. The soluble polymers were cellulose acetate butyrate (CAB), and commercial quality, low density polystyrene foam (PS). The polymerizing monomer binders were a commercial acrylic printing base (ACR), and refined linseed oil (LIN). Analysis of the obtained SAXs result using the Gunier scheme suggests that the dispersion of the powders in the different binders consisted of a broad distribution of size heterogeneities, one in which the cluster mass is not uniform but varies over a size distribution in the range 69 to 74nm. Further analysis using Porod’s law revealed that the ACR, CAB and PS based composite resulted in a surface fractal structure while the LIN based composite gave a characteristic mass fractal with the size of the basic particles ranging from 61nm to 74nm in agreement with the Gunier analysis, while the size of the aggregate clusters ranges from 338 to 370nm. Analysis of the deviation from porods law from the SAXs data reveals that the all of the binder formed a diffuse interface with the embedded silicon powder except the LIN based composite sample which exhibited a two-phase system with electron density inhomogeneity.
Keywords: Nanocomposites, Small Angle X-ray Scattering (SAXs), Fractal
Cite this paper: E. A. Odo, D. T. Britton, G. G. Gonfa, M. Harting, SAXS Study of Silicon Nanocomposites, International Journal of Composite Materials, Vol. 5 No. 3, 2015, pp. 65-70. doi: 10.5923/j.cmaterials.20150503.03.
Article Outline
1. Introduction
- The inclusion of a nano or molecular domain sized filler into organic polymer, metal or ceramic matrix materials have been attracting a lot of attention because these materials are novel alternatives to traditional composites and bulk materials in many applications [1]. Apart, the advances in synthetic techniques and the ability to readily characterize such materials are other reasons for the present interest. Functionally active nanocomposite is the result of the inclusion of semiconductor nanoparticles, for example, silicon in a polymeric matrix. The electrical properties of semiconductor inks produced in this way, can be tuned by varying the proportion of the filler in the polymer matrix. Such inks, can be prepared for screen printing and inkjet printing. To obtain high efficiency of such systems, it is necessary to have an interpenetrating network of electron conducting or hole conducting components within the device to supply a free path for charge carriers [2].Direct dispersion of nanoparticles in a solution of insulating or polymeric binder followed by polymerization for example, may result in either a randomly dispersed or ordered dispersion of the nanoparticles in the matrix. The dispersion of hydrophilic inorganic particles like silicon particles into hydrophobic polymers (e.g., polystyrene or polypropylene) should lead to a phase separation or agglomeration of the particles, which may likely result in poor mechanical, optical, and electrical properties [3]. For such systems, the electronic properties of the nanocomposite is dominated by the matrix. In some cases, however, the particles may form randomly distributed clusters and super-clusters in the matrix, which are direct consequences of the nanoparticles themselves [4]. In both cases the structure of the nanocomposites will depend largely on the particle-interface interactions in the chosen polymer matrix, and the production process [3, 4].The size, shape and clustering of nanoparticles in the nanocomposite are of fundamental interest to understand the microstructure of such a heterogeneous material. When the contrast is sufficient, i.e. there is a clear difference in electron density between the embedded particles and the matrix, small angle X-ray scattering (SAXS) gives valuable information about the structure of the composite. Apart from the size, shape and size distribution of the scatterers, SAXS is also sensitive to the spatial fluctuation of electron density between the scatterer and the medium around it, but not on the degree of crystallization [5].The aim of this work is to investigate the structural and interfacial properties of a functional hybrid material prepared by dispersing P type silicon powder produced by mechanical milling, into two classes of polymeric binders, using small angle X-ray scattering. Since the composite is a two-phase material, the implication of a possible deviation of the result from Porod’s law shall be presented. The study is based on the results of small angle X-ray scattering (SAXS) experiment carried out on two types of nanocomposite layers, printed on flexible plastic substrates.
2. Theory
- The SAXS intensity is determined experimentally as a function of the scattering vector
 given by
  . Where
  is the wavelength of the X-ray beam and
  is the scattering angle [6]. In general the SAXS intensity can be represented as
  | (1) |
 is the number of scattering elements in an irradiated volume and
  is the square of the number of electrons in the scattering volume.Two main features can be observed from the scattering pattern in the small angle regime. First, a typical plot of
  versus
  gives a power-law decay, and secondly, this power-law decay begins and ends with an exponential regime that appears as knee or inflection reflecting a preferred size described by
  [7]. Two basic theories exist for the analysis of the dependence of scattering intensity on scattering vector
  , usually derived from a SAXS experiment. They are namely Porod's law, for regions where
  , and Guinier's Law for regions where
  . An approach described as the unified Guinier/Power-law is a combination of the two basic theories [8].
3. Experimental Procedure
- The nanocomposites used for this study were produced from the inclusion of nanopowder milled from P-type wafers for a total time of 1 hour in two classes of polymeric binder, (1) a soluble polymers, and (2) a polymerizing monomers. The soluble polymers were cellulose acetate butyrate (CAB), from Goodfellow Ltd. UK, and commercial quality, low density polystyrene foam (PS). The polymerizing monomer binders were a commercial acrylic printing base (ACR), from Daler-Rowney, USA, and refined linseed oil (LIN) from Windsor and Newton, UK. The solvent used was trichloromethane, except for the acrylic base, which is only soluble in polar solvents for which ethanol was used. The compositions are designated according to the type of binder used in forming the nanocomposite, for example PCAB refers to the P powder in CAB binder. Four types of Inks were mixed using 400 mg of silicon powder. For the soluble polymers the silicon powder was mixed with 160mg of binder. To obtain approximately the same volume fraction of binder, for the polymerizing monomer binders, 320mg of acrylic base and 200mg of linseed oil were used, respectively. Solvent (4ml) was added to obtain a printable composition in all cases except for the inks containing linseed oil, which naturally already had a lower viscosity. In this case, only a
 of trichloromethane was used. Layers were then hand printed, by spreading the ink with a glass rod to obtain a uniform layer, on cellulose acetate film of thickness
  . In the central area of the print, the silicon layers were uniformly opaque, but at the edges of the printed area there were visible non-uniform regions of varying transparency. To within the
  accuracy of a micrometer screw gauge, the layers were uniform in the central region of the print, which was used for the measurements. On a macroscopic scale, there was no indication of phase separation resulting from either sedimentation or flocculation after deposition. In addition, samples were produced by printing the different binder and solvent combinations on the same substrates without the addition of silicon. The printed layers were left for one week to cure under ambient conditions, prior to the SAXS measurements. After this period, all the pure binder layers were dry to the touch, although it is likely that the linseed may not have been fully polymerized. SAXS experiments were carried out, in transmission geometry, on beamline D11A at the National Synchrotron Light Laboratory (LNLS) facility located in Campinas, Sao Paulo, Brazil. The beam line is equipped with two kapton scattering films and detectors, positioned on each side of the sample holder, to monitor the primary beam intensity and absorption in the sample chamber. A detailed description of the LNLS SAXS beam-line can be found in [6, 9]. Air scattering and parasitic scattering, from the sample holder were determined by measuring with an empty sample chamber and empty sample holder respectively. Similarly, the substrate signal was measured using a blank cellulose acetate film in the sample holder. Three sets of slit collimators were used in this study. The incident X-ray wavelength was
  , and the scattering intensities were measured with sample-to-detector distance 1.077m, yielding and effective angular range of
  above the primary beam. The corresponding range of
  values over which the measurement was carried out was
  . The measurement times were 3600s for each sample. Conversion from detector position in channels to scattering vector and standard corrections, were made on-site with software provided with the instrumentation. This program uses established algorithms and measured data to correct for the detector inhomogeneity, intensity variation and parasitic scattering. The measured substrate contribution was subtracted, as a variable parameter in proportion to the measured attenuation, in the subsequent data analysis. It was found, however, that, because the scattering from silicon is much higher than that from the carbon-based substrate material, magnitude of this correction had little effect on the final results.
4. Results and Discussion
4.1. Aggregate Size Determination Using Guinier's Analysis
- Fig. 1(a) and (b) shows the Guinier plot
 for the PACR and PLIN samples representing the two classes of nanocomposite in this study. Shown on the graphs are linear fits to two regions and some parameters derived from the results of the linear fits (shown in the inset of the graphs). As seen from the plots for the PACR and PLIN nanocomposite sample respectively, the shape of the curves does not show a linear dependence for the whole range of
  . Guinier plots for the samples PCAB and PPS exhibited similar behavior. This suggests that the dispersion of the powders in the different binders consisted of a broad distribution of size heterogeneities, i.e. a poly-dispersive system, one in which the cluster mass is not uniform but varies over a size distribution [10, 11]. A careful investigation of the Guinier plots for all the samples reveals two linear regions; (1) in the low
  regions characterized by a short
  range, followed by (2) a relatively wide
  range in the higher
  region separated from the first by a transition region (elbow). For all the systems considered, the radius of gyration for the two linear regions, designated
  and
and  , was calculated from the slopes of the best linear fit to the regions as demonstrated in Fig. 1(a) and (b) for the PACR and the PLIN samples. The top and bottom inset displays the estimates of the radius of gyration
  , aggregate radius
  (where
  is the estimate for the top region and
  for the bottom region) and the regions of validity of such estimates, which is derived from
  assuming a composite system with embedded homogeneous and spherical nanoparticles, with radius of gyration
  and the radius of the particle
  . Similar results were obtained for the samples PCAB, and PPS. Since the
  values are indication of the structural features at various length scales, the larger value of the slope of the linear region (1) compared to (2) indicates a relatively larger number of scatterers in the region (1) than in (2) [12]. This can also be inferred from the relatively larger sizes of the cluster aggregates in the region (1).
 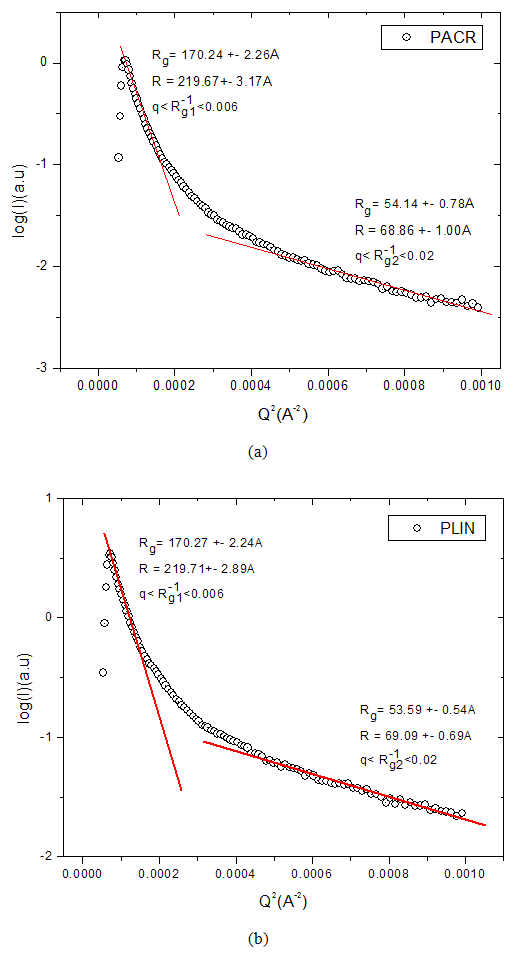 | Figure 1. Guinier plot showing two linear regions from which the radius of gyration  and corresponding aggregate sizes and corresponding aggregate sizes  was calculated for the composites (a) PACR and (b) PLIN was calculated for the composites (a) PACR and (b) PLIN |
 from a Guinier plot is valid in the
  range where
  is less than 1 [12, 13]. In all the cases considered, the estimated
  values for the first observed linear region may not be valid for the region over which
  was calculated, because the range of
  in this region is greater than unity. The
  values on the other hand may be considered valid in the small
  region for which
  for the entire nanocomposite samples considered in this work. The aggregate size, assuming the composites consisted of spherical particles was estimated for the four samples using the expression
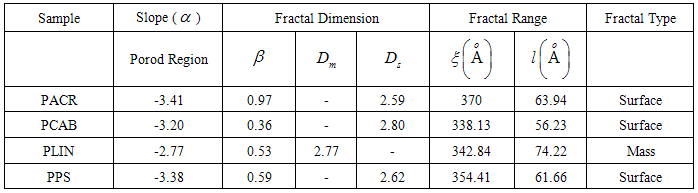
  .Table 1 shows the calculated values for radius of gyration for the second linear regions for which
  and the corresponding radius of aggregate
  derived from the linear fit to the second region. The smallness of the linear regions that defines the Guinier regime
  confirms, as mentioned earlier, that the nature of the PACR, PCAB, PLIN and PPS nanocomposite samples are all poly-dispersive, with inter-particle interactions, typical of overlapping systems, and the
  values may represent a spatial correlation length or a measure of the mean cluster radius [10].
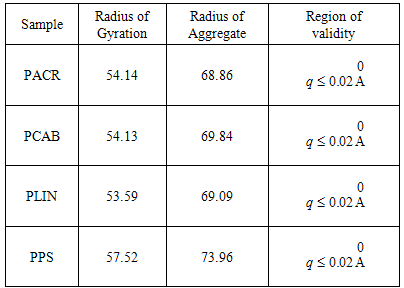
 and
and  with respect to the binder type, one does not see a clear trend, as the radius of gyration and radius of the cluster is seen to vary about the average values. The calculated
  values in all the cases are much lower than the average particle size derived from the TEM study of the P*1 powder reported in [14]. These may only suggest that the range of
  values used in this experiment is only suitable for determining sizes of particle or aggregates of relatively larger sizes.
4.2. Fractal Type Determination Using Porod's Law Analysis
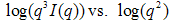
- Fig. 2(a) and (b) shows the Porod plots,
 vs.
vs.  for two of the samples considered above. Just after the Guinier region earlier discussed, is a region with a power law behavior. This region has a slope
  for the PACR as shown in Fig. 2(a). Similar plots for the other samples PCAB and PPS (not shown) exhibited slope
  except in the case of PLIN which exhibits a slope
  in this region as show in Fig. 2(b). It has been reported that fractal rough surfaces, have a slope which varies between
  with an associated surface-fractal dimension
  . Thus, samples PACR, PCAB and PPS possess a surface fractal behavior, with the range of such fractal behavior defined by
  [15]. Where the upper bound limit
  represents the size of the aggregate or cluster and the lower limit
  represents the size of the basic particles (the constituents of the aggregates) [15] deduced using
 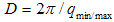 , where
  and
and  represents the upper and lower bound respectively. In the case of PLIN where the slope value
  , the structure is said to have a characteristic mass fractal behavior with upper and lower bound limit similar to that discussed for surface fractal features of PACR, PCAB and PPS composites.
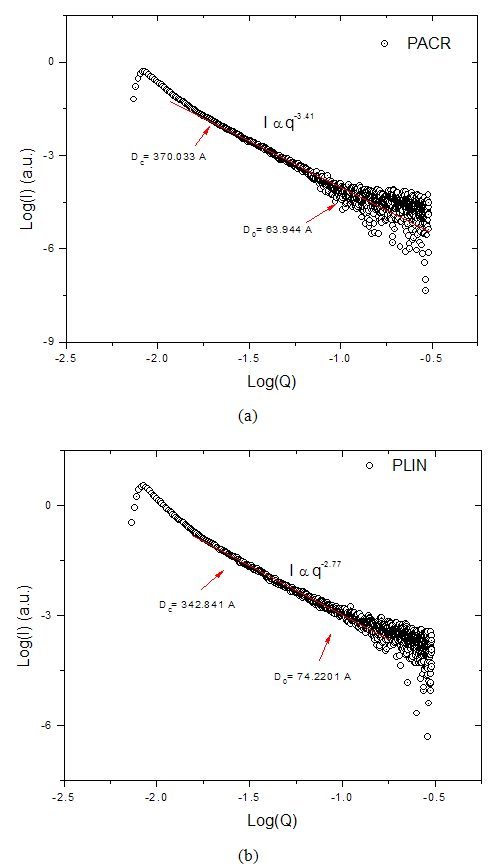 | Figure 2. Porod plot from which the fractal behavior and aggregate size of the unit was calculated for (a) PACR (b) PLIN nanocomposite |
 Porod regime, and also listed is the possible fractal behavior that can be associated with the different nanocomposite.
|
4.3. Deviation from Porod's Law due to Presence of Diffuse Interfacial Regions
- Many two-phase materials can be described either with a sharp phase boundary, having well defined step-like changes in the scattering length or electron density. These systems obeys Porod's law in the small-angle scattering vector asymptotic region, while the diffuse interfacial region causes deviation from Porod's law [16]. The nature of the phase boundary in a nanocomposite can be investigated by the plot of the Porod's law for slit collimated SAXs intensity from
 which is derived from equation [17, 18]
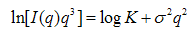 | (2) |
 is a parameter related to the interface thickness or to the size of electron density inhomogeneity [17], which depends on whether this region shows a negative or positive deviation.Fig. 3(a) and (b) shows the plot of
  vs.
vs.  for two of the samples representing the two classes of nanocomposite used for this study. From these plots it is clear that the PACR sample Fig. 3(a) exhibits a negative deviation from Porods law. Similar plots for the samples PCAB and PPS exhibited negative deviations from Porods law characteristic. Such negative deviations are the characteristics of non-ideal two-phase system with a diffuse interface layer between the particle and matrix [17, 18]. The PLIN sample on the other hand, as is seen in Fig. 3(b), exhibited a positive deviation from Porods law. This positive deviation is characteristic of a two-phase system with electron density inhomogeneity [17, 18] in the particles. This is probably unphysical when compared to the other samples and may be an artifact due to a residual background. Coincidentally the PLIN systems are the only nanocomposite that exhibit mass fractal behavior in the Porod region, suggesting a possible correlation between the sign of deviation from Porod's law and fractal characteristics. By fitting the data in these regions to (2), describing the negative deviation from Porod law, the value
  , representing the extent of deviation from and ideal Porod's law behavior taking as the reference (zero line), was calculated from the slope of the best line of fit to this region as shown in the inset of the graphs.
 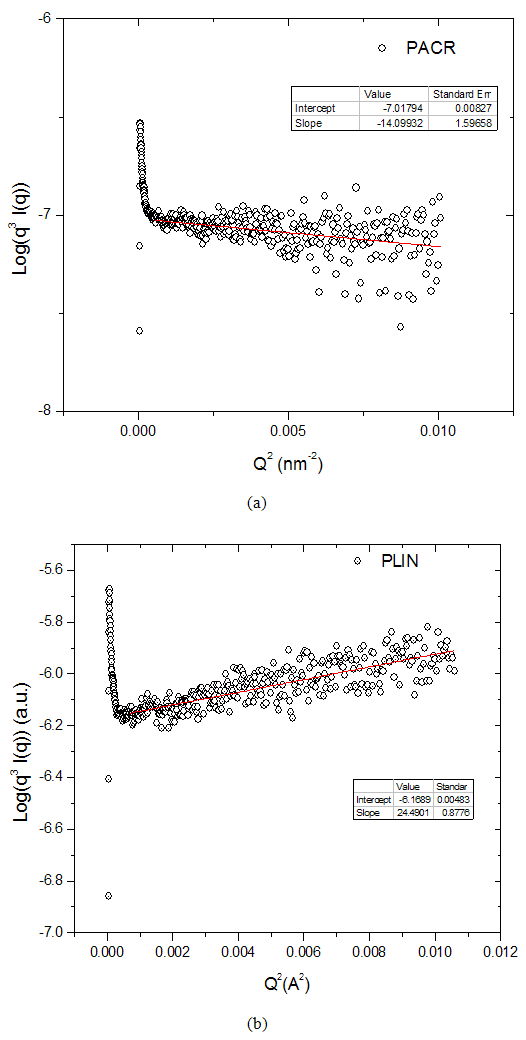 | Figure 3. Showing plot of 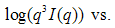  for the composite (a) PACR (b) PLIN for the composite (a) PACR (b) PLIN |
|
5. Conclusions
- The structural and interfacial properties of the inclusion of P-typed silicon nanoparticles in two classes of polymeric binders (1) a soluble polymer, and (2) a polymerizing monomers have been studied using small angle x-ray (SAXs) technique. Analysis of the SAXS data using Guinier's law revealed that the nanocomposites consisted of particles with a broad distribution of sizes heterogeneities. Analysis of the experimental data using Porod's law revealed that all the nanocomposite samples formed surface fractal aggregates with the exception of PLIN composites which show a mass fractal behaviors. Further analysis showed that the PACR, PCAB and PPS samples have characteristic non-ideal two-phases with a diffuse interface layer between the particles while the PLIN sample exhibited a positive deviation from Porods law characteristic of a two-phase system with electron density inhomogeneity in the particles.
ACKNOWLEDGEMENTS
- The author’s wishes to acknowledge all the support given by staffs of the National Synchrotron Light Laboratory (LNLS) facility located in Campinas, Sao Paulo, Brazil.
References
| [1] | T. Tanaka, G.C. Montanari, R. Mulhaupt, IEEE Transactions on Dielectrics and Electrical Insulation, 11 (2004). |
| [2] | M. Wang, Y. Lian, X. Wang, Current Applied Physics 9 (2009) 189-194. |
| [3] | Y. Shin, D. Lee, K. Lee, K.H. Ahn, B. Kim, Journal of Industrial and Engineering Chemistry, 14 (2008) 515-519. |
| [4] | L. Nicolais, G. Carotenuto, Metal-polymer nanocomposites, John Wiley and Sons, Inc., 2005. |
| [5] | L.L. Yang, X.D. He, F. He, Y. Sun, Alloys and Compounds, (2008) In press. |
| [6] | A.F. Craievich, Materials Research, 5 (2002) 1-11. |
| [7] | G. Beaucage, D.W. Schaefer, Journal of Non-Crystalline Solids 172 174 (1994) 797-805. |
| [8] | G. Beaucage, Journal of Applied Crystallography, 28 (1995) 717-728. |
| [9] | G. Kellermann, F. Vicentin, E. Tamura, M. Rocha, H. Tolentino, A. Barbosa, A. Craevich, I. Torraini, J. Appl. Cryst., 30 (1997) 880-883. |
| [10] | R. Zhang, A.C. Geiculescu, H.J. Rack, Journal of Non-Crystalline Solids, 306 (2002) 30-41. |
| [11] | P.L. Guzzo, A.H. Shinohara, M.A. Pasquali, E. Gusken, C.K. Suzuki, V.M. Azevedo, Y. Mikawa, J. Appl. Cryst 36 (2003) 459-463. |
| [12] | B. Debjani, M. Reghu, Chemical Physics Letters, 425 (2006) 114-117. |
| [13] | N. Hiramatsu, A. Nakamura, M. Sugiyama, K. Hara, Y. Maeda, Physica B 241-243 (1998) 987- 989. |
| [14] | E.A. Odo, D.T. Britton, G.G. Gonfa, M. Harting, The African Review of Physics 7(2012) 45-56. |
| [15] | S.V. Chavan, P.U.M. Sastry, A.K. Tyagi, Journal of Alloys and Compounds, 456 (2008) 51-56. |
| [16] | M.-H. Kim, Applied Crystallography, 37 (2004 ) 643-651. |
| [17] | R. Zhang, Y. X, Q. Meng, L. Zhan, K. Li, D. Wu, L. Ling, J. Wang, H. Zhao, B. Dong., Journals of Supercritical Fluids, 28 (2004) 263-276. |
| [18] | S. Pikus, E. Kobylas., Fibres and Textiles in Eastern Europe, , 11 (2003) 70-74. |