-
Paper Information
- Paper Submission
-
Journal Information
- About This Journal
- Editorial Board
- Current Issue
- Archive
- Author Guidelines
- Contact Us
International Journal of Composite Materials
p-ISSN: 2166-479X e-ISSN: 2166-4919
2014; 4(5): 213-218
doi:10.5923/j.cmaterials.20140405.03
Evaluation of Thin Nano-crystalline TiO2 Films Deposited by Spray Pyrolysis Method
 Abstract
 Reference
 Full-Text PDF
 Full-text HTML
Kamran Ahmadi
Material and Energy Research Centre (MERC), Tehran, Iran
Correspondence to: Kamran Ahmadi, Material and Energy Research Centre (MERC), Tehran, Iran.
| Email: |  |
Copyright © 2014 Scientific & Academic Publishing. All Rights Reserved.
Thin polycrystalline films of nano-size TiO2 were prepared by spray pyrolysis (aerosol was generated ultrasonically) for self-cleaning application. Titanium Butoxide aerosol was generated ultrasonically and deposited on the glass substrate. Substrate temperature was at 400°C for several durations, 3, 6, 12 and 24h in atmospheric media. The generated film at 3h has annealed at 600, 700, 800 and 1000 °C again in atmospheric media. Photo-catalyst applications of TiO2 film require specific analytical techniques to analysis structure, phases and morphology. The structure and formed phases in the films were characterized using X ray diffraction, Raman spectroscopy and scanning electron microscopy systems. The analysis verifies that the phase transformation of nano-size TiO2 grains in the films from amorphous to crystalline and from anatase to rutile phases has taken place. The transformation occurred by substrate temperature increment and evolved by annealing the films upon heating. The report presents an active and economic method to produce thin and uniform layer on the glass for self cleaning of the surface, which is novelty of the work.
Keywords: Spray pyrolysis, Titanium Butoxide, Raman spectroscopy, Photo-catalyst, Anatase, Rutile
Cite this paper: Kamran Ahmadi, Evaluation of Thin Nano-crystalline TiO2 Films Deposited by Spray Pyrolysis Method, International Journal of Composite Materials, Vol. 4 No. 5, 2014, pp. 213-218. doi: 10.5923/j.cmaterials.20140405.03.
1. Introduction
- Titanium dioxide (TiO2) is a multifaceted compound. A compound used to make toothpaste white and paint opaque. TiO2 is also a potent photocatalyst that can break down almost any organic compound when exposed to sunlight; numerous scientists are studying on TiO2's reactivity developing a wide range of environmentally beneficial products, including self-cleaning fabrics, auto body finishes, and ceramic tiles, (Diebold 2003; Honda et al 1994; Yan et al 1995). Titanium dioxide film is a host matrix for luminescent devices (Conde-Gallardo et al 2001) due to its photoelectric and photocatalytic properties used for photochemical converting in the solar energy conversion processes (Linsebigler et al 1995; Fujishima and Honda 1972; O’ Regan and Gratzel 1991). The compound is also a promising candidate as a dielectric material for the next generation of ultra-thin capacitors, due to its dielectric constant (Campbell et al 1999). Titanium dioxide is the only naturally occurring oxide of titanium at atmospheric pressure, observed in nature as well-known minerals rutile, anatase and brookite (Beltran et al 2006). Rutile is the most stable of the three types, (Henrich 1985) that is also in the equilibrium phase for all temperatures, (Jamieson and Olinger 1969). Rutile is a stable phase, while anatase and brookite are metastable and convert to rutile upon heating. The brookite phase is difficult to synthesize has not been appearing so far in thin film form, crystallized in the orthorhombic system and so is seldom studied, (Henrich 1985; Hanaor 2011).Generally, TiO2 anatase phase is crystallized in the tetragonal system, space group
 (I4/amd) (141) and has two TiO2 units per primitive cell with four molecules in the unit cell, so-called bipyramides, with a = 3.733Å and c = 9. 37Å where c/a=2.51. Amorphous TiO2 models have a distorted octahedral network structure with the mean coordination number ZTi−O ≈ 6.0 and ZO−Ti ≈ 3.0. Rutile with symmetry group
  (P42/mnm) (136), has two formula units per unit cell, crystallizes in the tetragonal system and a = 4.584 Å and c = 2.953Å where c/a=0.644, (Gonzalez and Zallen 1997) with coordinate number of 6:3 (octahedral, trigonal planar), (Hoang 2007).However, density dependence of the phases and more details about structural changes in the film via other structural properties such as mean inter-atomic distances, coordination number and bond-angle distributions reported by, (Petkov et al 1998). Rutile, anatase and brookite phases of titanium dioxide all contain six-coordinated titanium; the functional properties of the compound depend on its phase (Debnath and Chaudhuri 1991). The band gap energy of a semiconductor depends on various parameters in particular for nano-scale. The band-gap energies Eg of anatase and rutile phases of nano-size TiO2 thin film at particle radii of 40nm range are 3.20 and 3.06eV, respectively, (Cui et al 2008).Titanium dioxide coated on many building materials such as glass, tile, brick and cement. These films exhibit a self cleaning, antifogging or hygienic effect due to the strong oxidizing properties of TiO2 in a photochemical process. In this process, titanium dioxide absorbs ultraviolet radiation from sunlight or an illuminated light source (fluorescent lamps); it will produce pairs of electrons and holes. A semiconductor e.g. titanium dioxide in ' photo-excitation ' state i.e. illuminated by light, an electron from valence band becomes excited. The excess energy of this excited electron promoted the electron to the conduction band of titanium dioxide therefore creating the negative-electron (e-) and positive-hole (h+) pair. Since, the light wavelength necessary for photo-excitation of the TiO2 in anatase phase with 3.2 eV band gap is 388 nm. As a result, the anatase phase is more active than rutile and brookite with the larger band gap, which prevents band gap absorption of blue light (Yoldas 1984). Never the less, it would also be useful to note in wide areas of technology preferred to apply titanium dioxide in the form of rutile (probably, in those cases where the photocatalytic effect is contraindicated, such as pigments-colorants for plastics, Seonghyuk Ko, et. al. 2012).Traditionally, coating method to produce titanium dioxide films is falling into two categories. Chemical vapor deposition (CVD), such as plasma enhanced CVD, Sol–gel and atomic layer deposition, (Bennett et al 1989; Legrand-Buscema et al 2002; Battiston et al 2000). Physical vapor deposition (PVD), for example, thermal, electron induced, ion induced, and sputtering depositions. PVD systems equipped for the complicated vacuum devices, which commit scientist to find a simple method. Among many thin film processing techniques, spray pyrolysis deposition (SPD) technique the most promising newly developed one is no longer necessary for a complicated deposition process. The film is formed by SPD in atmospheric media by a simple apparatus has crystalline structures and flat surface feasibility. The main distinction between the SPD and CVD deposition techniques is the way that precursor materials reach the substrate surface (Viguie and Spitz 1975). The aim of current study based on the photocatalyst applications of TiO2 film that required specific analysis techniques. Associated structure, phases and morphology analysis undertaken. A powerful technique for phase analysis is the Raman spectroscopy. The signal strength of Raman spectrum is severely associated with chemical interaction of the irradiated beam with the nanosize TiO2 thin film. X ray diffraction is a common system for structural and phase analysis. In order to define the size and shape of the nanosize TiO2 particles in the films scanning electron microscopy designated.One of the known methods of film deposition on a substrate with the controlled nanosize crystallize is the ultrasonically generated source compound. TiO2 thin film with controlled nano-size particles has been prepared by spray pyrolysis (SP) method. Spray pyrolysis generates ultrasonically an aerosol from a precursor of Titanium Butoxide diluted in methanol. The system with basic parts has been reported by, (Kavei et al 2012). The precursor was a solution of Titanium (IV)Tert-Butoxide “titanium butoxide ([Ti(OCH2CH2CH2CH3)4], 97 wt% purity, Sigma–Aldrich) dissolved in methanol (Purity ≥99 wt%, Sigma–Aldrich). Titanium formulated at Butoxide/methanol concentration 17.5 gr/100 ml in volume (for appointed system volume 300ml methanol with 52.5 gr Titanium Butoxide) due to limitation exerted by the figure of merit of the mist maker in use. The aerosol molecules have a flux rate of ~3.5 l/min measured as, (Nakaruk et al 2010), directed toward the heated substrate at a temperature of 400°C and different intervals of time from 3to 24h. For detail study, deposited film of 400°C at 3h post annealed at temperatures range of 600-1000°C for 7h in the atmospheric media. Depending on the annealing temperature, resulting film was transparent to near infrared light and hue to visible region owing to degree of homogeneity and microstructure of the film, (Nakaruk et al 2010; Kavei et al 2011).Formed nano-size grains of the TiO2 structures in the films were analyzed by glancing angle X-ray diffraction (GAXRD, angle of incidence 1°, penetration depth <300 nm, Phillips X'pert Materials Research Diffraction. To confirm the results also implemented by standard X-ray powder diffraction, [XRD, 20°–80° 2θ, speed 0.02° 2θ/s, step 0.01° 2θ, scans done in situ, Phillips X'pert Multipurpose X-ray Diffraction System (MPD-Shurr) with 45kV and 40mA cathode voltage and current were applied respectively, in this way Cu Kα line (λ=1.5405 Å)].Phase formation examined using laser Raman microscopy (Renishaw in via, with the excitation source of 514nm (green) Argon ion laser integrated with an optical microscope). Minimum laser spot size was around 3 microns, which is ideal for structural studies of most inorganic samples. The resolution of the spectra is very sensitivity for detection beam radius and corona on the film surface in particular to study very thin layers.
 2. Results and Discussion
- A layer of water droplet on the TiO2 film decomposed when exposed to sunlight. The process expressed as; the positive-hole of titanium dioxide created by a photon breaks apart the water molecule to form hydrogen gas and hydroxyl radical. The negative-electron reacts with oxygen molecule to form a super oxide anion. This cycle continues when light is available. The overall mechanism of photocatalytic reaction of titanium dioxide depends on its constituent phases. The anatase phase is favorable for self-cleaning and super-hydrophobic surfaces. Fig. 1 shows Raman spectra of nano-size TiO2 films deposited at 400°C substrate temperature and annealed in air at 600-1000°C. Raman spectra of these films designated as deposited at 400°C, annealed at 600°C, annealed at 800°C and annealed at 1000°C, respectively. The spectra in the range of 100 to 800cm-1 have five peaks, 120, 236.6, 272.8, 448.5, and 608.8 cm-1 identical with the features of anatase phase that also reported by, (Bahtat et al 1996). The anatase phase is unstable tends to a stable phase at annealed states. Several new peaks at 142,196, 397, 513 and 634 monitored and attributed to rutile type, and therefore two phases of nano-size TiO2 can coexist.
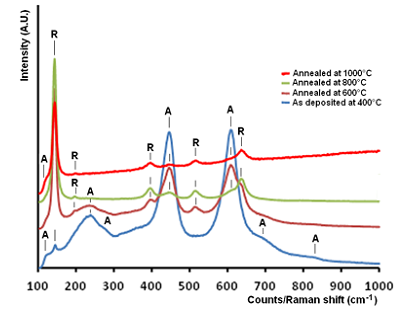 | Figure 1. Raman spectra of the films deposited on a substrate (fused quartz) the at 400°C substrate temperature and post annealed at 600-1000°C for 7h |
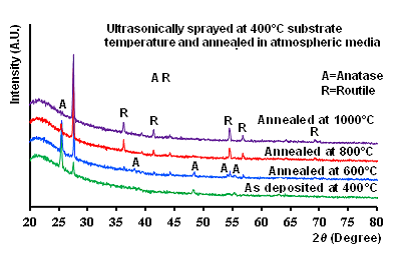 | Figure 2. XRD patterns of nano-size TiO2 film deposited ultrasonically at 400°C substrate temperature and annealed in air for 7 hours at 600-1000°C. At 400°C the peak appeared in 25° and 27.8° (2θ degree) for anatase and rutile phases respectively, the annealed samples show an increment on rutile peak intensity in expense of the anatase phase disappearance |
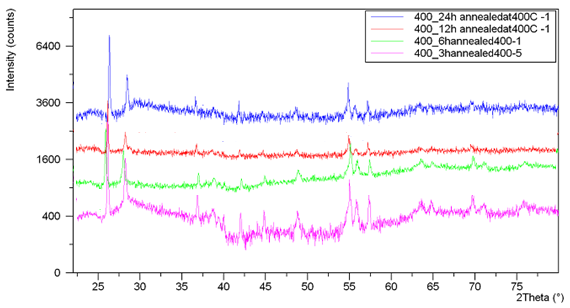 | Figure 3. XRD patterns of the film deposited at 400°C for several step durations. The temperature was kept for long durations at 400°C to stabilization of the coated compounds, no change appeared in structures |
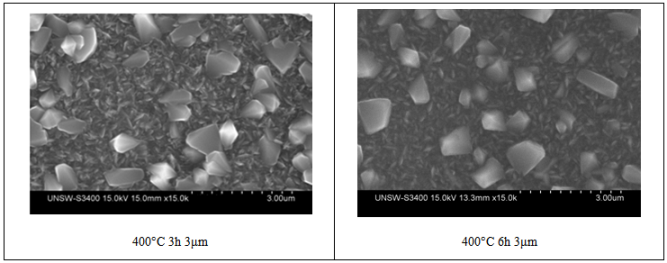 | Figure 4. Surface morphology of TiO2 films at different durations of heating at a 400°C substrate temperature, there is no major differences between the images |
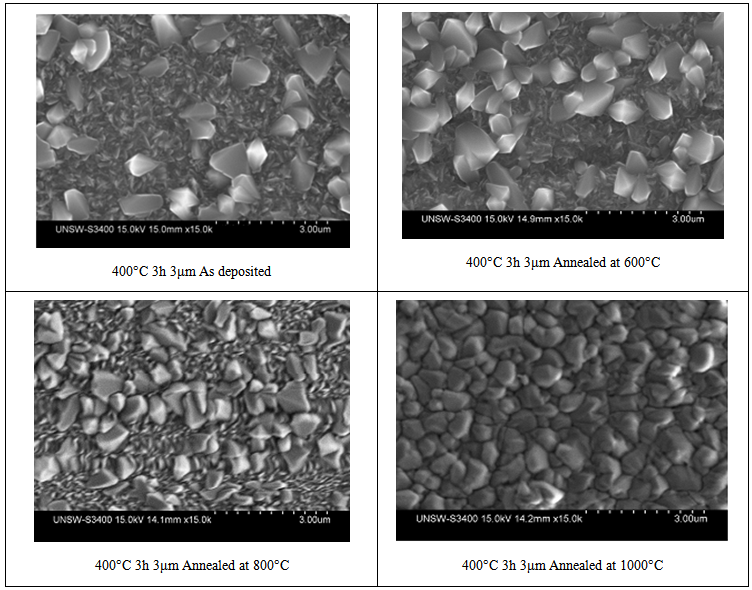 | Figure 5. Images of as-deposited film and annealed films at 600-1000°C, the film contained anatase phase (with small grain size ~ 100nm) and rutile phase (with large grain size ~ 500nm), respectively. The images display the transformation of anatase to rutile whereas at the 1000°C supremacy of rutile phase and disappearance of the anatase phase |
3. Conclusions
- Nano-size TiO2 thin film of pure anatase phase was prepared by ultrasonic spray pyrolysis at a constant deposition temperature of 400°C but different durations up to 24 hours. Owing to the instability of the anatase phase structural transformation from anatase to rutile type embarked when heat-treating temperature was performed over 600°C and completed at 1000°C. Annealing at 1000°C generates almost pure rutile TiO2 phase. In addition, Raman spectra of films indicate the internal modes of vibration with two kinds of structures that reported in several theoretical reports. Features have clearly sharp aspect ratios for anatase and rutile phases of the formed nano-size TiO2 films. Nanosized TiO2 deposited thin films produced and characterized by Raman, XRD and SEM systems found to be informative. According to XRD spectra, the fundamental transformation of anatase to rutile phase takes place at temperatures above 600°C for the film. Raman spectra show similar issue by weaken of the very strong line at 143 cm-1 which is the Raman active in the anatase form. Raman spectra of deposited films at 400°C for 3h duration and thermally annealed at 600°C up to 1000°C for 7h duration in our case are much more informative than XRD data. XRD, Raman and SEM data reflect that as the annealing temperature increases the rutile phase evolved at the expense of thinning the anatse phase. In these spectra two distinct features at frequencies of 448.5 cm-1 and 610.2 cm-1 has been identified and attributed to phase transformation and changing the atomic arrangement in the unit cell. Spectra at 800-1000°C expose an amorphous phase in parallel with the anatase-rutile transformation.