-
Paper Information
- Previous Paper
- Paper Submission
-
Journal Information
- About This Journal
- Editorial Board
- Current Issue
- Archive
- Author Guidelines
- Contact Us
International Journal of Composite Materials
p-ISSN: 2166-479X e-ISSN: 2166-4919
2014; 4(1): 14-20
doi:10.5923/j.cmaterials.20140401.03
Preparation and Characterization of Polyaniline/Zinc Oxide Composites via Oxidative Polymerization
 Abstract
 Reference
 Full-Text PDF
 Full-text HTML
S. D. Thakre1, U. B. Mahatme2, A. A. Dani3
1Department of Physics, Nagpur Institute of Technology, Nagpur, 441501, India
2Department of Physics K. Z. S. Science College, Nagpur, 441501, India
3Department of Physics, Priyadarshni College of Engineering, Nagpur, India
Correspondence to: S. D. Thakre, Department of Physics, Nagpur Institute of Technology, Nagpur, 441501, India.
| Email: |  |
Copyright © 2012 Scientific & Academic Publishing. All Rights Reserved.
In the present paper, zinc oxide and polyaniline (PANI) were synthesized by the chemical oxidation method. Composites of different molar concentration of aniline and ZnO nanoparticles have been prepared. During the polymerization of the monomer (aniline) by using an oxidizing agent (ammonium persulphate) and dopant (H2SO4) by constant stirring at 0 to -2℃, zinc oxide powder was added.Nanocomposites reveal the polycrystalline nature and show homogeneous distribution of zinc oxide in PANI. The d.c. electrical conductivities as a function of temperature (198-368 K) were measured by four probe technique. Electrical conductivity of composite with 35% weight of Zinc Oxide is found to be more among all other composites and even greater than PANI also. The crystallinity of the samples was examined by powder X-ray diffraction technique. Morphology of the samples was examined by SEM technique. The various electron transitions present in the PANI were examined by UV-VIS spectroscopy.
Keywords: Conducting polymers, Electrical conductivity, Polyaniline, Nanocomposites, ZnO nanoparticles
Cite this paper: S. D. Thakre, U. B. Mahatme, A. A. Dani, Preparation and Characterization of Polyaniline/Zinc Oxide Composites via Oxidative Polymerization, International Journal of Composite Materials, Vol. 4 No. 1, 2014, pp. 14-20. doi: 10.5923/j.cmaterials.20140401.03.
Article Outline
1. Introduction
- Recently, nanocomposite (NC) materials have become one of the most extensively studied materials all over the world as they have shown to possess several technological applications such as effective quantum electronic devices, magnetic recording materials, sensors etc.[1]. Moreover, nanocomposite material composed of conducting polymers & oxides has been open more fields of application such as drug delivery, conductive paints, rechargeable batteries, toners in photocopying, smart windows, solar cells, etc.[2,3]. The properties of NC materials depend not only on the properties of their individual parents, but also on their morphology and interfacial characteristics. Polymeric materials in the form of nanocomposites (NCs) are useful due to certain advantages such as high surface area to volume ratio. There has been a growing interest in new ways of producing conducting polymer[4].Among the conducting polymers, polyaniline (PANI) is one of the most studied intrinsically conducting polymers because of its interesting electrical conductivity, novel electronic structure[5,6] and mechanism of electrical conductivity[7,8,9] as well as the possibility for application as a new electronic material.The preparation of PANI with inorganic nanoparticles is thought to be a potential route to improve the performance of PANI aiming to obtain the materials with synergetic or complementary behavior between PANI and inorganic nanoparticles. Among the inorganic nanoparticles, zinc oxide (ZnO) has received great attention because of its unique catalytic, electrical, electronic and optical properties as well as their low-cost and extensive applications in diverse areas as discussed by He et.al.[10]. We believe that the incorporation of ZnO nanoparticles in PANI by chemical oxidative rout may result in new material with useful properties. In this paper, we report a simple method for the preparation of PANI/ZnO nanocomposite systems, their characterization by SEM, XRD, UV-vis spectroscopy and dc electrical conductivity.
2. Experimental
2.1. Materials
- Aniline monomer, zinc oxide, ammonium persulfate, acetone, methanol and sulphuric acid, all of GR grade, were purchased from a Merck company, and they were used as received without further purification process. Double distilled water was used throughout this work.
2.2. Synthesis of Polyaniline Nanoparticles
- The chemical polymerization of aniline was carried out in the presence of aqueous sulphuric acid solution. Appropriate amount of aniline (0.4 M) and 1M H2SO4 acid was added into 100 ml deionized water into the polymerization beaker. 0.4 M ammonium persulfate were dissolved in sulphuric acid (1 M) in 100 ml deionized water in second beaker. Both solutions were stirred at -2℃ for one hour. Then the second solution was added slowly to the aniline solution by drop wise fashion for 20 minutes. The color of the polymerization mixture has changed initially to light blue and then finally into dark green. The final solution was kept at constant stirring for 7 hrs. Then the solution was allowed to settle overnight. At the end of polymerization reactions, the final product was filtered, washed with distilled water and methanol, until the filtrate was colorless and dried at 60℃ in the oven, for 12 hours. The synthesized polyaniline salt was finally crushed, and the product is obtained in the form of fine dark-green powder.
2.3. Synthesis of Polyaniline
- The polymerization of the monomer (aniline) was initiated by the drop-wise addition of the oxidizing agent (ammonium per sulphate) in an acidified solution prepared, using doubly distilled water under constant stirring at 0 to -2℃. During this stirring for one-hour zinc oxide nanoparticles in different proportion with aniline was added for synthesizing the composites. The monomer to oxidizing agent ratio was kept at 1:1. After complete addition of the oxidizing agent the reaction mixture was kept under constant stirring for seven hours. The resulting dark-green mixture was kept overnight and then filter. The Precipitated polymer was filtered and washed with distilled water and methanol until the filtrate was colorless. Finally, the polymer was dried in an oven at 45℃ for 12 hours[11]. Similarly, for 15 to 35 weight % of ZnO were prepared.
2.4. Characterization
- Pallets of the samples were designed by using dye-punch of 1 cm diameter in a hydraulic press (scientific engineering corporation, India) under a pressure of five tons. The four probe set up model DFP-RM (SES Roorkee) was used to measure electrical conductivity of samples in pallet form. The pure ZnO, PANI and different compositions of PANI/ ZnO NCs were characterized by UV-VIS spectroscopy, SEM and XRD techniques.
3. Results and Discussion
3.1. X-ray Diffraction
- Figure 1(a), (b) and (c) shows XRD pattern of synthesized pure ZnO, PANI-ZnO (25%), and pure PANI. It is observed from these figures that the zinc oxide is uniformly dispersed in the polyaniline matrix. The XRD study suggests that PANI undergo interfacial interactions with ZnO crystallites and lose its own morphology by its mixing with ZnO crystals due to which the composites show less conductivity than that of pure PANI as confirmed from DC conductivity measurement of the synthesized materials.
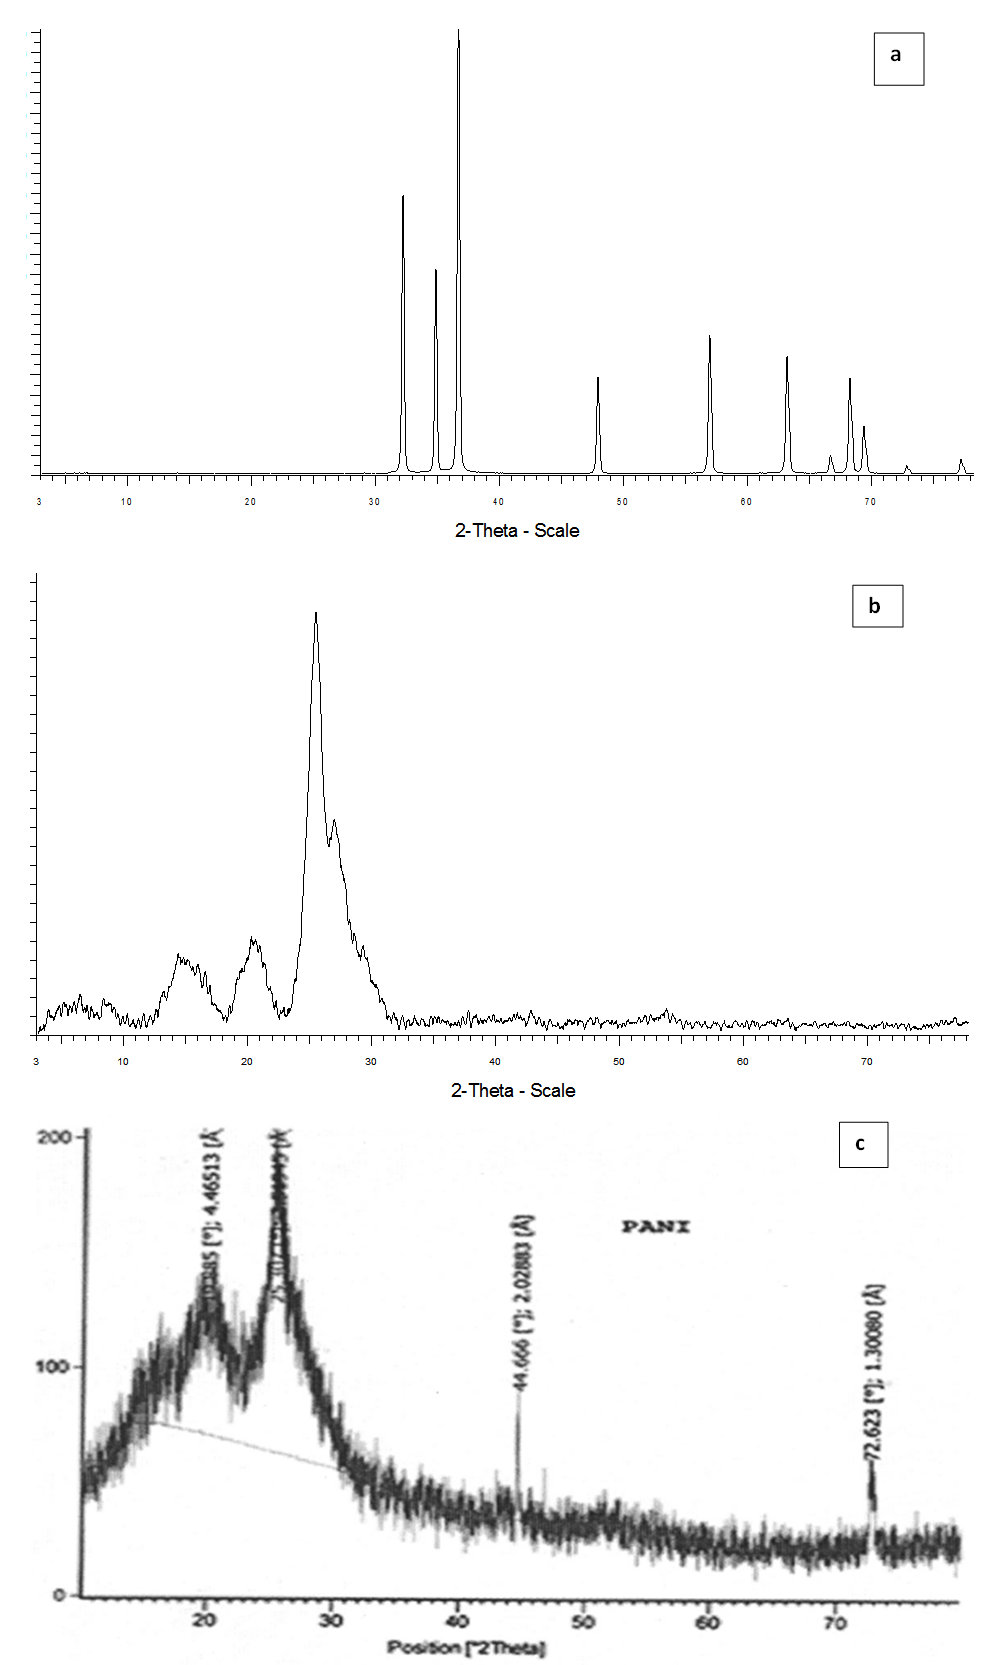 | Figure 1. X-ray Diffraction Pattern of (a)ZnO, (b)PANI/25% ZnO and (c)Sulphonated PANI salt |
3.2. Scanning Electron Microscopy (SEM)
- The morphology and particle sizes of polyaniline/ZnO nanocomposites are determined by SEM. The typical SEM micrographs of ZnO nanoparticles are shown in Figure.2 (a) which exhibits spherical morphology with particle size in the range of 172–197 nm. The typical SEM micrographs of Polyaniline/ZnO nanocomposites (25 weight %) are shown in Figure.2 (b). The typical SEM micrographs of pure polyaniline is shown in fig.2(c)The SEM micrograph reveals that polyaniline is deposited on the surface of ZnO particles, indicates that the nanocomposites are composed of polycrystalline ZnO particles and PANI, which is in accordance to the results by XRD analysis. It also indicates that most of the ZnO particles are finely dispersed in the PANI matrix, very few particles are clumped. In fact, it is the polymer matrix that plays the role of minimizing the aggregation of nanoparticles.
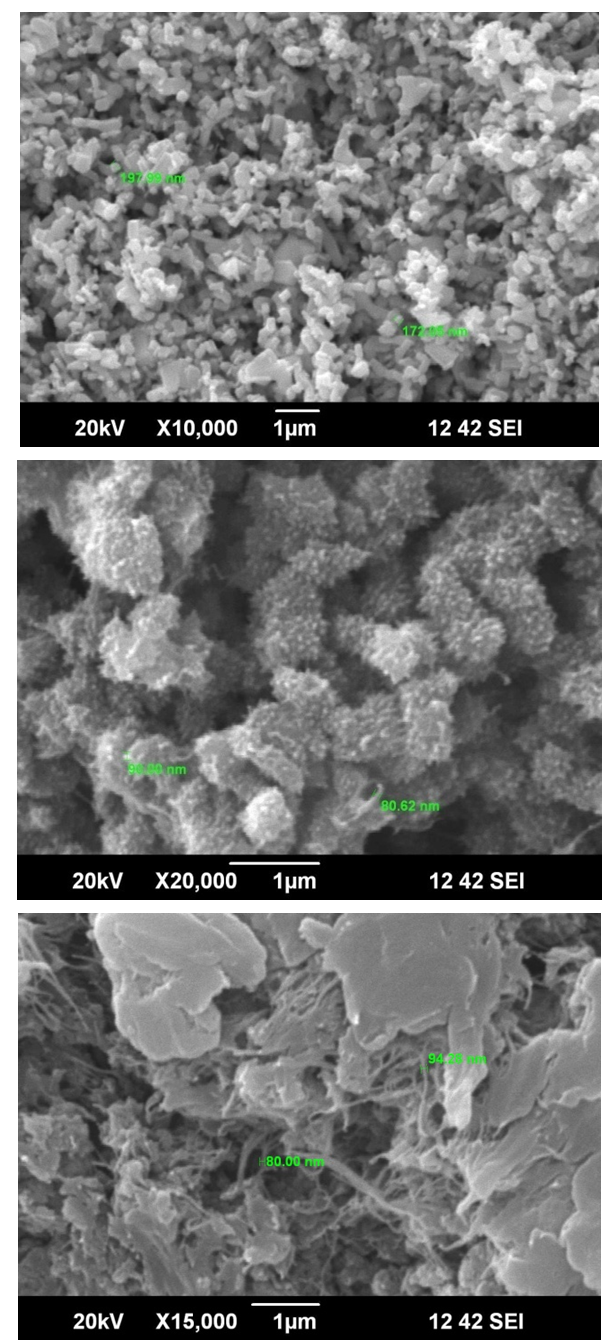 | Figure 2. SEM images of (a) ZnO (b) PANI-ZnO (25% weight) and pure PANI |
3.3. UV-VIS Spectroscopy
- Figure 3 (a), (b) and (c) shows UV-vis spectrographs of pure ZnO, PANI/25%ZnO, and pure PANI. UV-Visible spectra is helpful not only in identifying the nanomaterials but also the extent of conjugation in conducting polymers. In case of PANI, three characteristics bands appear at 330 nm, 609 nm and 649 nm which are attributed to π-π*, exciton and polaron transition respectively. In PANI/ ZnO composites, only one peak appears in the visible range of spectra. Second absorption peak lapses in the visible range.
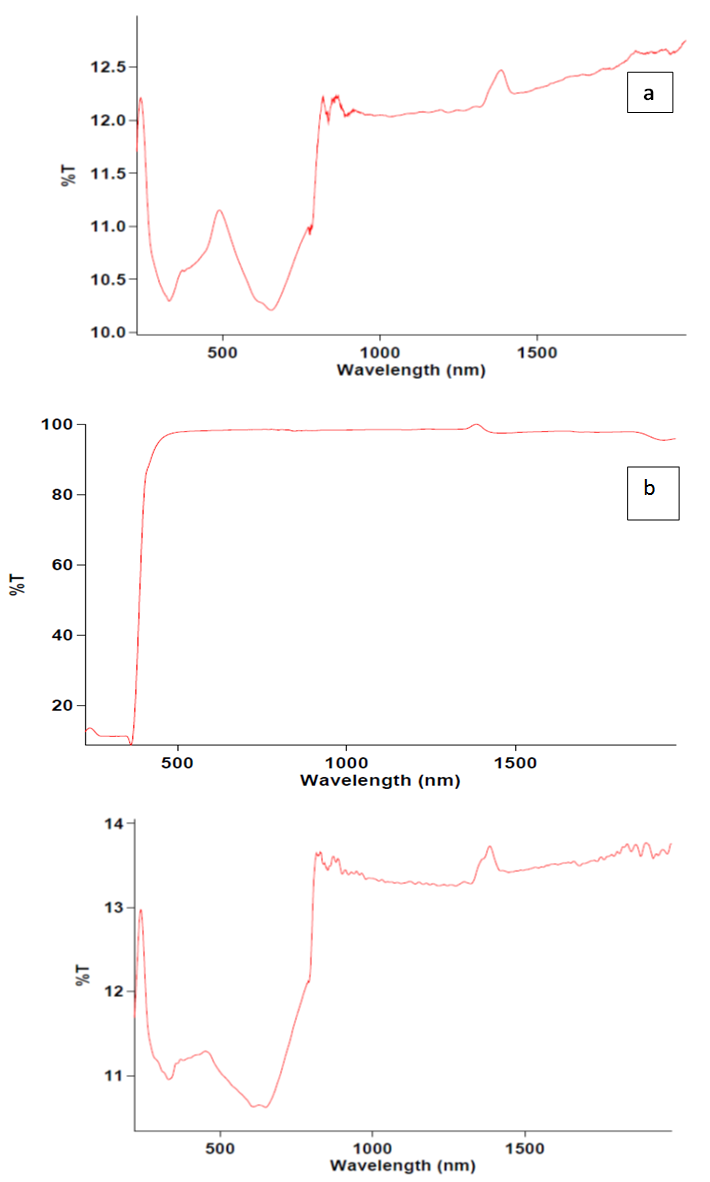 | Figure 3. UV-VIS spectrographs of (a) ZnO, (b) PANI/25% ZnO and (c) Sulphonated PANI salt |
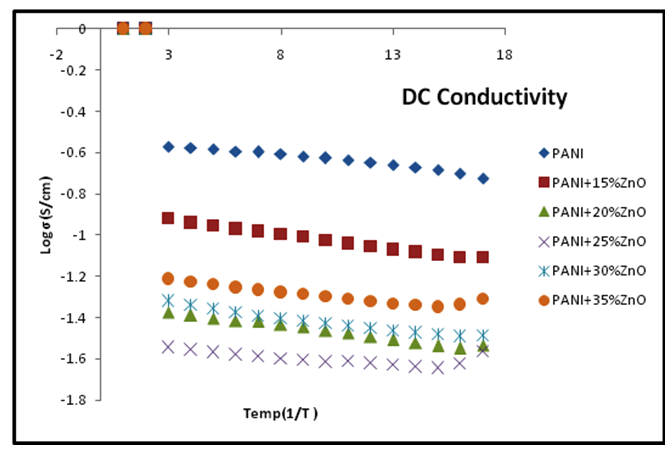 | Figure 4. Plot of surface DC conductivity Vs temperature for various compositions of PANI-ZnO composite |
3.4. DC Conductivity
- A plot of DC conductivity (σdc) of PANI/ZnO NCs versus temperature shown in figure 4. It has been observed that σdc of the composites is found to increase with the increase in temperature, representing the semi conducting nature of the nanocomposites. This increase in conductivity with temperature is the characteristic of “thermal activated behavior." The increase in conductivity could be due to increase of efficiency of charge transfer between the polymer chains and the dopant with an increase in temperature[10]. From this figure, we observe the increase in σ DC with temperature in composites, thereby indicating the behavior of disordered conductors. Further, composite of 15%ZnO shows the higher σdc values than other composites over the entire temperature range. An increase in conductivity of PANI/15%ZnO composite maybe due to more contributions of polarons and bipolarons bands formed in the wide-band gap of this composite[12]. The changes in the resistivity of the composites indicate a change in the doping state of the polymer.
4. Conclusions
- Polyaniline/ZnO NCs were successfully synthesized by the chemical oxidation method. The result of UV-VIS spectroscopy, XRD, and SEM shows the formation of the composite and indicates an interaction between PANI and ZnO. The conductivity of the nanocomposite decreases with an increase in the doping concentration of ZnO from 5.15 to 0.92 Scm-1. The temperature-dependent resistivity follows the VRH model of electrical conductivity for PANI and PANI/ZnO.
ACKNOWLEDGEMENTS
- Authors are thankful to Sophisticated Analytical Instruments Facility, Cochin for providing laboratory facilities.